Introduction
Land multicomponent seismic has garnered significant attention and demonstrated substantial growth in the last five years. The bulk of this growth in multicomponent activity has been in western Canada. While multicomponent seismic has been around for many years, historical cost and quality concerns have limited its use as a routine exploration tool. The current resurgence of multicomponent seismic on land is a result of acquisition advances, specifically the development of digital multicomponent sensors (Micro Electro Mechanical System, or MEMS) and processing developments including statics, noise attenuation advances such as polarization filters and prestack migration. One remaining difficulty to be overcome is in the interpretation – or perhaps the interpreter’s misconceptions – of multicomponent data.
On the acquisition side, MEMS technology is driving a multicomponent- specific recording revival. These tiny silicon dioxide accelerometers have been available for over a decade, yet only recently has technology allowed these miniature accelerometers to be manufactured with a noise performance compatible with seismic requirements. Both Input/Output and Sercel have adopted this technology in the design of unique micro-machined digital accelerometers specifically targeted at the seismic acquisition industry.
Recent processing advances include better statics algorithms, application-specific noise attenuation and prestack time migration. Although the routine use of multicomponent prestack depth migration is still a few years off, the depth domain is the most natural place for comparing and interpreting images from the different modes.
From an interpreter’s point of view, multicomponent data present numerous headaches and uncertainties. Today’s standard interpretation software does not lend itself well to multicomponent interpretation. Furthermore, the PS and SS volumes are much noisier and of lower frequency, and typically bear little resemblance in character to the familiar PP volumes. The registration process (event matching between the PP, PS and SS) is largely driven by the availability of dipole sonic logs. These dipole sonics are not as common as standard sonics and tend to be more affected by washouts and other problems with the borehole. Therefore, the quality control and petrophysics required for PS and SS interpretation can be much more complex.
Furthermore, many interpreters have not been able to identify a clear-cut situation where the additional components have been absolutely necessary. It is precisely this mind-set ("killer-application" or nothing) that hampers the further acceptance of multicomponent seismic data as an exploration and exploitation tool. Just as we would never drill a well based on AVO alone or on a prestack depth migration image alone, we should not expect multicomponent seismic to be a "silver bullet". Like any other type of additional information, it contributes supplementary independent data to help reduce risk when choosing well locations.
There is, however, some room for optimism: the potential benefits of multicomponent data include improved conventional P-wave data, more reliable rock property information, lithology discrimination, fluid identification, fracture and stress identification and characterization as well as improved imaging (for example below gas clouds, beneath salt and basalt and in low impedance PP reservoirs).
In this article, we review some of the latest developments in multicomponent technology including a brief overview of the MEMS sensors, recent processing advances including statics, ground roll attenuation and converted-wave PSTM, and four interpretation case histories that highlight the added value of multicomponent seismic data.
Acquisition
The New Generation of Recording Equipment
John Gibson, Howard Watt, Jim Roy, and Robert Kendall
VeritasDGC Inc., Houston, Texas
For standard P-wave exploration, the analog coil geophone has served the industry well for over seventy years. It is relatively inexpensive, rugged and reliable, and allows for flexible array designs, but it also presents limitations. The natural resonance of the analog coil geophone (for example, 10 Hz) limits the recorded signal fidelity at lower frequencies. Furthermore, the advent of 24-bit recording, improved processing options and cost constraints have lessened the concern, but not the need, for careful receiver-array design. For multicomponent applications the conventional geophone’s limitations become more noticeable. Vector fidelity and the response of one vertical and two horizontally deployed elements are severely limited unless the geophone is planted within a few degrees of perfectly level.
MEMS sensors offered to the seismic industry by Sercel (DSU3) and Input/Output (VectorSeis“) provide some decided advantages over prior multicomponent sensors. They include single sensor (point receiver) recording, direct digital output, improved vector fidelity, broadband linear phase and amplitude response, low harmonic distortion, measurement of sensor tilt, and reduced power consumption.
These are important performance characteristics for multicomponent seismic data acquisition, and directly relate to the quality of recorded data and their value in understanding the subsurface. It is essential that noise be minimized during converted-wave acquisition when using a single sensor at each station. Direct digital output produced through the integration of the sensor and field electronics virtually eliminates pick-up noise, cross-talk and sensitivity to leakage. Additionally, harmonic distortion is reduced considerably relative to conventional multicomponent geophones.
Vector fidelity is of considerable importance in accurately measuring true earth motion. It is determined primarily by the coupling of the sensor package to the ground, but also depends on the consistency of element sensitivity, cross axis rejection, sensor orthogonality and tilt of the deployed unit. MEMS-based 3C digital sensors provide vastly improved specifications for the above attributes together with capability for measuring and correcting sensor tilt. The net result is vector fidelity superior to that of conventional multicomponent systems.
The overall complexity and physical attributes of modern multicomponent acquisition systems are vastly reduced from previous generations. Figure 1 compares the system configurations for conventional geophone array, conventional multicomponent (3C), and MEMS 3C recording. Note that with MEMS-based recording systems, an array of receiver sensors is replaced by a single 3C MEMS sensor, or "point receiver." Traditional triphone ( 3C geophone ) recording often employs arrays.
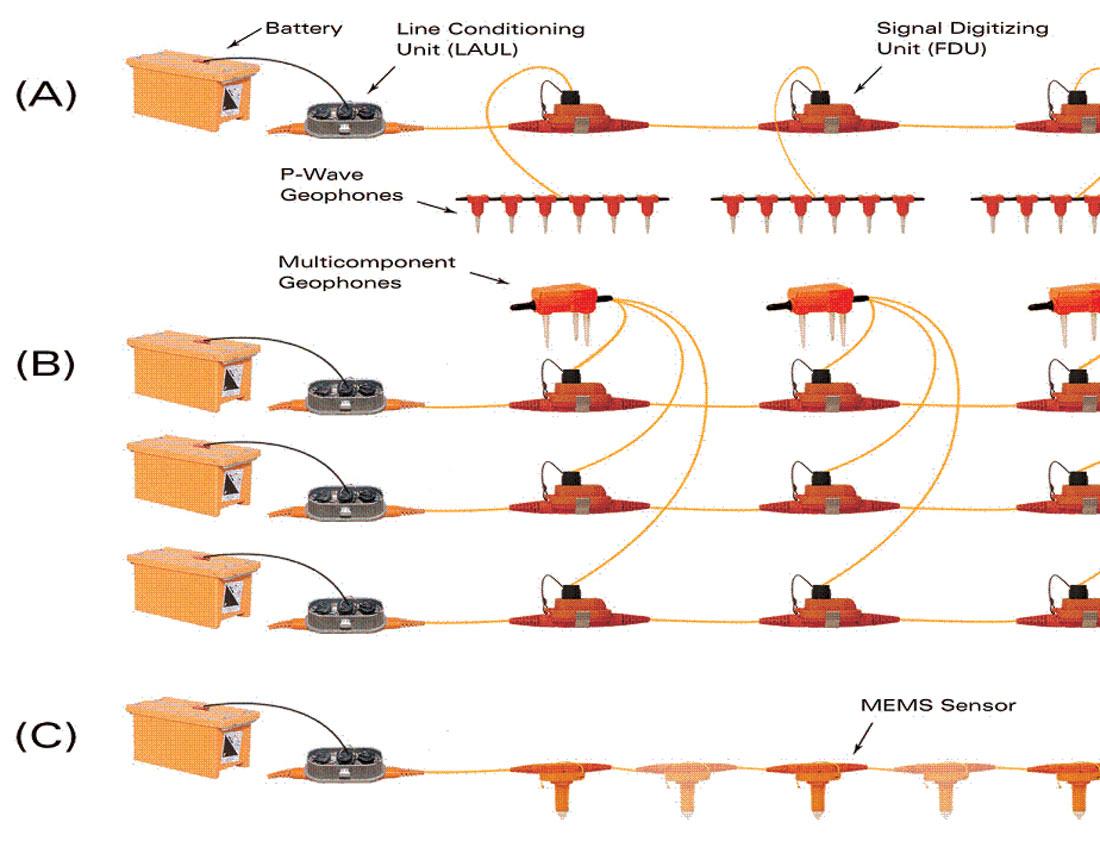
Point receivers are preferable for multicomponent recording. They are essential for implementing tilt corrections and establishing sensor orientation. Further, they provide isotropic recording for improved azimuthal analyses and higher resolution through elimination of intra-array effects, notably S-wave statics. On the other hand, single-sensor recording does not directly provide ambient and coherent noise rejection and thus proper sampling for converted-wave acquisition requires particular attention.
The operational advantages of recording multicomponent data with these new purpose-built multicomponent sensors are substantial. They require fewer connections and less cable, so the overall weight of the equipment is reduced. Field productivity is enhanced and sensor coupling improved since the sensor need not be adjusted for levelling purposes. The recording systems allow for the segregation of individual components into individual files thus reducing processing time and uncertainty. The final result is more accurate and affordable multicomponent acquisition.
Multicomponent Processing
Overview
In the last five years there there have been significant advances in multicompomponent processing and, in particular, converted-wave processing. Some of the biggest obstacles to obtaining high-quality (high S/N) and high frequency results were deficiencies in datuming, statics, noise attenuation, azimuthal anisotropy considerations and anisotropic prestack time migration. All of these processing steps are critically intertwined and overall improvements in the final section will be a result of small improvements at each stage. Datuming and statics go hand in hand; for interpretation purposes, it is important that the two volumes (PP and PS) be processed at the same datum and all statics referenced back to this common datum. Furthermore, shear statics are typically large and unrelated to the P-wave statics and it is not possible to derive them with conventional refraction methods. Polarization techniques using single sensor multicomponent receivers have shown great success in ground-roll attenuation. Azimuthal anisotropy corrections allow for more accurate velocity and static solutions. Finally, anisotropic converted-wave prestack time migration offers an affordable and relatively accurate imaging solution.
Multicomponent Processing – Datums, Binning and NMO
Graziella Kirtland Grech
VeritasDGC Inc., Calgary, Canada
The conventional P-wave NMO equation assumes that all shot-receiver pairs for traces within a midpoint gather are at the same elevation. Data are typically processed to meet this assumption by the application of statics. While this method is applicable in areas of minimal topography, it progressively breaks down in areas where topographical variations exceed a few tens of meters, making accurate velocity analysis difficult. In order to account for elevation differences between the shot, receiver and common conversion point (CCP), the paths and, therefore travel times, from shot to the CCP and from the CCP to receiver have to be considered separately (Figure 2).
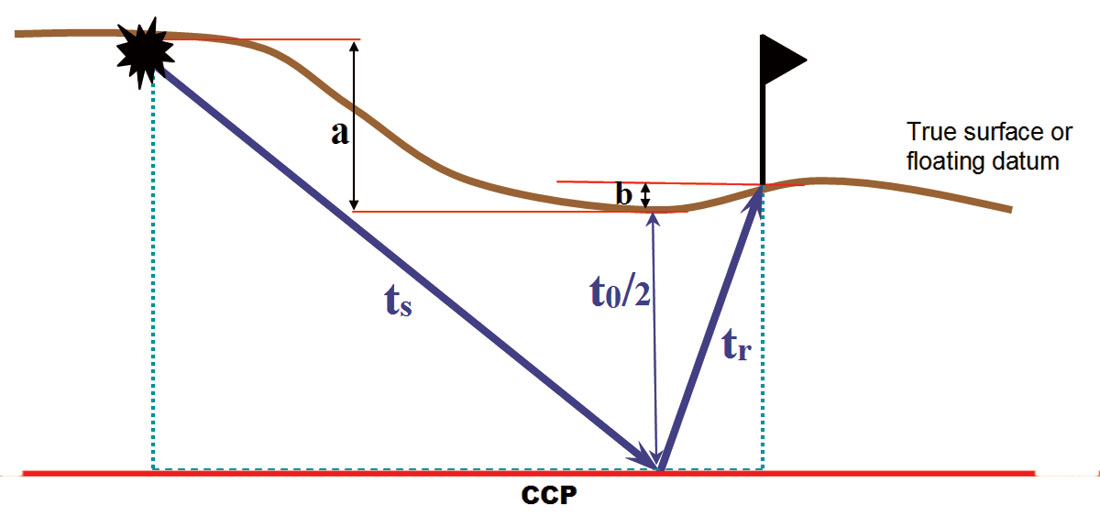
Elevation differences can be accounted for in NMO by describing the total travel time from source to receiver by using the double square root (DSR) equation - similar to that commonly used in prestack imaging – rather than the conventional single square root NMO equation.
In practice, because of the presence of the near-surface low-velocity or weathering layer, drift static corrections have to be computed first. These can be done in a surface-consistent way to a floating datum, and NMO with the DSR equation can follow. Velocity analysis is performed by scanning a cube of constant velocity stacks, or by other techniques. A temporally and laterally varying velocity function is interactively picked and applied to the gathers. Such a flow is also compatible with prestack time migration surface-consistency requirements.
Reference
Grech, M. G., Miao, X., and Zhu, T., 2004, A Velocity analysis procedure for multicomponent data with topographic variations, CSEG National Convention, May 2004, Calgary.
Multicomponent Processing – An SVD-polarization filter for ground roll attenuation on multicomponent data
Kristof DeMeersmen, University of Leeds, Leeds England and Robert Kendall,
VeritasDGC Inc., Calgary, Canada
In many cases, the success of a land survey partially depends on ground roll suppression and the recovery of low frequency reflections. These issues are important in survey design and data processing. The traditional approaches to attenuate ground roll include the use of source and receiver arrays, the stack array method (Anstey, 1986), or filtering in the frequency, f-k, _-p, or wavelet domains. Here we focus on the ground roll problem for multicomponent data. The manner in which these data are acquired often prevents the use of many traditional attenuation techniques. The use of source and receiver arrays becomes especially impractical for 3D surveys, and more generally, intra-array S-wave statics can not be neglected. In 3D, the tight restrictions the stack array method puts on fold and CDP bin population are often not met (Anstey, 1986). Despite this, multicomponent data provide the geophysicist with the opportunity to apply powerful ground roll attenuation methods. One such method that uses full wavefield information is adaptive polarization filtering.
The polarization filter we present here combines previous efforts by Franco and Musacchio (2001) and Liu (1999) with the concept of complex polarization analysis (Vidale 1986). SVD decomposes the data into its elliptically and linearly polarized components. In contrast with f-k and tau-p filtering methods, the polarization filters are essentially a station by station process which is independent of spatial sampling. This feature makes polarization filters applicable in 3D, where spatial sampling in the cross-line direction is a problem for other methods. Also, the design of the 3D surveys can focus more on sampling the signal than on sampling the noise.
Filter Theory
For the 3C case, our adaptive filter in matrix notation is:

with

Here, Df is the t by 3 matrix in which the columns hold the filtered vertical, inline and crossline seismograms of a given 3C station. D is a matrix with same dimensions as Df, but its columns now hold the unfiltered analytic signals of the vertical, inline and crossline components. Dlp is the t by 3 matrix with low-pass filtered analytic signals from the n selected neighboring 3C stations. A constant moveout correction, relative to the 3C station of interest can be applied to the different samples in Dlp. F(t) is a 3 n by 3n time-dependent filter operator and S is the sparse matrix whose nonzero elements relate to the 3C station that is being filtered. The factor (Dlp F(t) S) represents the analytic signals of the estimated ground roll. The filter operator, F(t) is derived using the first eigenvector v(t)1 of the time-dependent data covariance matrix C(t). C(t) is calculated using the rows d(t)lp of Dlp for the time-window [t-T t+T]:

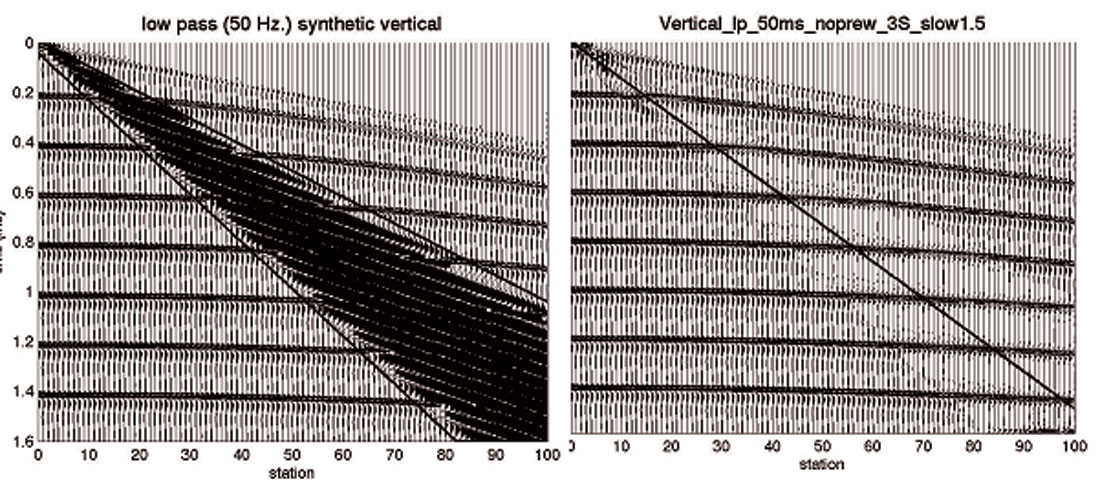
We first use a synthetic shot to test the filter. A wide range of filter parameters were tested on the synthetic shot gather to determine the filter that best removes ground roll while preserving the signal. Tests showed that the main parameters controlling filter performance are the frequency application bandwidth and the design window. The length mainly controls the amount of energy that is removed and wider filters are better at preserving reflected energy. Figure 3 shows that the polarization filter effectively removes the ground roll noise while preserving the reflection signal.
We next test the filter on two real data examples (Figures 4 and 5), one from Eastern Europe (2D-3C) and the other from East Texas (3D-3C). Both examples use MEMS recording technology. The polarization filter is applied on raw 3C shot gathers after tilt correction. Ground roll frequencies are usually restricted to the 0- 15 Hz band and peak at approximately 8 Hz. Moreover, within this band the signal-to-noise ratio is very low and a >30 dB power difference between ground roll and signal is common. The ground roll is dispersive and spatial sampling is sufficient to avoid spatial aliasing. However, we will also show that our polarization filter works on aliased ground roll when the filter width is one trace.
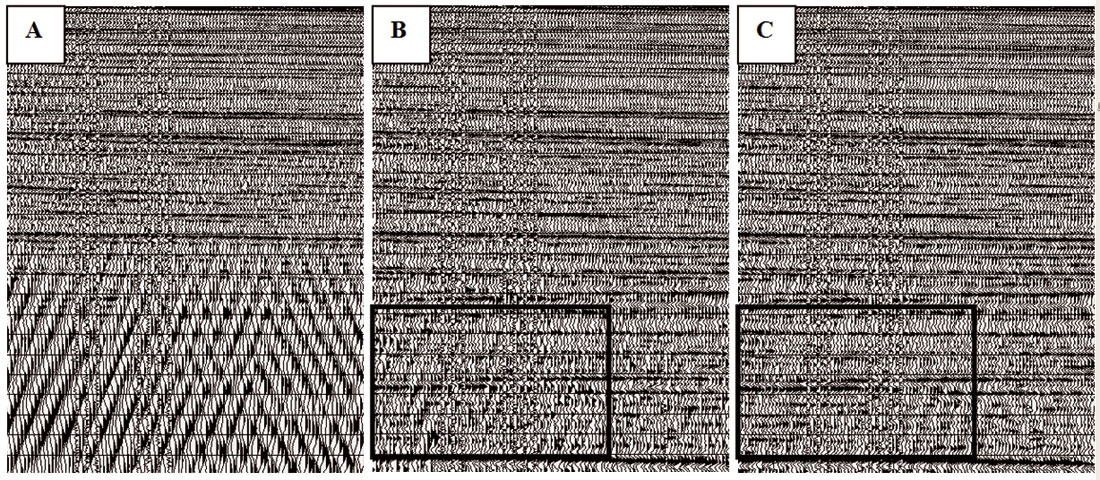
Figure 4 shows an example fro m Eastern Europe. In this case we show the shot gathers for both the vertical and inline components, before and after filtering. The ground roll in this area is very strong and dispersive and the polarization filter does a good job of attenuating the surface noise.
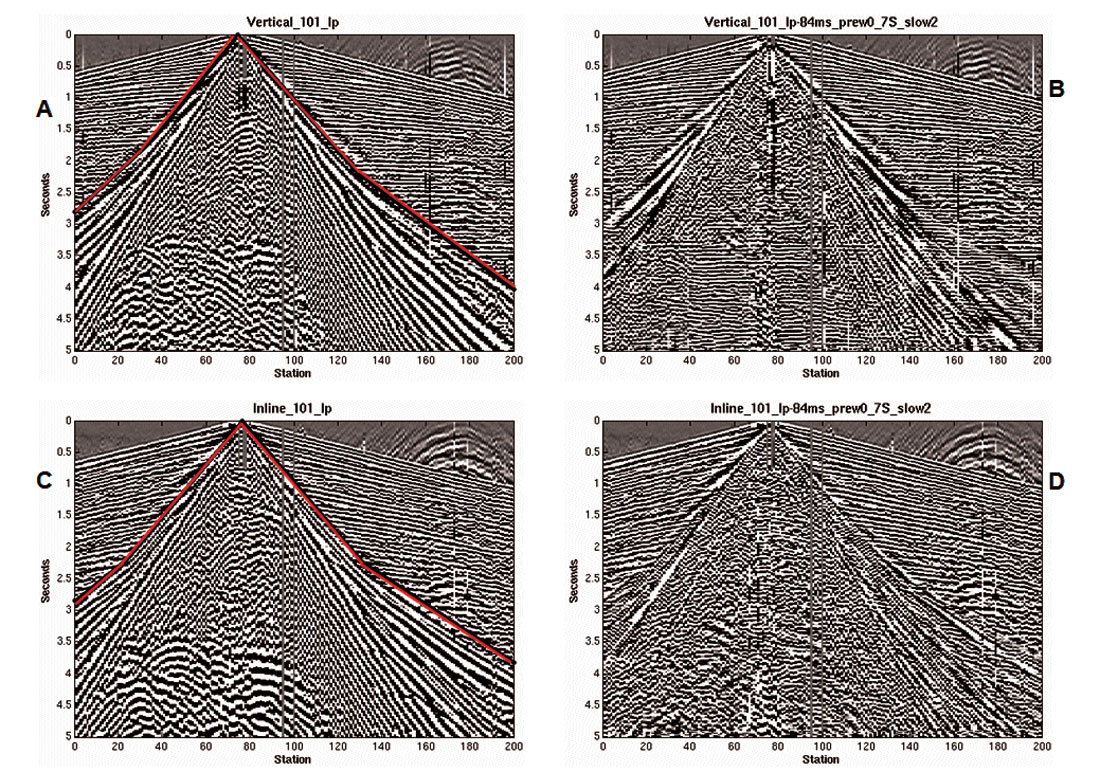
Figure 5 shows the stacked sections from the previous example for the nonfiltered, f-k filtered and polarization filtered. In this extreme case of ground roll, the noise has remained through the deconvolution and stack processes. While the f-k filter does a good job of attenuating the noise, the polarization filter does a better job.
In Figure 6, a shot record from East Texas is shown. Figure 6a is the raw shot; Figure 6b is the shot after the application of the polarization filter; Figure 6c shows the difference. Note that only the zone that was contaminated by ground roll has been affected by the filtering. This is due to the fact that the polarization filter can also detect the ground roll in addition to being able to remove it (Jin and Ronen, 2005). The detection is particularly beneficial to the preservation of the signal since we can apply the filter only when the ground roll is detected. It also makes the polarization filter more practical by eliminating the requirement of ground roll picking.
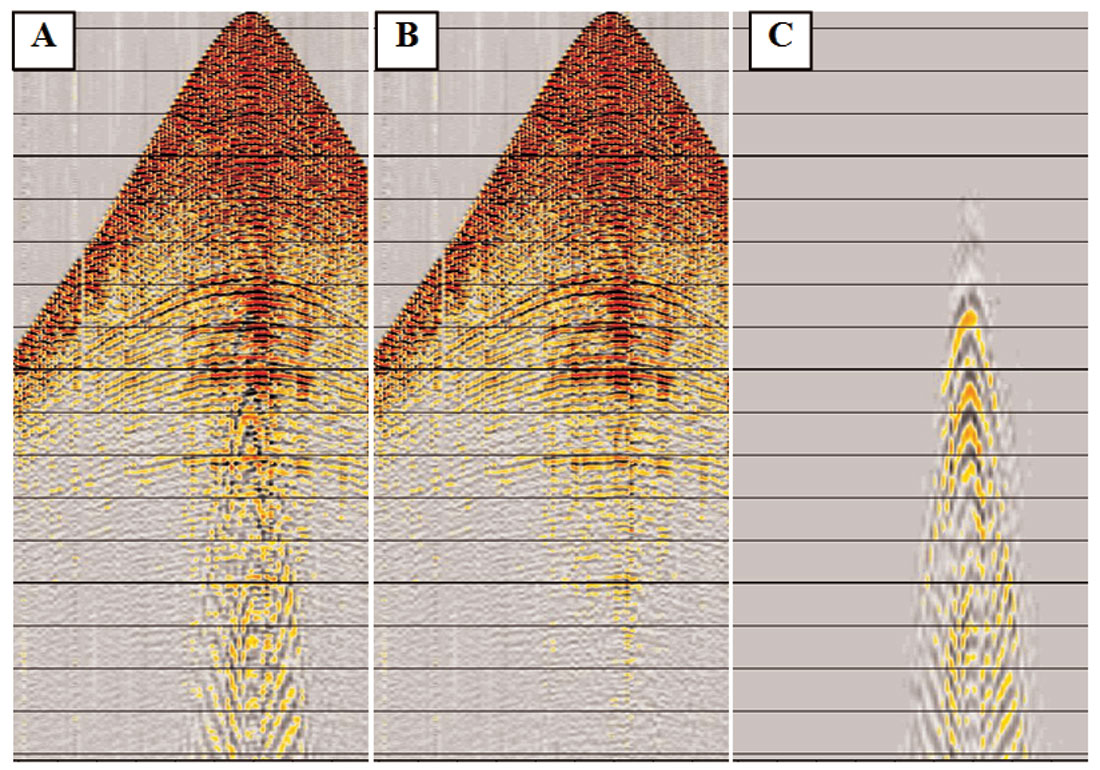
In both the shot record examples (Figures 4 and 6), the signal-to-noise improvement is obvious as reflections that were previously invisible are now clearly resolvable on the gathers.
Adaptive Polarization Filtering Summary
Our work demonstrates the use of SVD polarization filters to attenuate ground roll on 3C data. The filter can be applied station-by-station and is therefore not subject to spatial sampling. In particular, it is applicable in 3D without having to design the survey with the dense sampling required for avoiding spatial aliasing of the noise in the inline and in the crossline directions. Using the test-data we were able to improve signal-to-noise in the ground roll band on the vertical component by approximately 30 dB.
References
Anstey, N., 1986, Whatever happened to ground-roll?, The Leading Edge, 5, 40-46.
Franco, R., and G. Musacchio, 2001, Polarization filter with singular value decomposition, Geophysics, 66, 932-938.
Jin, S. and Ronen, S., 2005, Ground roll detection and attenuation by 3C polarization analysis, 67th Mtg.: Eur. Assn. Geosci. Eng., B020
Lui, X., 1999, Ground roll suppression using the Karhunen-Loeve transform, Geophysics, 64, 564-566.
Vidale, T., 1986, Complex polarization analysis of particle motion, Bulletin of the Seismological Society of America, 76, 1393-1405.
Multicomponent Processing – Anisotropic Converted-wave Prestack Time Migration
Xiaogui Miao, Sam Gray, Robert Kendall
VeritasDGC Inc., Calgary, Canada
Preserving amplitudes in converted-wave prestack migration is important for subsequent AVO prestack processing and interpretation. However, it has not received as much attention as amplitude preservation for P-wave migration. As multicomponent land and OBC data acquisition become more widely available, converted-wave prestack migration is becoming a more routine process in seismic exploration and development. Converted-wave data also contain additional information about velocities (Vp and Vs) and other rock properties. Extracting this information from converted-wave data by means of PS AVO, joint PP/PS inversion, and other interpretive processing has attracted some attention; in addition, it has placed a critical requirement for the preservation of amplitude information in processes such as prestack migration.
For the converted wave, few papers address the true amplitude issue for prestack Kirchhoff migration because of complications due to asymmetric scattering angles. We start fro m Bleistein’s Kirchhoff inversion/migration formula and derived true amplitude weight functions in a v(z) medium for common offset Kirchhoff migration for both 3D and 2.5D. Please see Miao (2005) for a full derivation.
Since 2.5D ray theory and migration characterize in-plane propagation of waveforms from a point source in 3D, they more closely represent reality than 2D in-plane propagation, which does not recognize the out-of-plane geometrical spreading of waves. We have derived a 2.5D amplitude weighting scheme and implemented it for our 2D migration. We also tested it with synthetic data, which shows more accurate amplitude behaviors than the 2D weight.
In our implementation, the true amplitude weights for both 3D and 2.5D have been simplified to functions of travel time and velocities, which can be easily obtained from pre-computed travel time tables. The simplified versions demonstrate negligible computational cost over that of conventional migration. The numerical modeling tests have shown well-controlled amplitude behavior that successfully recovers amplitudes along depth and offset for both 2.5D and 3D cases.
In our implementation, the true amplitude weights for both 3D and 2.5D have been simplified to functions of travel time and velocities, which can be easily obtained from pre-computed travel time tables. The simplified versions demonstrate negligible computational cost over that of conventional migration. The numerical modeling tests have shown well-controlled amplitude behavior that successfully recovers amplitudes along depth and offset for both 2.5D and 3D cases.
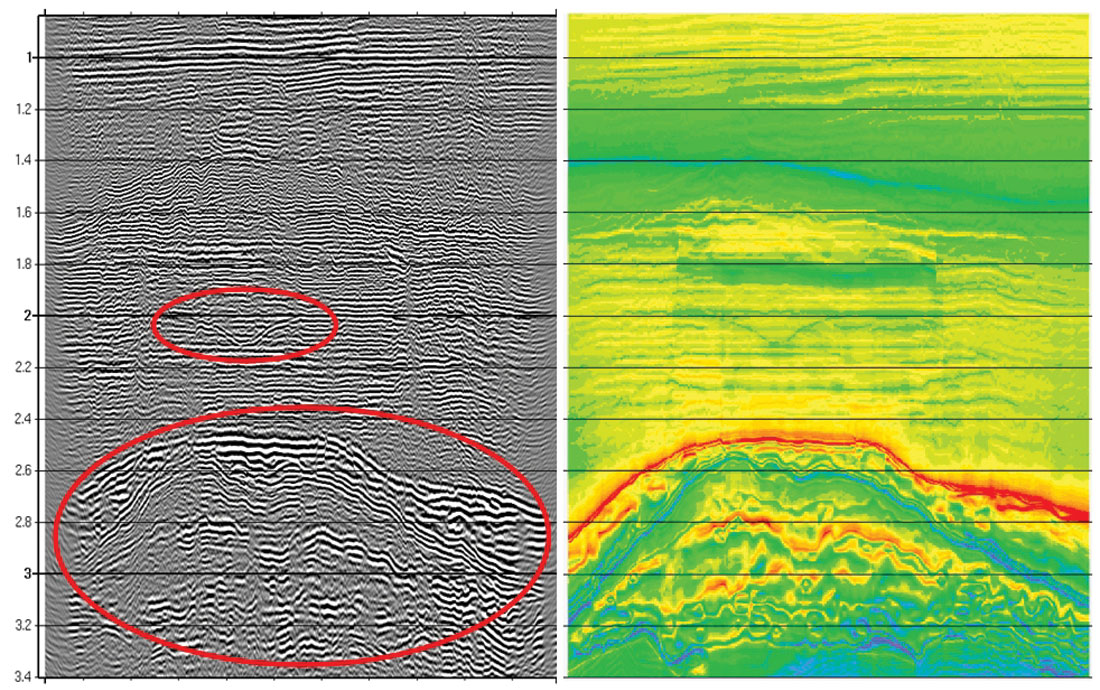
We have prestack depth migrated a converted-wave synthetic data set that was modeled on North Sea structures with our true amplitude weights. The non-scaled migrated converted-wave depth image is shown in Figure 7. The amplitudes on the migrated image are very well balanced for the whole section, and the migrated structures agree extremely well with the derivatives of PS impedance (rho*Vs) model.
Reference
Miao, Xiaogui, et al, Converted wave true amplitude prestack Kirchhoff migration, 2005 CSEG National Convention, May 2005, Calgary
Multicomponent Processing – Statics
Robert Kendall,
VeritasDGC Inc., Calgary, Canada
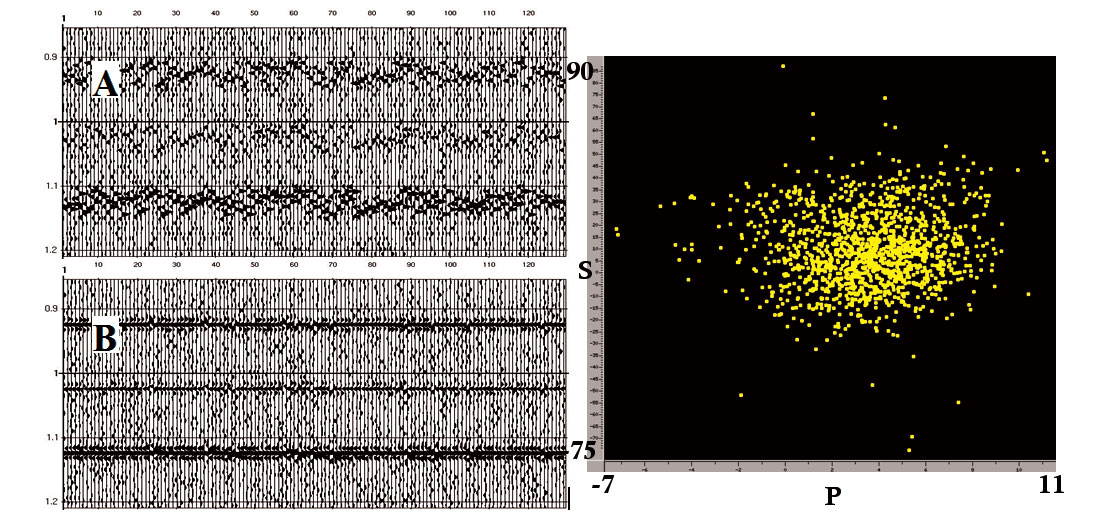
Static corrections are a key step in converted-wave processing and also one of most difficult. Converted waves have been used for reservoir characterization and seismic imaging for many years, however, only in the last few years have robust converted-wave statics correction methods been developed. Converted-wave (P-SV) statics have many features different fro m conventional PP data and require special consideration. One consideration is the large magnitude of converted wave statics which can be up to ten times greater than the P-wave statics (Figure 8, right). This often produces cycle skips when attempting to use conventional residual statics algorithms to resolve them. Another feature is that the converted waves are generally much noisier than P-P data. This makes it less reliable to pick time delays in CCP (Common-Conversion-Point) gathers. P-wave statics are typically not related to S-wave statics in a simple and predictable manner (Figure 8, right). One reason for this is that the shear waves respond differently to the water table than do the P-waves. Consequently, most P-wave statics methods do not work well for converted-wave data. Furthermore, some misalignment in reflectors may be due to anisotropy and the resultant shear-wave splitting (PS1 and PS2). So running residual and trim statics on the PSV or radial data may indeed be removing some of the information that is necessary for azimuthal anisotropy analysis.
Recent advances have been made in solving the receiver-side shear statics of the converted-mode in the last few years. Since a converted-wave first break does not exist, we have to use other methods to determine the very slow, shear weathering statics. We use combinations of P-wave horizon-based pilots for correcting the receiver stacks (Grech, 2004), and cross-correlation techniques in the receiver domain (Jin, et al., 2004).
Assuming the shot statics are obtained from conventional P-wave processing and applied to the converted waves, only the shear receiver statics are then required. Jin et al. (2004) have shown that a modification to Cary and Eaton’s (1993) method of obtaining an initial estimate of large, short-wavelength receiver statics by optimizing the trace-to-trace coherence of the Common Receiver Stack (CRS) can be very effective. The solution of the inverse problem is the one that minimizes the trace-to-trace time difference within a trace window. This inversion can better handle the uncertainty of time delay picks in the presence of noise, because the cross-correlation coefficients are used as weights in the optimization process to limit the influence of bad picks on the solution. Figure 8 (left) is a synthetic data example that demonstrates how this technique can resolve large statics. Figure 8a shows the Common Receiver Stack with significant statics. Random noise has been added to make the data more realistic. Note that the reflectors are aliased due to large statics. For this kind of data, pilot trace methods are impractical. Figure 8b shows the CRS sections after statics correction obtained by the weighted inversion. Although the data are so noisy that few maximum crosscorrelation coefficients are larger than 0.5 and many picks are erroneous, we can see that the method is still correctly estimating most of the statics.
References
Cary, P.W. and Eaton, D.W.S., 1993. A simple method for resolving large converted-wave (P-SV) statics. Geophysics, 58: 429-433.
Grech, M., Cheadle, S., Miao, X., and Zhu, T., A Velocity analysis procedure for multicomponent data with topographic variations, 2004 CSEG National Convention, 11 – 13 May 2004, Calgary
May 2004, Calgary Jin, S., Li, J., and Ronen, S., 2004, Converted wave statics correction by inversion of trace time shifts of common-receiver stack, EAGE 66th Conference & Exhibition, Paris, France, 7 - 10 June 2004.
Multicomponent Processing – Azimuthal Anisotropy Analysis
Richard Bale,
VeritasDGC Inc., Calgary, Canada
The most direct seismic method of estimating vertical fracture orientation and intensity is by analysis of shear-wave splitting. Shear-wave splitting arises when a shear wave naturally polarizes into a fast wave (S1) parallel to the fractures and a slow wave (S2) perpendicular to them. This can happen when the seismic wave travels through a fractured media. A common way to detect the direction of fractures from shear-wave splitting is to rotate the horizontal components to radial and transverse components, and then search for azimuthal directions in which the transverse component changes polarity.
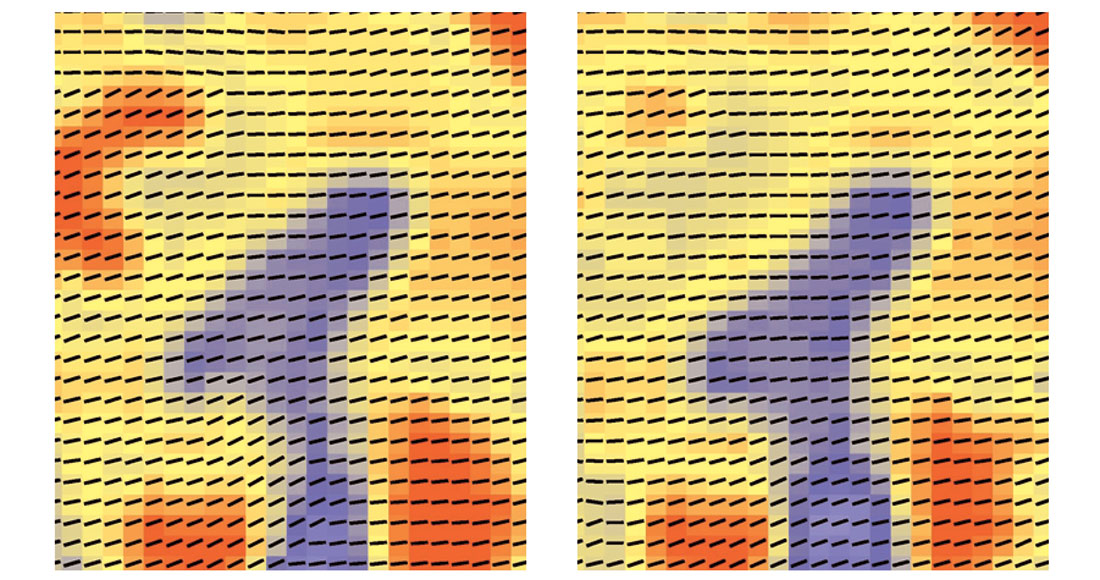
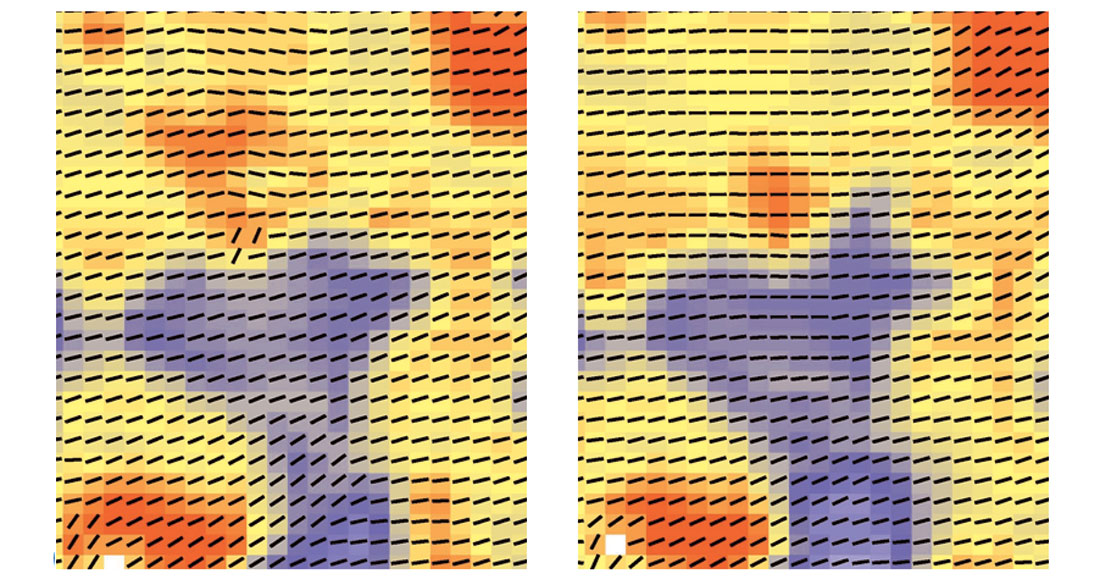
Azimuthal sampling can have an impact on standard methods of estimating fracture orientation from shear-waves. Although regular azimuthal coverage can be ensured by using large analysis bins and offset ranges, it may not be necessary to do this. A new least-squares algorithm (Bale et al., 2005) using transverse component amplitudes is designed to be less sensitive to the azimuth distribution of the input. Comparison with a pure polarity based approach shows the new method to be more accurate on a synthetic test. A field data example is shown in Figures 9 and 10, comparing the estimates of fracture direction using the least-squares method with a standard technique based upon scanning for polarity changes. In Figure 9, all azimuths were included in the analysis, leading to very comparable results for the two methods. In Figure 10, half of the azimuths have been omitted, corresponding to the first and third quadrants. The polarity based results are adversely affected in some areas [compare Figures 9(a) and 10(a)], whereas the least-squares method remains largely unaffected by the azimuth decimation [Figures 9(b) and 10(b)].
Reference
Bale R.A., Li J., Mattocks B., Ronen S., 2005, Robust estimation of fracture directions from 3-D converted-waves, 75th Ann. Internat. Mtg: Soc. of Expl. Geophys.
Multicomponent Interpretation
Perhaps the largest obstacle in the continued development and ultimate acceptance of multicomponent seismic is the seismic interpreter. From an interpreter’s point of view, multicomponent data introduces additional complexity and thus generates new headaches and uncertainties. Conventional P-wave interpretation software does not lend itself well to multicomponent interpretation.
Furthermore, the PS and especially SS volumes are much noisier, lower frequency and typically bear little resemblance in character to the PP volumes. The registration process (event matching between events on the PP, PS and SS volumes) is largely driven by the availability of dipole sonic logs. These dipole sonics are not as common as standard sonics and can often contain erroneous information, making the quality control and petrophysics required for PS and SS interpretation potentially much more involved. The analysis of this extra information will, of course, take more time. As a result these additional data might be viewed by the interpreter as more of a hindrance, not helping to narrow down uncertainties about reservoir properties.
New, multicomponent-specific interpretation software such as Veritas Hampson-Russell’s (VHR) ProMC, make the interpretation of multicomponent seismic much more convenient. The new software provides the means of incorporating dipole sonic and conventional sonic logs into the interpretation workflow. Horizon picking and event registration are easy to do on multiple sections simultaneously. Furthermore attribute generation, such as Vp/Vs maps, instantaneous frequency, amplitude ratios, etcetera is possible. Once the registration is done, further analysis, such as PS-AVO can be pursued.
The following case histories are examples of how multicomponent seismic is adding value, reducing risk, and proving the additional interpretation effort worthwhile.
Case Study 1: Improved P-wave Imaging of the Darby Thrust Fault using Multi-Component Seismic Receivers
Shuki Ronen,
VeritasDGC Inc., Houston, Texas
Seismic imaging in rough terrain is often a challenge. To evaluate the applicability of 3C point receiver MEMS in rough terrain we conducted a test over the Darby thrust fault in southwest Wyoming. The source was 5kg Pentolite at 18m hole depth, with 50m shot interval. The wavefield was recorded by both 12- element linear and 36-element areal geophone group arrays at 50m interval as well as by 3C sensors at 25m interval. The processing sequence included tomographic refraction statics, coherent and random noise attenuation, surface consistent deconvolution, two iterations of velocity analysis using the DSR equation and residual statics, and pre-stack migration. We applied polarization filters to the 3C data to separate signal and noise. No such polarization filtering is possible of course with any 1C data.
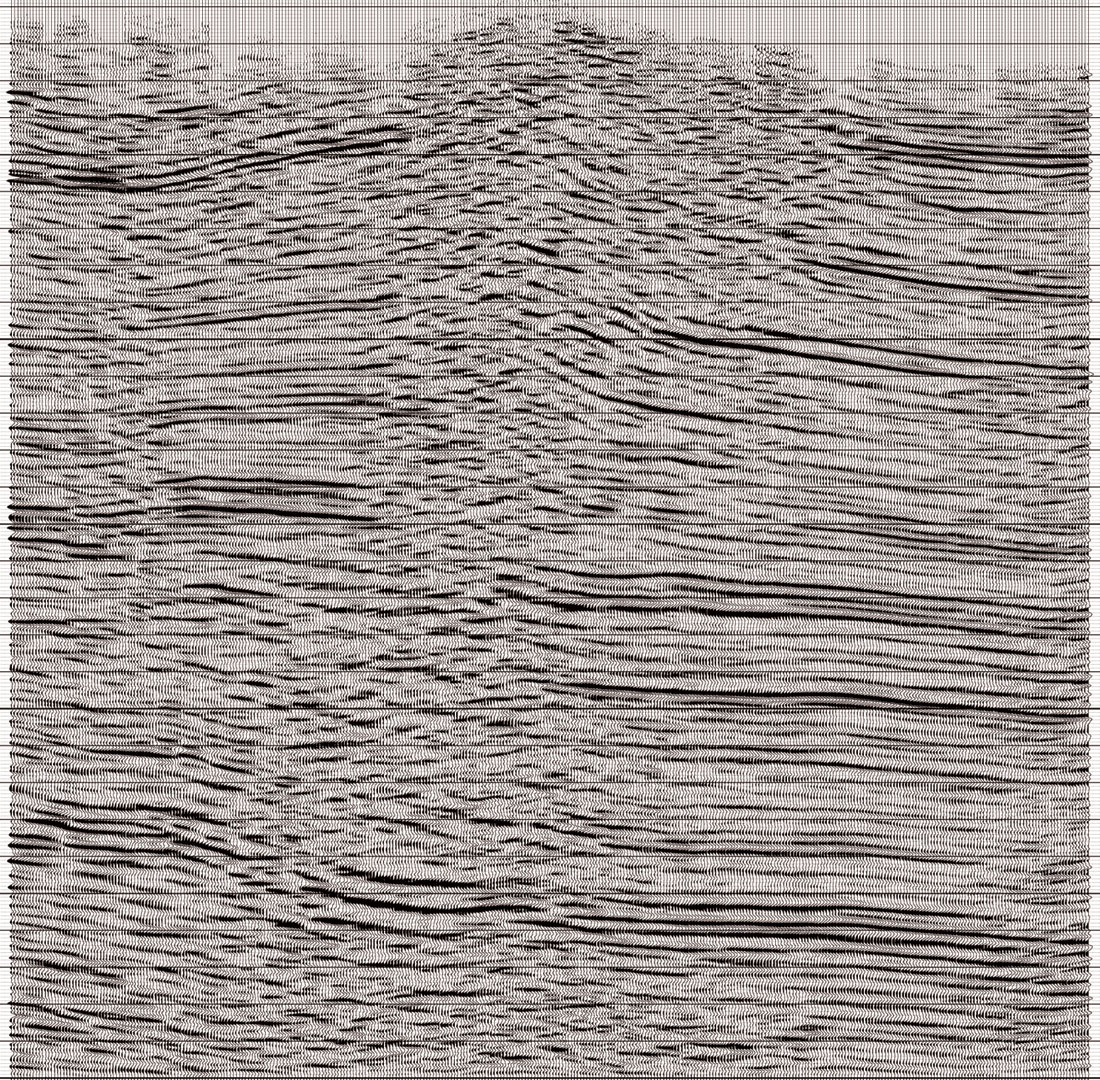
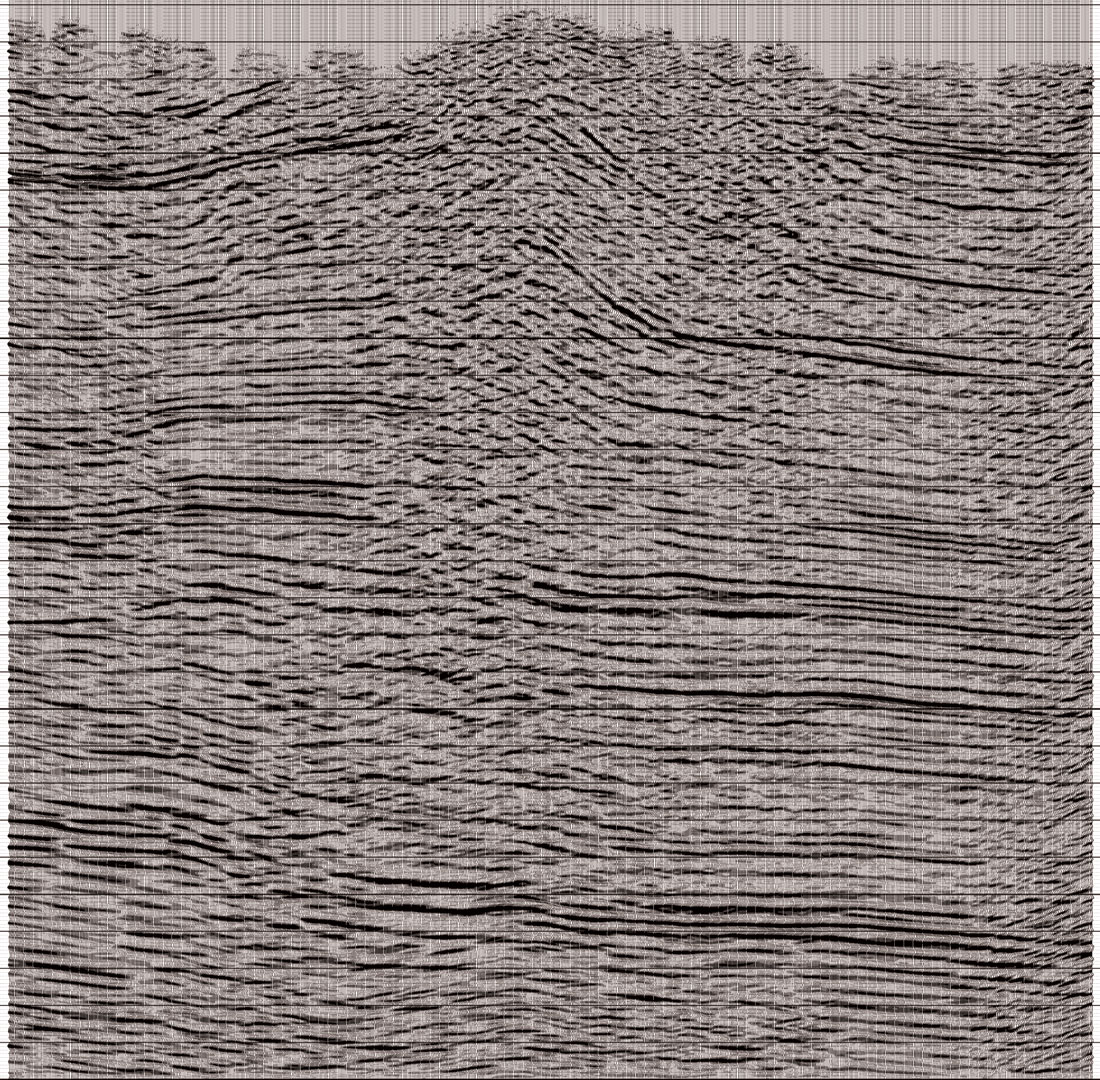
The test results (Figures 11 and 12) indicate that single sensor three component receivers provide better data than conventional groups of geophones in rough terrain. The images from the 3C data have better resolution and better imaging of dipping reflectors. Arguably, the benefits of the 3C data are much more significant than the small increase in random noise that we observe on the single sensor data. The benefits are due to a combination of factors: the smaller (25m) DSU receiver interval compared to the (50m) group interval, the polarization filters, the use of the DSR equation, the avoidance of intra-array statics with point receivers, the MEMS sensors, and the tilt correction. Our results are in general agreement with Behr (2005).
Acknowledgements
Thanks to Marvin Johnson and Vinny Buffenmeyer of ExxonMobil and Mark Wagaman for initiating, funding, designing, and supervising the data acquisition. Thanks to Chris Ansorger for processing the data.
References
Behr, J., 2005. Multicomponent Receivers for P-wave Seismic over Rough Topography: Motivation and Results. CSEG meeting.
Case Study 2: Heavy Oil
Paul Anderson, formerly VeritasDGC Inc.,
Robert Kendall, VeritasDGC Inc., Calgary, Canada
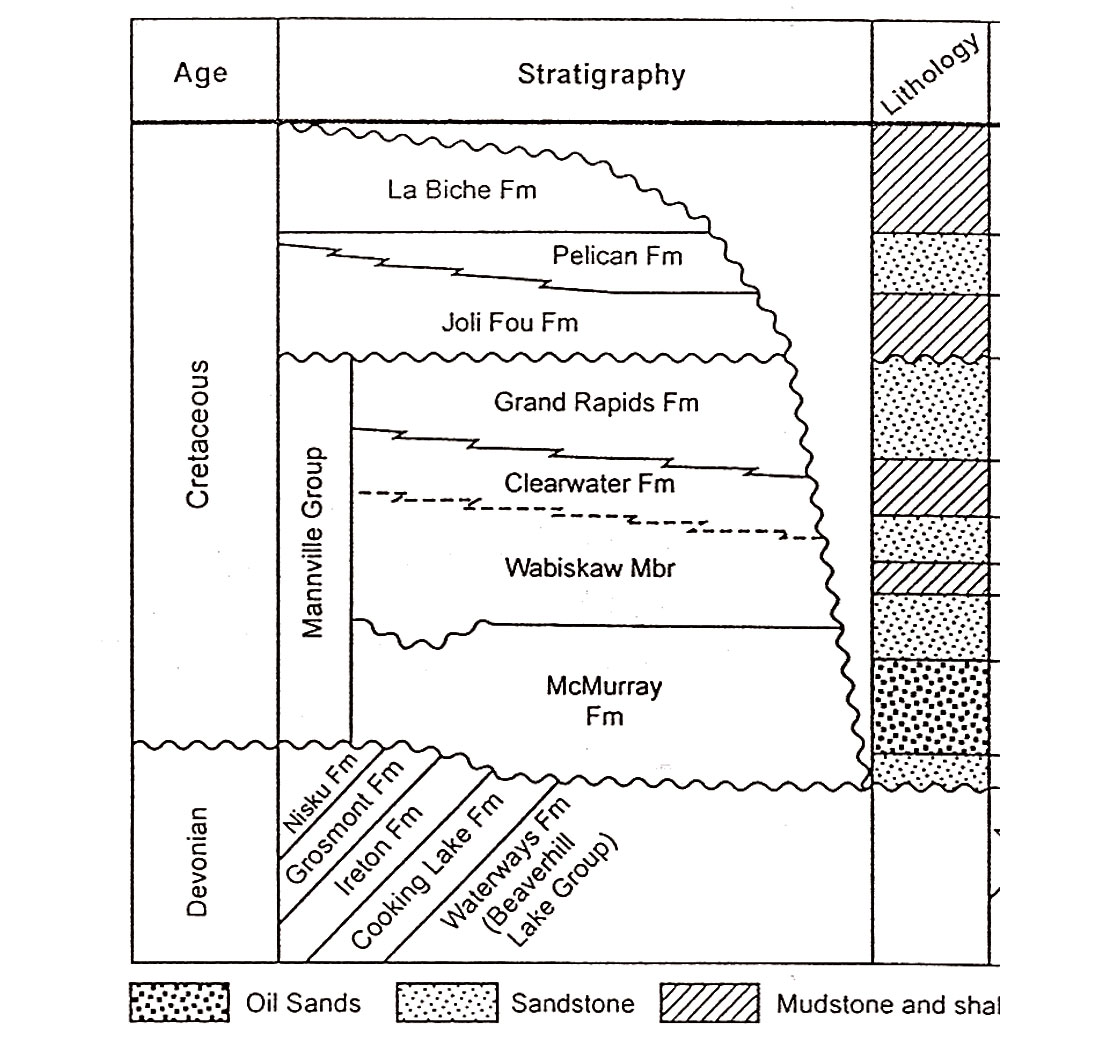
A multicomponent reservoir characterization workflow was developed on a heavy oil project from northeastern Alberta, Canada, with two primary goals. First, estimate key reservoir parameters, Density & Volume Shale (Vsh) to aid in placing SAGD well pairs optimally within the McMurray reservoir. Second, determine if the multicomponent data add value in describing the reservoir. The workflow used, described in Figure 14, describes a methodology for incorporating the additional data available with multicomponent seismic into a reservoir model to help in more economic well placement.
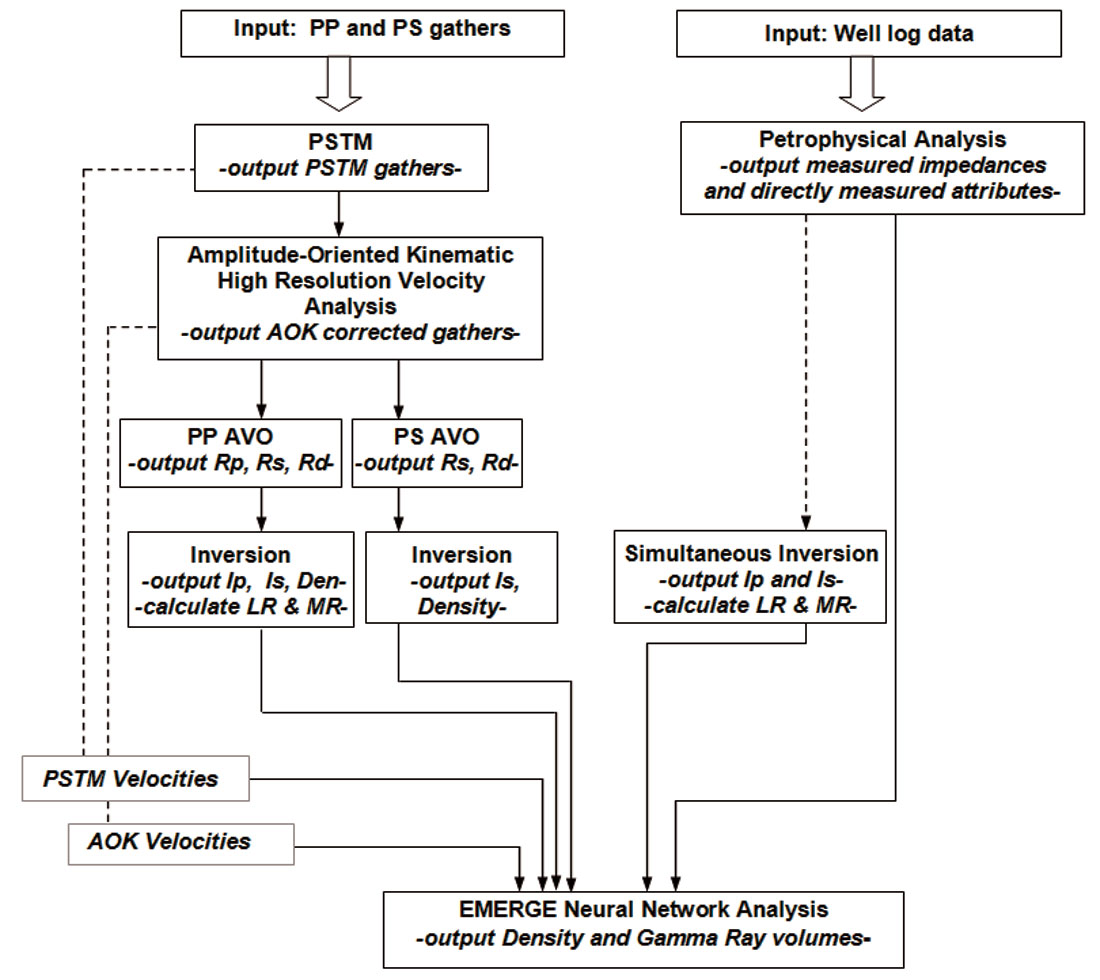
Initially, the seismic data were processed together, where velocities and statics are carried from the PP processing to the PS processing. At this point, we perform basic interpretation of the PP seismic data, correlating wells and picking key horizons. This then leads into the PS processing where dipole shear sonic logs (when available) are used to correlate the wells to the PS seismic and guide picking horizons on the PS data that are geologically consistent with the PP horizons. In this example, the horizons used included a Clearwater marker, the Top McMurray and the Devonian and resulted in a Vp/Vs ratio of approximately 3 within the McMurray interval. Three-term PP-AVO and two-term PS-AVO analyses were then performed using angles out to 50 degrees, using the background Vp/Vs from registration and velocities from well logs. These attributes were then inverted to impedance and then used for neural network analysis. Next, the attributes were combined in a multi-attribute analysis program (for example, VHR-EMERGE) to determine how attributes relate to Density and Vsh, and use those relationships to build the corresponding reservoir models. Remember, a key objective was to derive an estimate of Vsh. Five of the nine attributes used to calculate Vsh were derived from PS data!
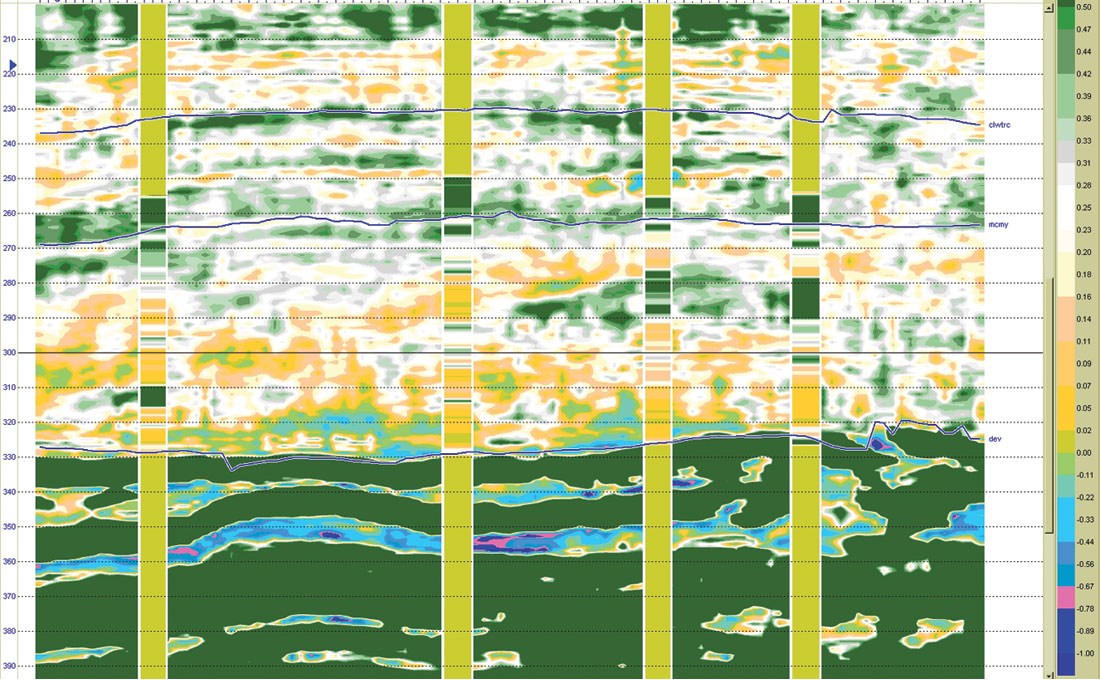
The cross section shown in Figure 15 shows the resulting Vsh-Model along with the shale content from log data. The wells show a good correlation to the shale content within the McMurray (log values not calculated outside the McMurray interval), including the rightmost well. This well, while excluded from the analysis, shows a good correlation to the shale-plug in the middle-to-upper McMurray.
References
Anderson, P., Gray, F.D., and Chabot, L.., 2005, A Proposed Workflow for Reservoir Characterization Using Multicomponent Seismic Data, 75th Ann. Internat. Mtg.: Soc. of Expl. Geophys.
Barson, D., Bachu, S., Essslinger, P., 2001, Flow systems in the Mannville Group in the east-central Athabasca area and implications for steam-assisted gravity drainage (SAGD) operations for in situ bitumen production, Bulletin of Canadian Petroleum Geology, 49, 3, 376-392
Hampson, D.P., Schuelke, J.S. and Quirein, J.A., 2001, Use of multiattribute transforms to predict log properties from seismic data: GEOPHYSICS, Soc. of Expl. Geophys., 66, 220-236.
Case Study 3: North Emerald 3C3D
Steve Roche,
VeritasDGC Inc., Houston, Texas
The following example (Figures 16 and 17) is from the Anadarko Basin in Oklahoma, a major gas production province with mature fields and on-going exploration efforts. In the survey area, thin sands (less than 8m each) produce natural gas from the Mississippian Springer Formation (approximately 70m thick), at depths near 3.2km. Production is primarily related to porosity development. Wells with 8-12% porosity are generally commercial. An embedded, static 3C patch was recorded concurrently within a P-wave survey. The source was 5 pound dynamite at 20m depth.
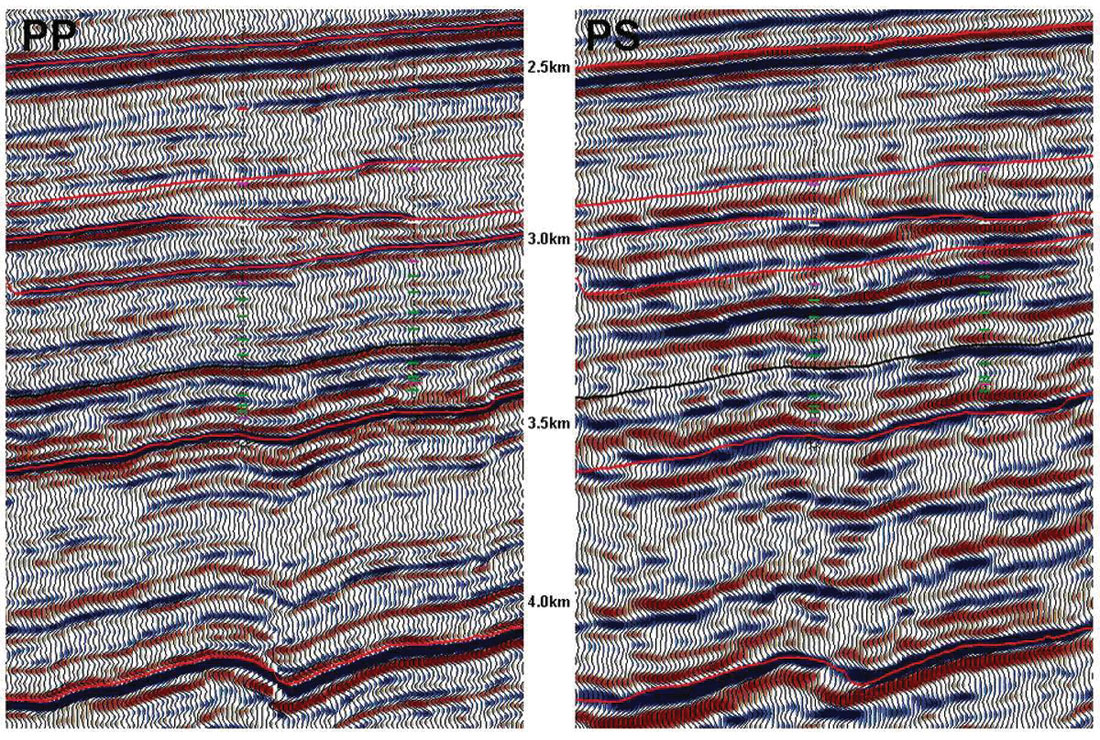
Figure 16 shows the P-wave (PP) data and converted-wave data (PS). The PS data is presented in PP time. Differing reflectivity indicates additional information is available when using both wave modes for interpretation. When we examine the Springer reservoir level, we observe changes in both P-wave (PP) and converted-wave (PS) reflectivity associated with gas production. We used a linear regression waveform classifier to quantitatively determine if using the PP and PS data together could provide a better empirical estimate of gas production than using PP data only. For seventeen wells in the 3C3D image area with Springer penetrations and tests, we created a simple log trace representing cumulative gas produced. Using cumulative gas as the target, a neural network was trained and an estimate of gas production using the seismic data was derived.
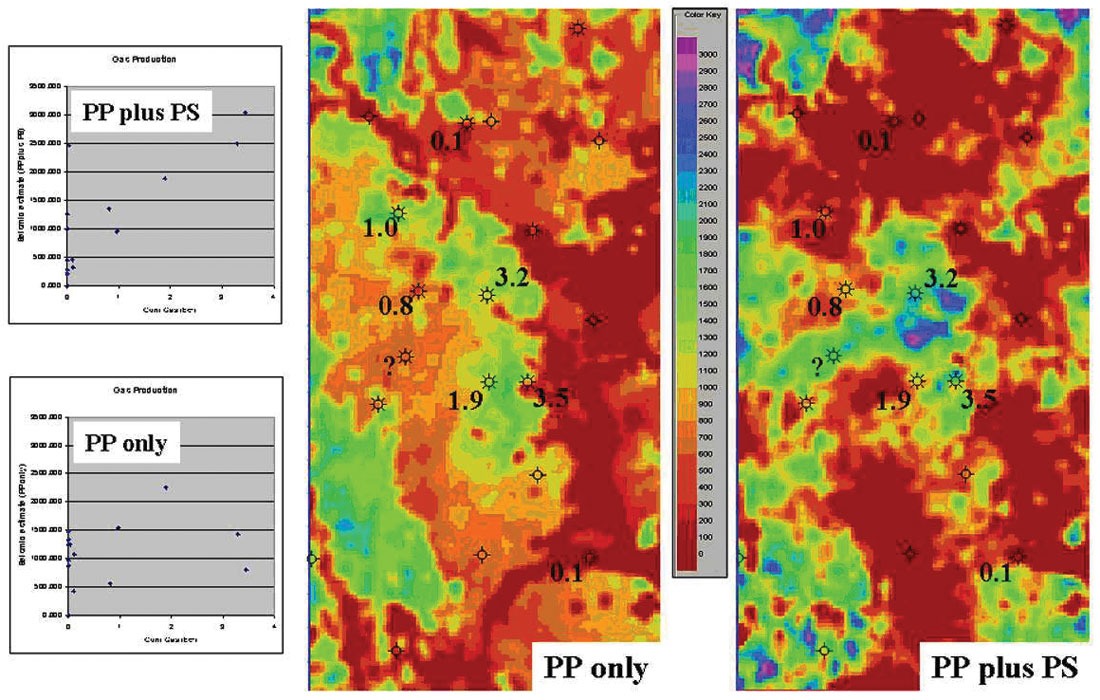
Figure 17 shows the empirical results for predicting cumulative gas production. Results using both PP and PS data correctly identified the three wells with higher cumulative gas produced. Crossplots of estimated gas versus actual gas production show that using PP and PS data together produced a more accurate linear fit than when using the conventional P-wave data alone.
Reference
"Anadarko Basin survey shows value of multicomponent acquisition", Steve Roche, Mark Wagaman, Howard Watt, First Break, volume 23, February 2005
Case Study 4: Carbonate Fracture Identification and Characterization: Onshore US
Bruce Mattocks,
VeritasDGC Inc., Houston, Texas
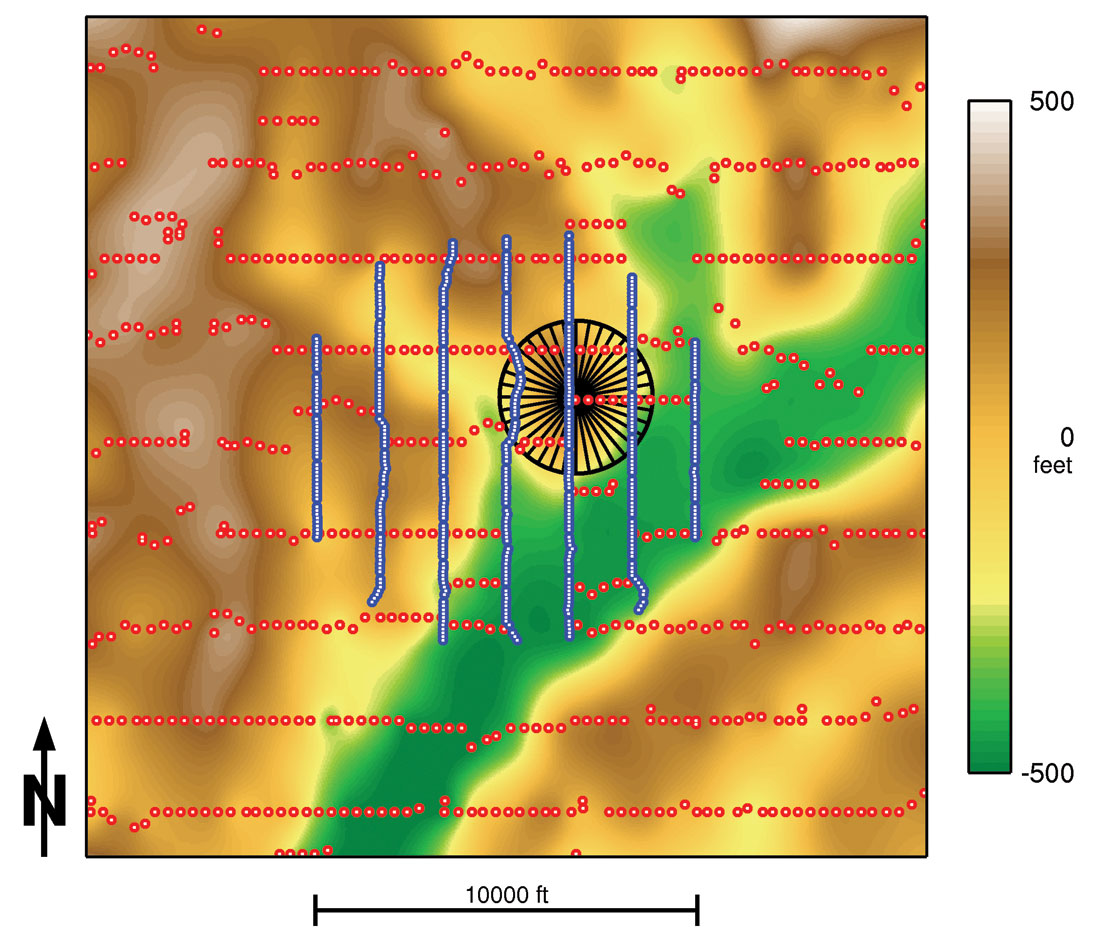
In this onshore US example, the initial objectives were to examine the essential feasibility of PS-wave imaging in middle Ordovician carbonates at a depth of 2800 m, and to verify the capacity of the PS-wave data to determine the orientation of maximum horizontal stress. To minimize the cost of this evaluation, the PS-wave acquisition was implemented as an embedded test (Figure 18), where three-component Sercel DSU-3 accelerometers are co-located with production single-component geophone groups over a subset of the survey. The resulting seven square kilometer PS-wave image is approximately centered on a recent well in which a dipole sonic was acquired.
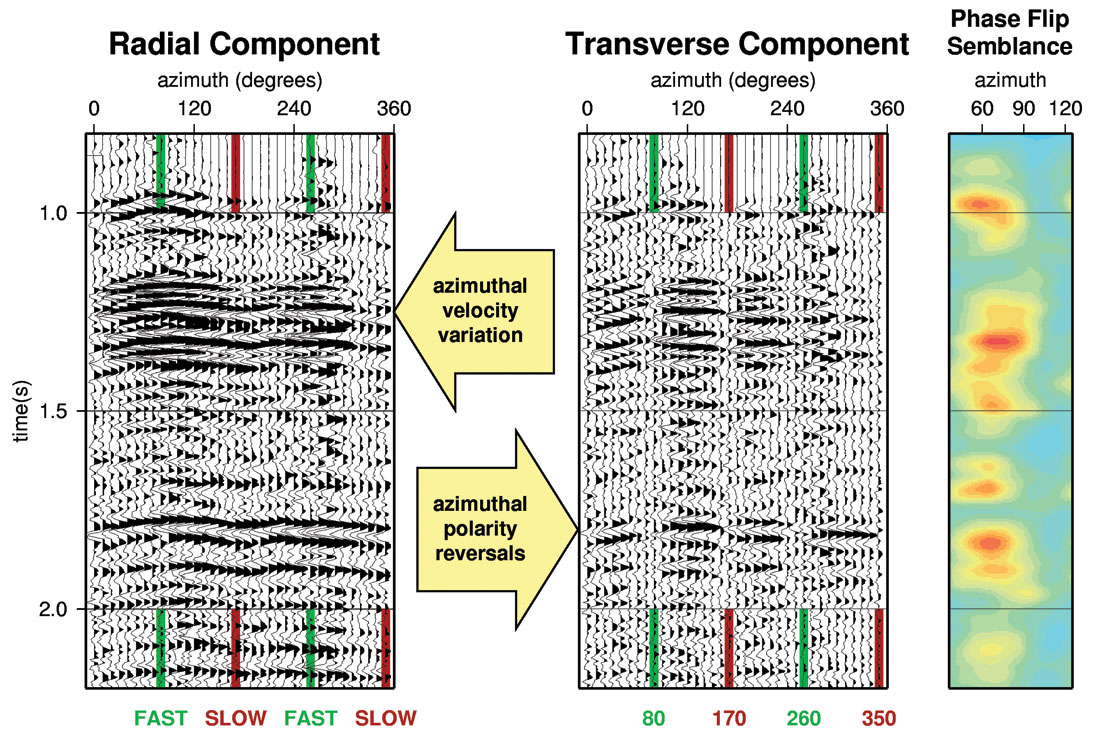
To permit evaluation of the azimuthal anisotropy, the PS-wave data are initially processed in a conventional isotropic manner, assuming neither azimuthal nor polar variation in any of the parameters. After correction for tilt and orientation, the receivers are rotated from the global acquisition coordinate system to a radial-tangential coordinate system, local to each shot. Source and receiver statics are surface-consistent, while deconvolution operators are designed independently on each trace. Asymptotic Conversion Point (ACP) binning is used to preserve surface-consistent relationships for iterative velocity analysis with residual statics. Following normal moveout correction, a large ACP superbin (600 m in radius) is selected and the binned data are sorted and substacked over ten-degree azimuth sectors.
The azimuth stacks of this embedded test display all the expected characteristics of azimuthally anisotropic PS-waves (Figure 19) as described by Li (1998). The radial component shows azimuthal variation in arrival times of the various reflections, with the fastest arrivals occurring approximately eastwest, and the slowest arrivals north-south. The transverse component – which would be free of reflections in isotropic media – shows polarity reversals separated by azimuths without reflections, at both N80°E and N170°E. The "phase flip" semblance display permits the orientation of the symmetry planes to be determined graphically; however, the 90-degree ambiguity remains. This is resolved through the azimuthally varying travel-time of the radial component, in which travel-time minima coincide with the fast-shear axis (or isotropy plane) and travel-time maxima coincide with the slow-shear axis (or symmetry-axis plane). In this case, the fast shear axis is N80°E, which represents the orientation of maximum horizontal stress.
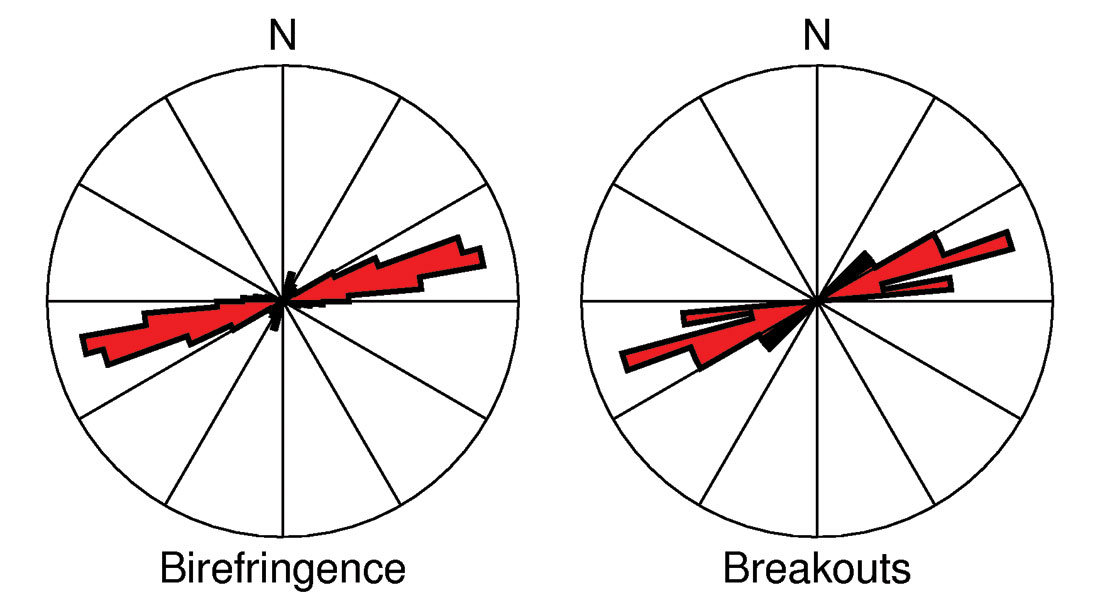
Using a smaller 800 ft bin diameter, the analysis is extended spatially and the anisotropy evaluated after rotating the data into the natural coordinate system; the results are summarized in Figure 20. These results represent the cumulative anisotropy above the reservoir. Nonetheless, the average orientation is consistent with the regional orientation of maximum horizontal stress from borehole breakouts.
References
Li, X. -Y., 1998, Fracture detection using P-P and P-S waves in multicomponent sea-floor data: 68th Ann. Internat. Mtg: Soc. of Expl. Geophys., 2056-2059.
Reinecker, J., Heidbach, 0., Tingay, M., Connolly, P., and Müller, B., 2004, The 2004 release of the World Stress Map (available online at www.world-stress-map.org).
Mattocks, B., Li, J., and Roche,S., 2005, Converted-wave azimuthal anisotropy in a carbonate foreland basin: 75th Ann. Internat. Mtg: Soc. of Expl. Geophys.
Conclusions
It is clear that recent advances in acquisition, processing and interpretation software are already making multicomponent data an increasingly valuable tool for today’s interpreter. Modern digital multicomponent sensors are providing accurate and affordable solutions for acquisition. Processing advances such as improved statics algorithms, more accurate binning and velocity analysis, polarization filtering, azimuthal anisotropy compensation and anisotropic prestack time migration are helping to improve the S/N, frequency content and overall quality of the data. Finally, recent advances in multicomponent interpretation and analysis are setting the stage for significant breakthroughs in multicomponent exploration technology and quickly repositioning multicomponent seismic from unmanageable to indispensable.


Join the Conversation
Interested in starting, or contributing to a conversation about an article or issue of the RECORDER? Join our CSEG LinkedIn Group.
Share This Article