Introduction
Acquisition footprint is a term used to define linear spatial grid patterns seen on 3D seismic time slices. These patterns tend to ‘mirror’ parts of the acquisition geometry used for acquiring the seismic survey. They may be seen usually on shallow time slices or horizon amplitude maps as striations masking the actual amplitude anomalies under consideration for stratigraphic interpretation, AVO analysis and reservoir attribute studies [Marfurt et al, 1995, 1998].
Acquisition footprints may be present due to various reasons, but two general types of footprint could be distinguished. One type may be categorized as depending on the details of the acquisition geometry, and the other type as those arising from signal processing problems [Drummond et al. 2000].
- The choice of any acquisition design is characterized by a particular distribution of fold, offset and azimuth. Apart from some variation in the taper zone, the fold for most common geometries is uniform for all seismic bins. However, the offset and azimuth distribution can vary from bin to bin or can be uniform in the inline direction and irregular in the cross-line direction. Such variations can lead to undesirable effects on the reflected signal. Deviations from regular geometry pattern, like inaccessible patches or pockets within a 3D survey that are under human habitation or the location of a power station and so cannot be shot, could be responsible for such a variation. Also, azimuthally biased receiver array responses suppressing inline noise but passing cross-line noise and malfunctioning of the recording system could be some other examples. Cable feathering resulting from strong water currents and undershooting of obstructed areas could be cited as examples for the marine environment.
- Very often economic considerations compel coarse sampling in 3D data acquisition. Sparse recording of data causes artifacts during its processing. Coarse spatial sampling leads to aliasing and aliased steeply dipping noise resulting from ground roll or multiples for example would create artifacts. Aliased noise leaks into the stack volumes as spatially periodic events, which on getting accentuated during processing show up as footprints. Other processes that tend to accentuate footprints are residual NMO caused with incorrect velocities, systematic errors in computed offsets or amplitude variations caused by inadequate 3D DMO formulation [Walker et al 1995, Budd et al 1995], 3D prestack migration, signal enhancements based on fxy random noise attenuation and coherency filtering [Moldoveanu et al 1999].
An acquisition footprint, whether the result of acquisition design or accentuation during processing, is a nuisance for the interpreter. Efforts are sometimes made to prevent accentuation of the footprint during processing. This is usually done by adopting interpolation or extrapolation on input volumes (to get over the ‘sparseness’) before applying multichannel processes. If this does not help then trace mixing is resorted to which tends to minimize the effect, at the risk of lowering the resolution. Wavenumber domain filtering has also been suggested [Gulunay, 1999]. Sometimes, none of these approaches look effective, and the interpreter is expected to proceed with his analysis of the seismic data leading to not-so-confident recommendations for drilling locations.
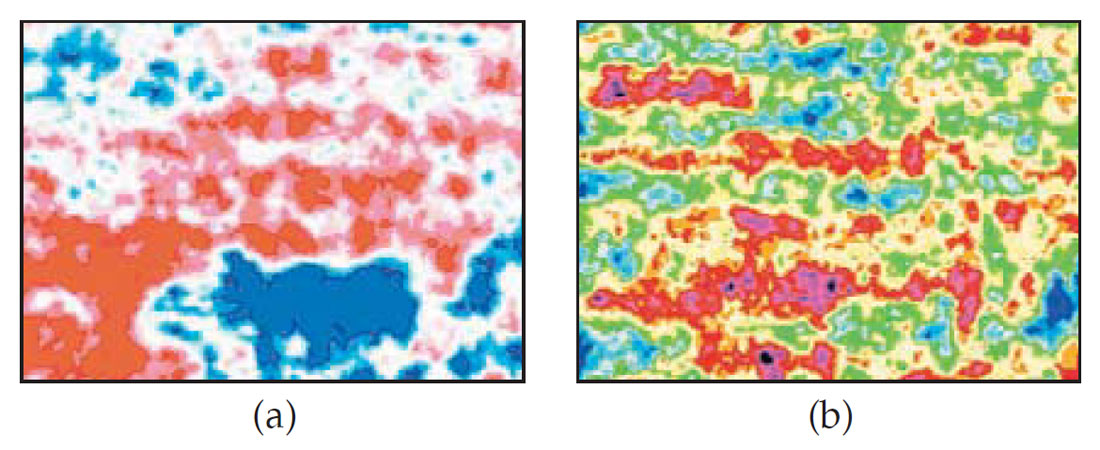
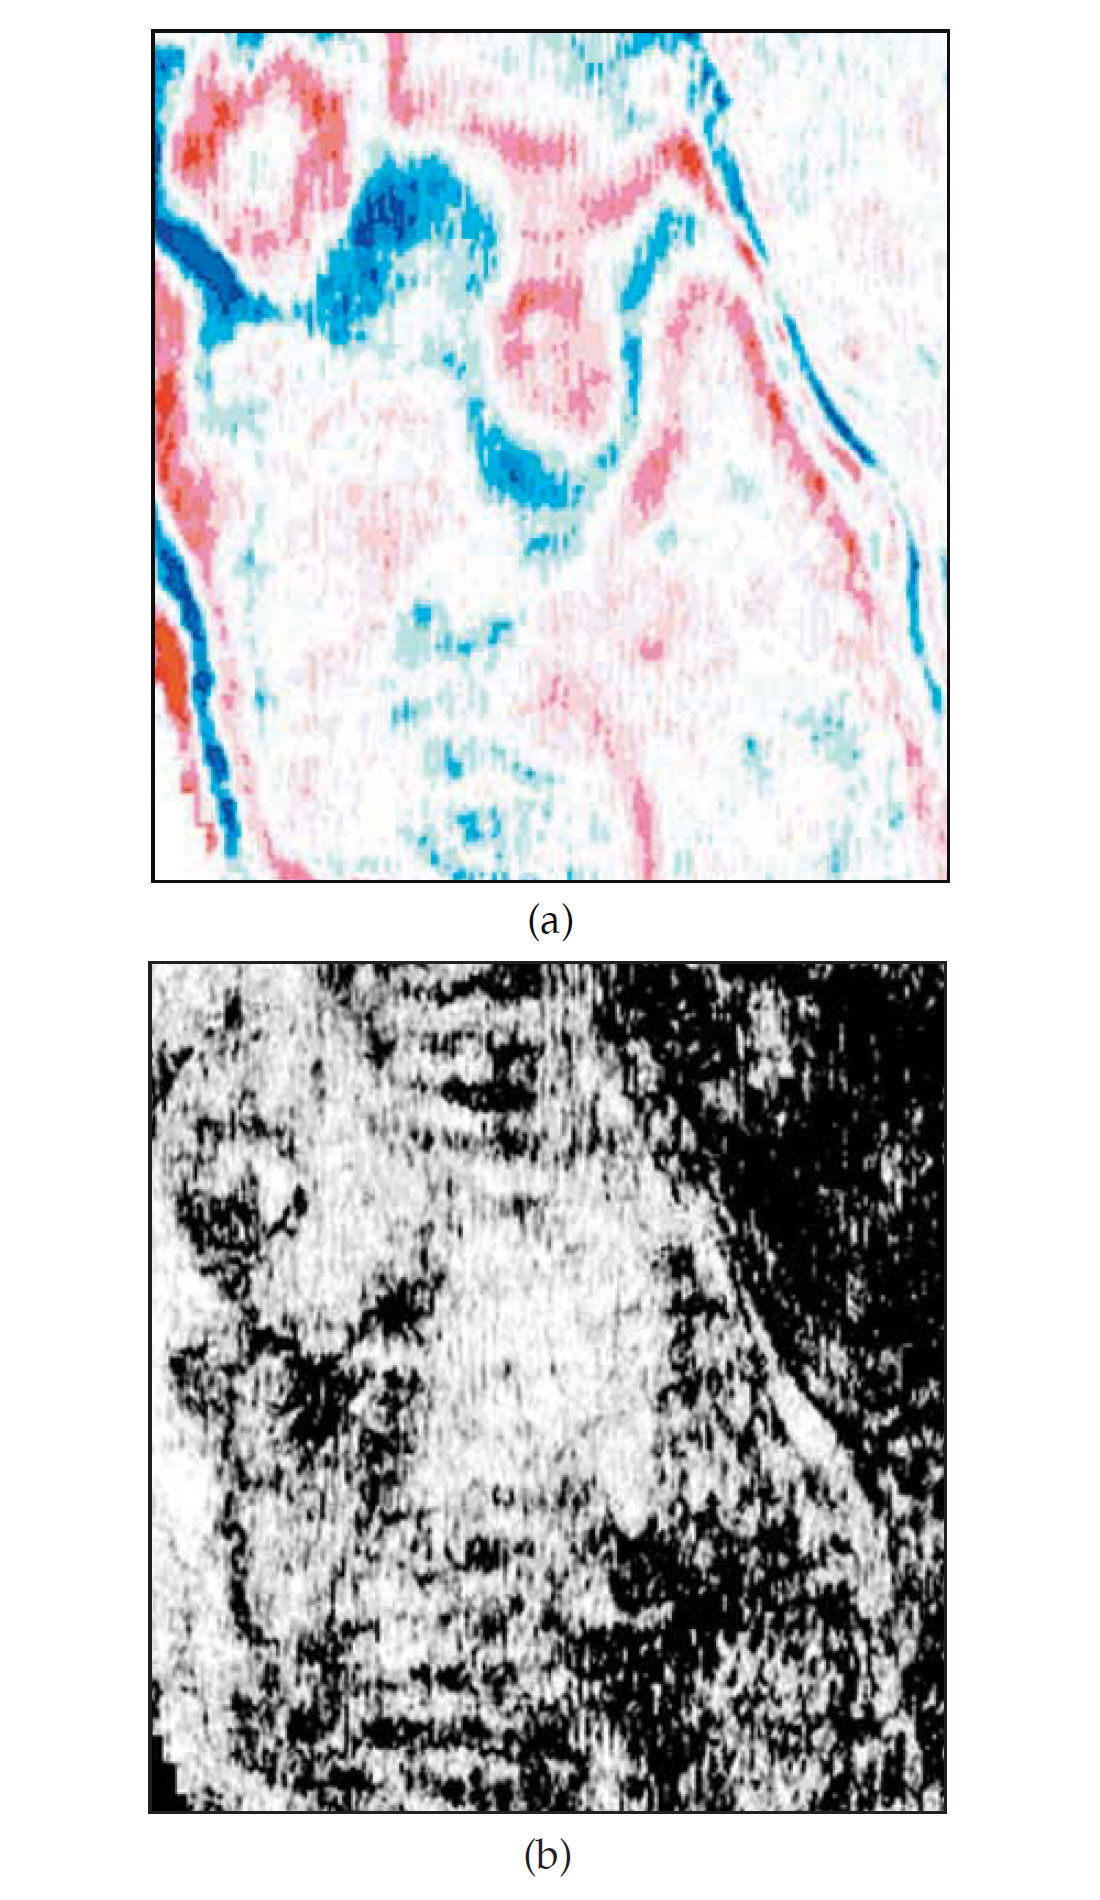
As the interpreter begins interpretation work on such a volume, the derived attribute volumes all carry the acquisition imprint with the amplitude fidelity in question. Fig. 1(a) shows an example of a time slice from a seismic volume riddled with footprint (E-W direction). The time slice from the derived impedance volume also exhibits a similar pattern (Fig. 1(b)). Any amplitude analysis on the impedance volume would entail a high measure of uncertainty. A significant problem arises when the acquisition footprint is not so prominent on the seismic data but a pronounced ‘grid’ pattern can still be seen on the impedance slices. In such cases attempts at removal of the footprint do not prove so effective. Fig. 2 depicts a time slice from the seismic volume. The vertical lineation on the slice is a processing artifact which has trickled through the processing sequence. The E-W lineation corresponding to the receiver lines is not seen so clearly. The derived impedance slices exhibited distinct undesirable stripe patterns in the two orthogonal directions and prevented any meaningful analysis.
Using Coherence Cube™ as an effective footprint detector
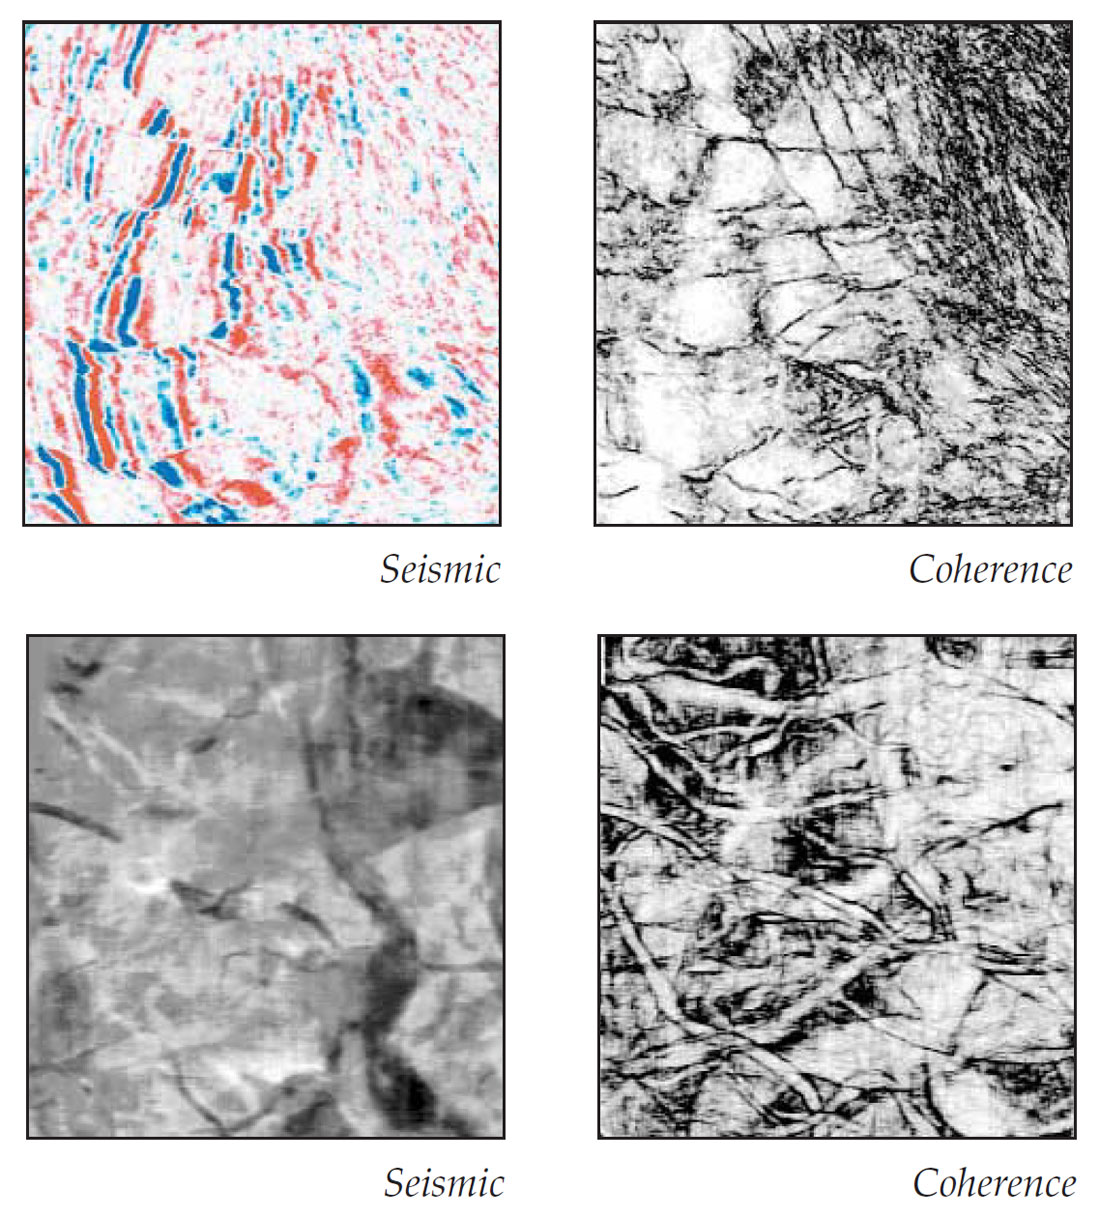
Over the last five years Coherence Cube technology has been applied extensively to seismic interpretation and has led to notable exploration and development success. It essentially consists in generating a cube of coherence coefficients (from the input 3D seismic data volume) using an algorithm [Marfurt, K.J. et al 1999] that measures local waveform similarity within a 3D aperture set from data points in the inline, cross-line and time directions. Similar traces are mapped with high coherence and discontinuities have low coefficients. The Coherence Cube thus portrays faults and other stratigraphic anomalies clearly on time and horizon slices and that too without interpretation bias. The remarkable amount of detail that Coherence Cube extracts from the seismic volume can be gauged from the following examples (Fig. 3), that exhibit a comparison of the seismic and coherence slices. Evidently, coherence slices make complex fault/fracture structures or other subsurface features (like nested system of channels shown) appear as obvious in their entirety. Due to this sensitivity-to-detail feature of Coherence Cube, it was considered a suitable tool for detecting footprints during the processing flow and then deciding on the most accurate way they can be attenuated.
Methodology for removal of footprint
An effective methodology has been developed for the detection and removal of acquisition footprints. The given volume is sliced through every sample and typical slices are examined in the f-k domain for the linear patterns they exhibit corresponding to the footprint lineations. Thereafter, a very narrow f-k filter is designed at the level where the footprint is most pronounced. The sampled slices are f-k filtered to eliminate the linear patterns in one direction first and then in the orthogonal direction. The filtered individual slices are then recombined into a composite seismic volume.
Fig. 4 shows the same slices (seismic as well as coherence) as in Fig. 2 after footprint removal. The coherence slice confirms that the seismic volume is clear of any lineation whatsoever, representing a significant improvement in data quality that could lead to a more confident interpretation. The derived attribute volumes also did not show any undesirable patterns.
It is important to ensure that no geologic reflection events are removed from the data during f-k filtering. An effective quality check involves the creation of a Coherence Cube from the difference volume (original volume minus the f-k filtered volume) and examining the individual slices.
Conclusions
An effective methodology has been developed for the removal of acquisition footprints from seismic data. It involves a two-pass f-k filtering of individual time slices from the seismic data volume and recombining them into a composite volume. Coherence Cube is a vital tool for an effective implementation of this methodology.
The application of this methodology improves the quality of stratigraphic mapping, attribute analysis and inversion results.


Join the Conversation
Interested in starting, or contributing to a conversation about an article or issue of the RECORDER? Join our CSEG LinkedIn Group.
Share This Article