Author’s Update:
This article was originally written in August 2016 and the trends mentioned within this document have continued over the past 5 years. For example:
- Solar panel module prices continued to drop from $0.57/Watt in 2016 to $0.32 in 20201
- In 2016, the cost of utility scale solar was $1.47/Wattdc, fell to $1.06 by 20182 and 70 cents/Wdc in 20203
- Installed solar capacity increased from 306 GW in 2016 to 627 GW in 20194
- In 2016, a 2 acre well lease could host 300 kW of solar generation capacity and a Tesla could travel about 160 km on a charge5
- In 2020, due to increases in solar panel efficiency and more innovations at Tesla, a standard lease can host 750 kW of solar generation capacity and you can drive over 600 km on a single charge6
- Several major oil companies, like Shell, Total, BP and Equinor have made significant investments in renewable energy portfolios7
“It was the best of times; it was the worst of times…”
Can’t think of a better way to start a conversation about today’s energy industries than to borrow this famous phrase from Charles Dickens.
It was the Worst of Times…
First, let us look at the graph on the left which represents the oil and gas industry. The green line, showing annual production of crude oil from 1985 to 2015, increases steadily at an average rate of about 270 Million barrels/year.
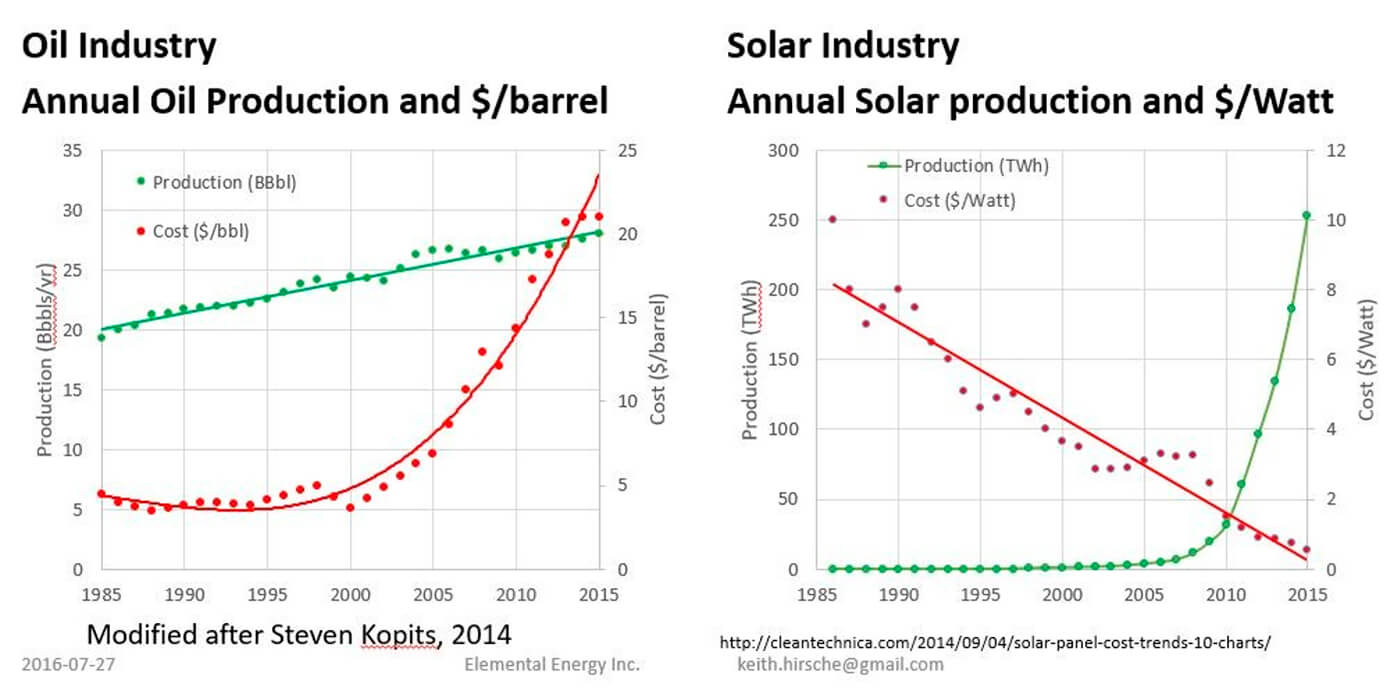
The red line, representing non-OPEC production costs over the same period, tells a more complicated story. From 1985 to 2002, the cost of producing a barrel of oil remained virtually constant at an average of about $4.00/barrel. In 2003, the average cost rose to almost $6/barrel. From 2005 to 2015, production costs rapidly increased from $6.90 to $21.00 per barrel – an overall increase of about 235% over 10 years.
Oil prices over the same period have followed a vastly different trend…
It was the Best of Times…
Now let us look at the solar PhotoVoltaic (PV) industry. The green line, representing the annual production of electricity in TerraWatt hours, remains below 5 TWh for the first twenty years. Starting in 2005, the solar PV industry enters a period of exponential growth. Over the past three years, the annual solar power generation has increased at an average rate exceeding 30% per year.
By contrast, the red line showing the cost of solar panels (in dollars per Watt) drops steadily at an average rate of about 10% per year over this same period.
So, what does this mean?
For those of us in the oil and gas industry, oil continues to be the world’s dominant energy source and in 2015 it provided about 1/3 of all global energy needs. Including the contribution of natural gas (21%) and coal (29%), fossil fuels generated over 80% of the world’s energy requirements in 2015. This is not likely to change in the near future.
Over the decade from 2004 to 2014, our industry increased oil production rates from 26.6 to 27.6 Billion barrels/year to meet increasing demand. Unfortunately, these production increases came at a high cost. According to an analysis by Steven Kopits of Douglas-Westwood8, the industry spent more than $4 Trillion from December 2005 to December 2013. More importantly, 93% (about 230 Billion barrels) of the total crude production came from legacy conventional fields at a cost of $2.5 Trillion for an average cost of $10.80/barrel. The remaining 18 Billion barrels came at a cost of more than $85.00/barrel9. This higher production cost is causally related to the transition from conventional oil reservoirs to unconventional reserves contained in tight shale and oilsand deposits.
This statement is supported by the rapid growth in production that occurred in the Canadian oilsands and the US oil shale deposits during this period. From 2004 to 2104, oil sands production increased from about 1 to more than 2.3 MBOPD and US shale oil production went from about 0.3 to over 5 MBOPD. In 2015, oil produced from these high-cost unconventional oilfields represented almost 10% of global crude oil production.
In contrast, solar panel costs have decreased from $2.90/Watt to $0.57/Watt - dropping more than 80%- over this time period10. These cost savings created the environment for exponential growth in the construction of utility-scale solar power stations. In turn, the electricity generated by these solar power stations has increased from 3.7 TWh/year in 2005 to 253 TWh/year in 2015 (more than 6700% growth in power generation) 11.
To put this in context, 253 TWh/year from solar is approximately equivalent to 400 thousand barrels per day and accounts for about 0.5% of the total energy provided by oil production in the same year.
This is greater than the contribution that US shale oil production made to the global energy market in 2004. Despite considerable risk and exceedingly high costs, US shale oil attracted massive levels of investment which enabled production to grow at a rate of 30% per year until it reached roughly 6% of global crude production in 2014. While this is certainly impressive, the growth in solar power generation has consistently exceeded 40% per year from 2004 to 201512. Unlike the oil and gas industry, which contends with geologic variation and the fact that the most favourable areas are usually developed first13, the experience gained in each new solar installation results directly in cost savings for the next installation. With similar levels of investment, there is little doubt that solar growth will continue at a rate that exceeds the growth that occurred for US oil shale production14.
This leads us back to our original story…
Charles Dickens wrote his “Tale of Two Cities” at a time of disruptive industrial and social change. The lives of working-class people in both Paris and London were completely unsustainable and conditions had reached a breaking point.
Change was inevitable.
The French aristocracy refused to recognize the facts and they resisted until the situation erupted in a violent revolution. Dicken’s cautionary tale gently encouraged England’s ruling class to accept the reality of the situation and lead their society in a gradual transition towards a more just and sustainable future.
For more than a decade, oil and gas companies have been re-branding themselves as “Energy Companies”. Bringing solar power generation into the mainstream production portfolio would combine the resources, project management ability and proven track record of the oil industry with the solar industry’s technical and manufacturing breakthroughs.
This would create a new story – The Tale of The Energy Industry.

Acknowledgements
1 https://www.pv-magazine.com/module-price-index/
2 https://www.nrel.gov/docs/fy19osti/72399.pdf
5 https://www.skyfireenergy.com/pv-vs-oil-what-drives-you-further/
10 http://cleantechnica.com/2014/09/04/solar-panel-cost-trends-10-charts/
11 https://en.wikipedia.org/wiki/Solar_power
12 https://en.wikipedia.org/wiki/Solar_power
13 https://www.artberman.com/2015/11/03/only-1-of-the-bakken-play-breaks-even-at-current-oil-prices/


Join the Conversation
Interested in starting, or contributing to a conversation about an article or issue of the RECORDER? Join our CSEG LinkedIn Group.
Share This Article