Abstract
Buried glacial channels in the surficial sediments of northern Alberta and British Columbia have been the focus of several industry and academic research groups in the last 5 years. Individual channels can be over 50 km long, two to five km wide, and have been incised up to 300 m into the underlying Cretaceous bedrock. Oil and gas exploration companies are interested in the distribution of the channels because the sands and gravels can contain economic quantities of natural gas. The sands, although shallow, can be over-pressured, posing a risk of blow-outs when drilling for deeper targets. The reservoir is typically a heterogeneous mixture of sand and gravel with 20–30% porosity, and 0.1–10 Darcy permeability. To date over 600 million cubic metres (21 Bcf) of gas have been produced from 25 – 30 wells targeting channels that are close enough to existing production facilities to make them economical to exploit. Many more channels exist, and the ability of geophysics to identify prospective channels is improving. Using a combination of well logs, seismic reflection and refraction data, ground resistivity, and airborne electromagnetics, four distinct “geophysical facies” have been described, and are used to aid the continued exploration for gas.
Introduction
Quaternary glacial channels are major geomorphological features across northern Alberta and northeastern British Columbia (Fenton and Pawlowicz, 2000). Similar channels exist across North America and Eurasia resulting from the last major glaciation (16 – 8 Kyr BP). These channels have been extensively studied in many places as they form major aquifers and sources of granular material (Andriashek and Fenton, 1989; Pugin et al., 1999). Older examples of similar channels and tunnel valleys are productive oil and gas reservoirs through-out North Africa and the Middle East (Ghienne and Deynoux, 1998; Smart, 2000). These partially preserved channels are late Ordovician in age and are evidence for a major glaciation across the super-continent of Gondwana.
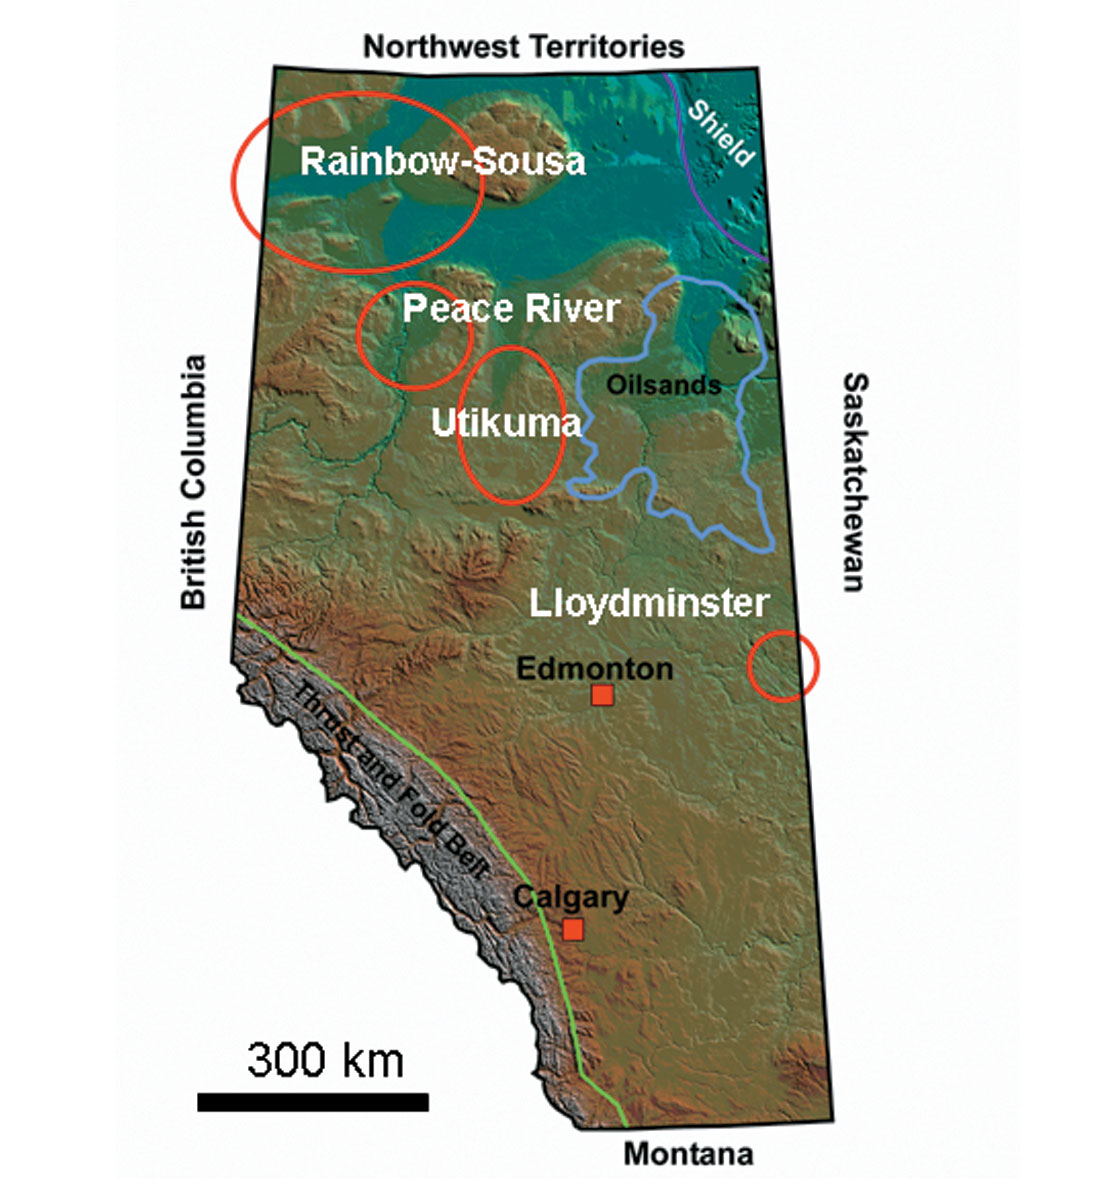
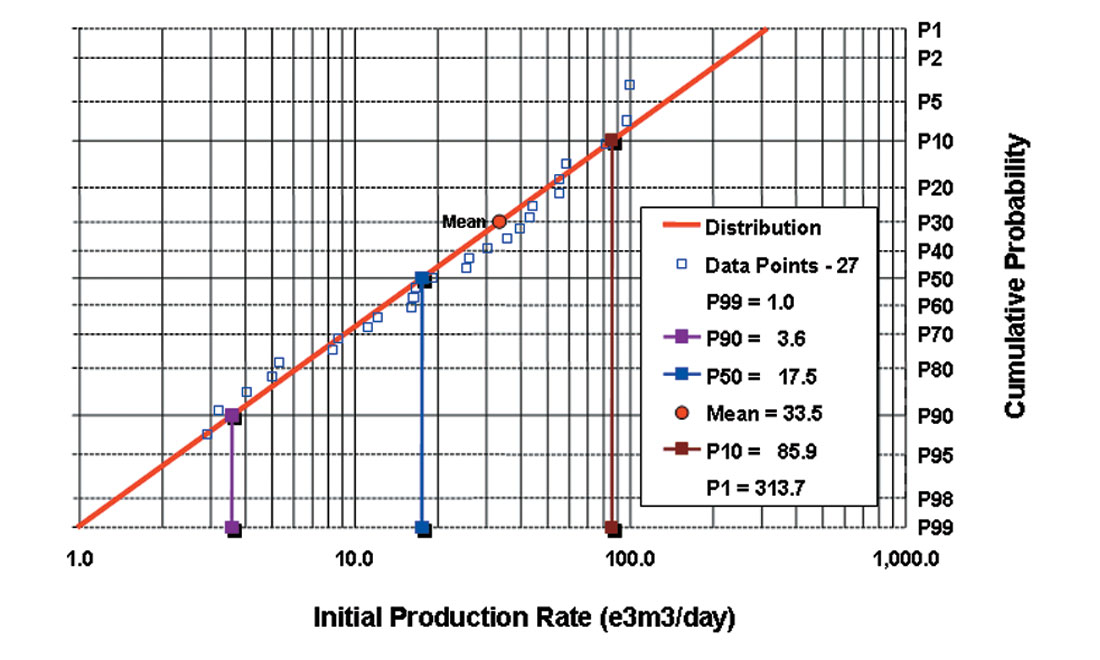
In Alberta the main areas of exploration for gas charged Quaternary channels are Rainbow-Sousa, Peace River Valley, Utikuma, and Lloydminster (Figure 1). On the positive side, the driving economic factors include shallow and relatively cheap drilling (< 200 m depth and < $250,000 drilling and completion costs), and large gas drainage areas due to high permeability and porosity. On the negative side, the reservoirs are low pressure (< 300 kPa), they can decline rapidly, and the formation is sensitive to drilling induced damage. Figure 2 shows a field-size distribution for the play, based on a small sample of 27 wells. The mean initial production for the distribution is 33.5 e3m3/day (1.2 mmcf/day) making the play economical provided the wells are close to existing infrastructure. To date four fields have been developed with a cumulative production of 612 e6m3 (21.5 Bcf). A drilling success of 33% is calculated using productive wells versus all wells that were only drilled to the base of the Quaternary drift. This sobering success rate emphasizes the major risks of poorly defined trap and seal, drilling induced formation damage, and poor completion strategies.
The aim of this paper is to provide an overview of the geological concepts of the play, provide insight into the geophysical techniques needed to reduce the risk of drilling dry holes, and present a more generic facies model for the Quaternary channels based on seismic and non-seismic geophysical data. This facies model can be applied to the deeper Ordovician channels in North Africa.
Geological Concepts
The existence of the Quaternary gas reservoirs has been known since the mid 1980’s when several channels were drilled by chance and drilling crews encountered blow-outs. The mapping of Quaternary channels was mostly done by surficial geologists and hydrogeologists interested in the paleo-drainage patterns of the large ice-margin lakes (Smith and Fischer, 1993), and the major aquifers (Parks et al., 2005). Many channels were mapped and most channels were assumed to be between 50 m and 100 m deep, cutting into Cretaceous shales. More recent work has identified channels that cut as deep as 300 m into the Cretaceous and Devonian and intersect gas bearing formations such as the Dunvegan, the Bluesky, and the Wabamun (Pawlowicz et al., 2005). Figure 3 is a schematic model for the channels illustrating the final stage of seal formation by tight lacustrine clays originating from the ice-margin lakes. The figure also illustrates current exploration ideas about the relationship between Cretaceous gas fields and the Quaternary reservoirs. The most likely source for the Quaternary gas is migration of thermogenic gas from the breached Cretaceous and Devonian reservoirs.
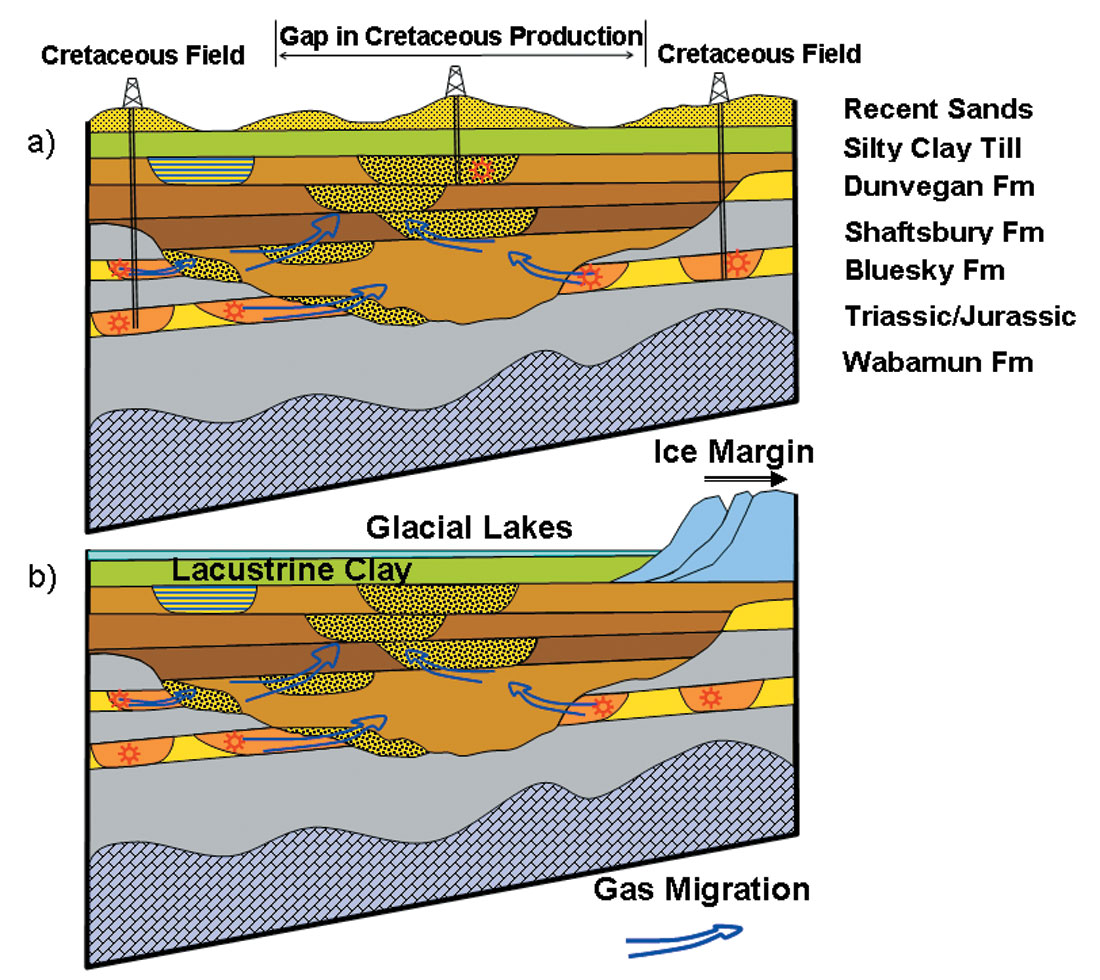
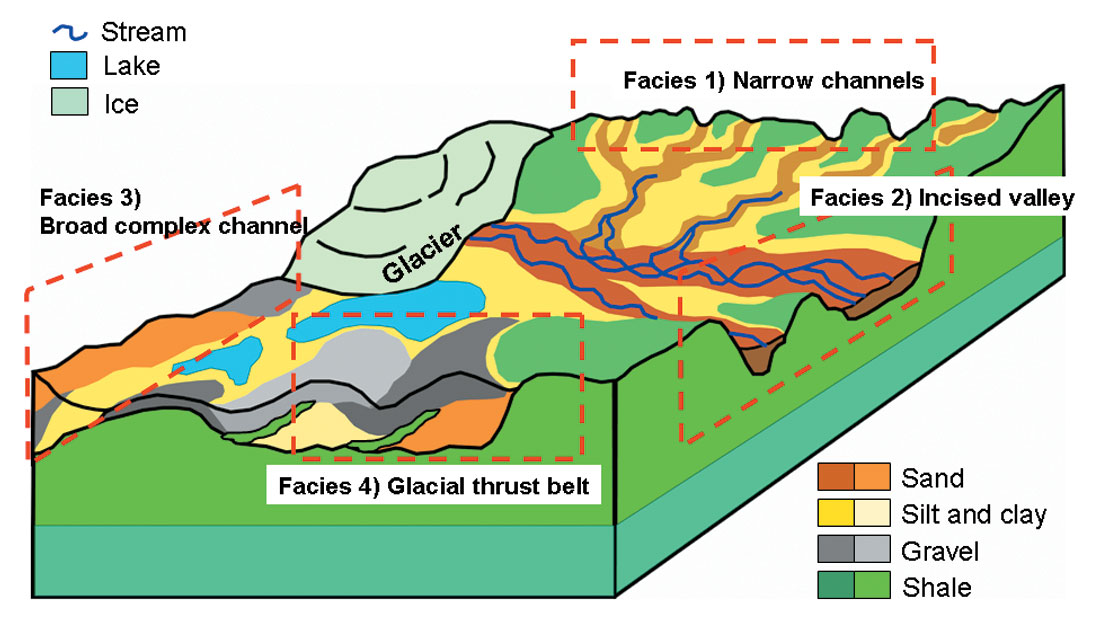
Figure 4 illustrates the four facies that are best preserved in the Quaternary channels in northern Alberta. Facies 1 comprises the narrow, highly sinuous, thin channels that form on the flanks of the main incised valley systems. They may be oriented parallel to the ice fronts or drain perpendicular to the margin (Bennett and Glasser, 1996). Facies 2 is the deeply incised valley that may have had a Tertiary fluvial pre-cursor. The thalweg of the channel contains coarse-grained sands and gravels. Facies 3 is a reworked extension of the incised valley where multiple advances and retreats of the ice-front, and changes to the drainage system, have produced a mélange of sands, gravels, and finer grained sediments. Facies 4 is the glacial thrust belt, caused by advancing glaciers freezing Quaternary, Tertiary, and Cretaceous sediments to their base and pushing them up into steeply dipping thrust sheets. The surface expression of these thrust belts is ice-thrust ridges and hill-hole pairs (Andriashek et al., 1999; Bluemle and Clayton, 1984).
Understanding the distribution of these facies in the sub-surface is complicated by an absence of out-crop and a lack of well control. Most oil and gas exploration wells are cased over the interval of interest, and open-hole geophysical logs are rarely collected. Geological samples are restricted to research wells drilled for Quaternary studies or groundwater investigations.
Geophysical Interpretations
The ability to image the Quaternary channels with conventional seismic reflection surveys is complicated by the shallow depth of the target and the complex velocity structure (Ahmad and Schmitt, 2005). The largest volume of seismic data available in the areas of Quaternary exploration dates from the 1980’s and reprocessing these data with careful attention to statics and near-surface velocity analysis has produced an improved image of the channels. The big advance in geophysical imaging of the channels has come with the application of ground resistivity and airborne magnetics and electromagnetics (Bauman, 2005; Davies et al 2004; Napier et al., 2005). These methods have been adapted from the mining and environmental industries to be cost-effective in the gas exploration business.
Rock Properties
The key to any geophysical interpretation is to understand the physical properties of the rocks and to identify a physical property contrast (vertical or lateral) that can be mapped using geophysics. The geophysical logs from well 16-17-83-5W5 (Utikuma), and 9-29-112-23W5 (Sousa) are shown in Figures 5a and 5b respectively. The gas bearing unconsolidated sands are characterized by the following log responses:
- Poor hole conditions on the caliper log.
- Low gamma indicating clean sands and gravels.
- Low bulk density.
- Low acoustic velocity on the sonic log.
- High resistivity on the induction log.
- Strong to weak gas effect in the neutron and density porosity logs.
Detailed petrophysical analysis of the logs is complicated by the unconsolidated nature of the sediments, and the poor hole conditions over the reservoir. Generating a synthetic seismogram from the sonic and density logs (individually or combined) shows the possibility of getting a strong positive reflection from the base of the sands. The strong negative amplitude corresponding to the low velocity and low density gas saturated reservoir may be resolvable, depending on the sand thickness and the frequency of the seismic. The base of the Quaternary sequence is marked by another strong peak as both density and velocity increase at the contact with the consolidated Cretaceous sediments. The seismic must be collected with small group spacing, and small enough off-sets to get sufficient fold and high frequencies.
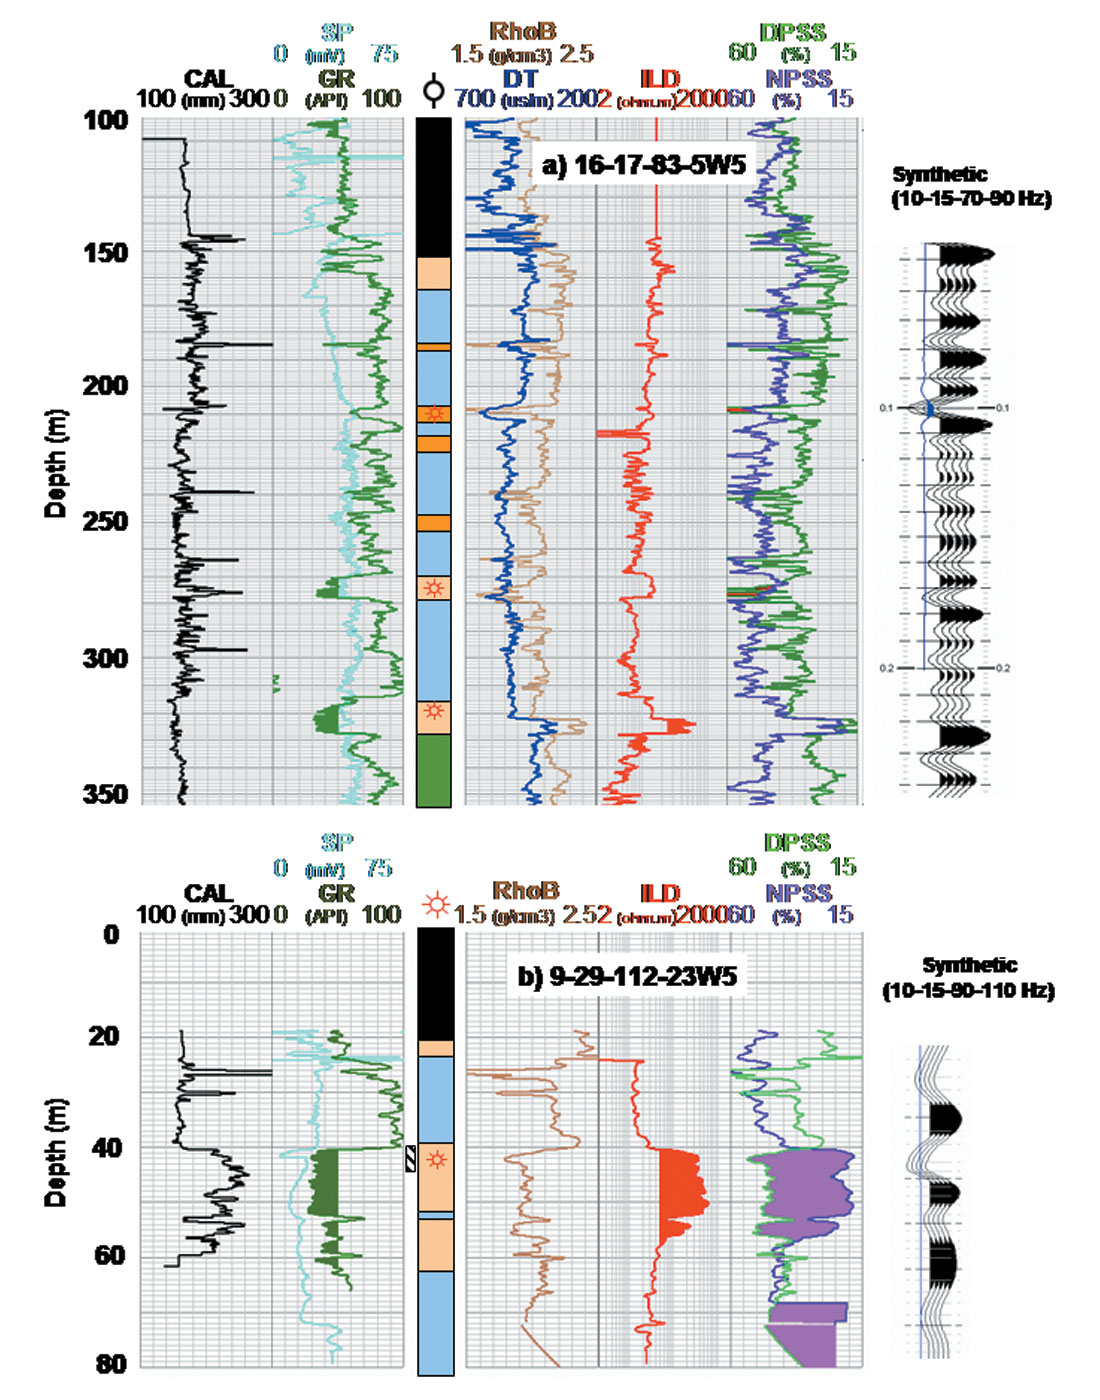
In the example from Sousa (Fig 5b), the 20 m thick sand has resistivities over 200 ohm.m indicating a very clean sand and gravel with high gas saturation. At a depth of only 40 m, this resistivity anomaly is easily detected using surface resistivity.
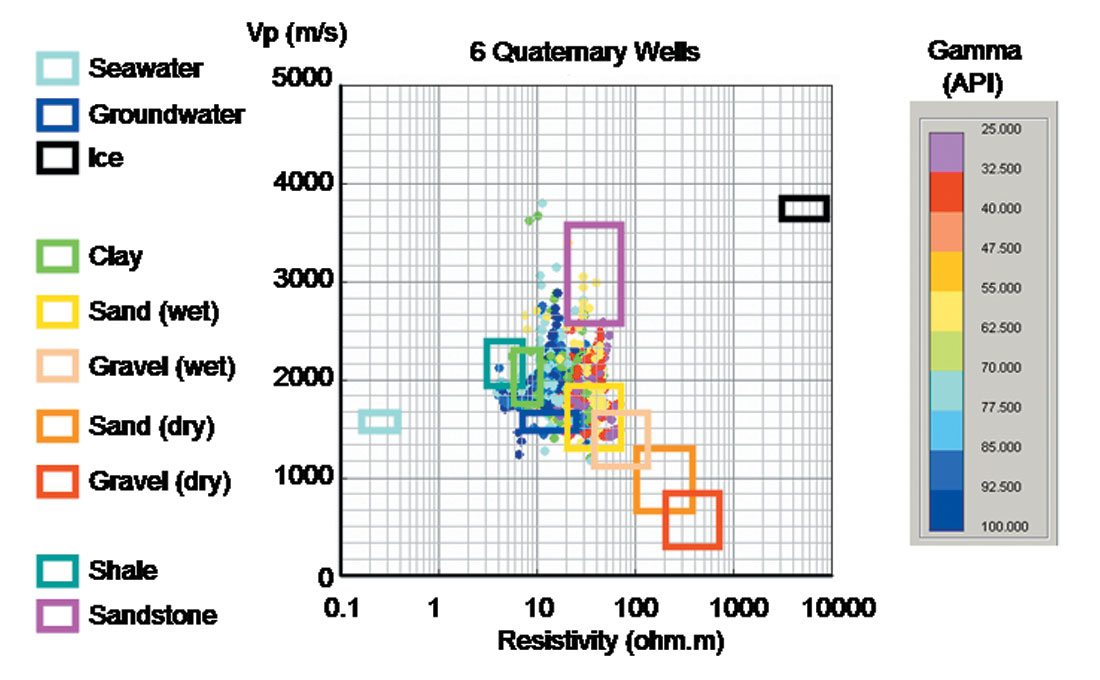
The application of both seismic and resistivity methods in the exploration program requires some understanding of the relationships between the acoustic and electrical properties of the target, and the background geology (Figure 6). In consolidated sedimentary rocks (sandstones, shales, and carbonates) the relationship between resistivity and velocity is complicated. In general, velocity is dominated by the matrix properties, and resistivity is dominated by the fluid properties. Recent increase in the use of electromagnetic methods in deep water oil and gas exploration has prompted a renewed interest in the relationship between resistivity, velocity, and porosity (Hacikoylu et al., 2006). However, in unconsolidated sediments with either gas or fresh water in the pore spaces, both velocity and resistivity are controlled by the degree of compaction, and the saturation (Ahmad and Schmitt, 2006). The cross-plot (Figure 6) shows a reasonable log-linear relationship between resistivity (ohm.m) and velocity (m/s). At one end of the spectrum, coarse-grained gravels have high resistivity and low velocity; while at the other extreme, tight clays have low resistivities and higher velocities. Silts and sands fall on the line between these extremes. The results from the logs agree well with the values derived from literature (Sharma, 1997).
Seismic and EM Interpretation
To a first order, the contact between the Quaternary sediments and the Cretaceous bedrock is marked by an increase in velocity and a decrease in resistivity, making it a good boundary to use for any combined interpretation or joint inversion of seismic and resistivity/ electromagnetics. Forward modeling of potential targets indicates that in the depth range 0 – 300 m, seismic reflection and refraction data will provide a detailed image of the contact between the Quaternary sediments and the Cretaceous/Devonian bedrock. The seismic needs to have small group spacing (< 30 m), small minimum offsets (< 60 m), large maximum offsets (> 1000 m), and a broad frequency content (up to 70 Hz). If the sands within the Quaternary section are thick, their geometry may be determined by reflections from their base and by lateral velocity anomalies (Ahmad and Schmitt, 2005). Using airborne electromagnetics, it will be possible to accurately map the depth to the bedrock and the lateral position of resistive sands. Ambiguity in the inversion process prevents accurate determination of the vertical extent of the sands. Ground-based resistivity methods are better at determining the lateral and vertical location of the resistive bodies; however ambiguities in inversion affect the resolution of the bedrock contact.
The commonly used EM and resistivity methods include:
- 2D Direct Current (DC) resistivity imaging (Dahlin, 2001).
- Ground based Transient EM (TEM) sounding (McNeill, 1982).
- Airborne Transient EM (TEM) profiling (Annan et al., 1996).
- Airborne Frequency domain EM (FEM) profiling (Hodges, 2004).
Readers are urged to look at the references for detailed descriptions of the geophysical techniques. Airborne magnetics can provide a very clear image of the spatial distribution of the drainage system resulting from the concentration of magnetic minerals in the fluvial sands and gravels relative to the background till and bedrock (Davies et al., 2004).
Geophysical Facies Model
In this paper the concept of a geophysical facies is presented as an extension of the well-known “seismic facies” descriptions (Pugin et al., 1999). The use of multiple geophysical methods with similar vertical and horizontal resolutions enables us to look at the “geophysical facies” from the perspective of two or more rock properties (e.g. seismic reflectivity, velocity, and resistivity). In this paper the concept is applied to the Quaternary targets. A similar approach may be applied to the oilsands and conventional exploration targets. However, in each case petrophysical data need to be considered to understand the relationship between rock properties.
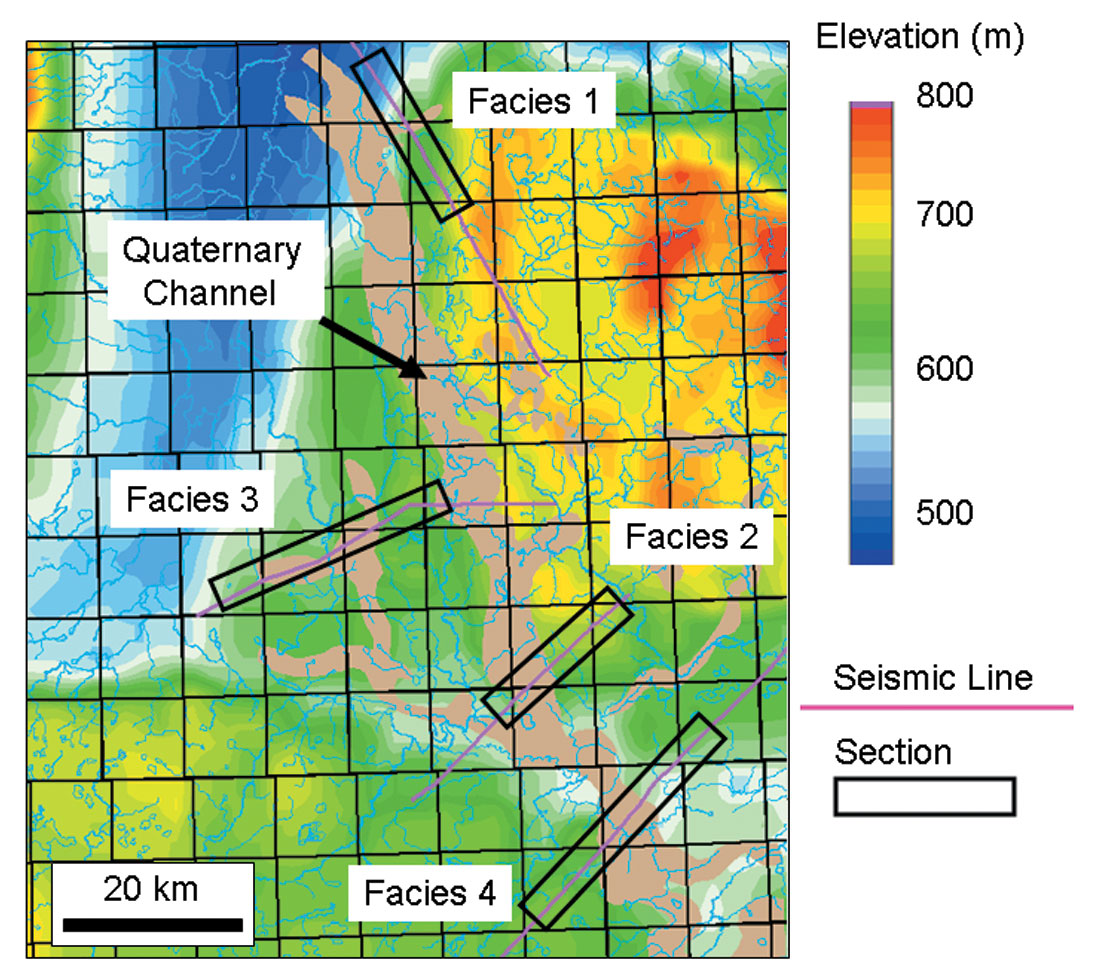
Figure 7 shows the locations of selected geophysical lines over the Quaternary channel system in the Utikuma region. These lines are used to illustrate the geophysical facies.
Facies 1
The narrow channels described in Figure 4 (Facies 1) are seen on seismic sections as sharply incised “notches” into the bedrock. The Quaternary section is thin (< 100 m) and generally transparent to seismic (Figure 8a). The narrow channels show evidence for infilling with well-bedded strata. The resistivity section shows a gradual increase in resistivity with depth then a sharp drop in resistivity at the top of the bedrock (Figure 8b). Isolated resistivity anomalies are mapped immediately above the bedrock contact and correlate with seismic anomalies with no internal reflectivity. These deposits may be reworked sands in a braided channel system that has been abandoned by the onset of development of the small incised valley.
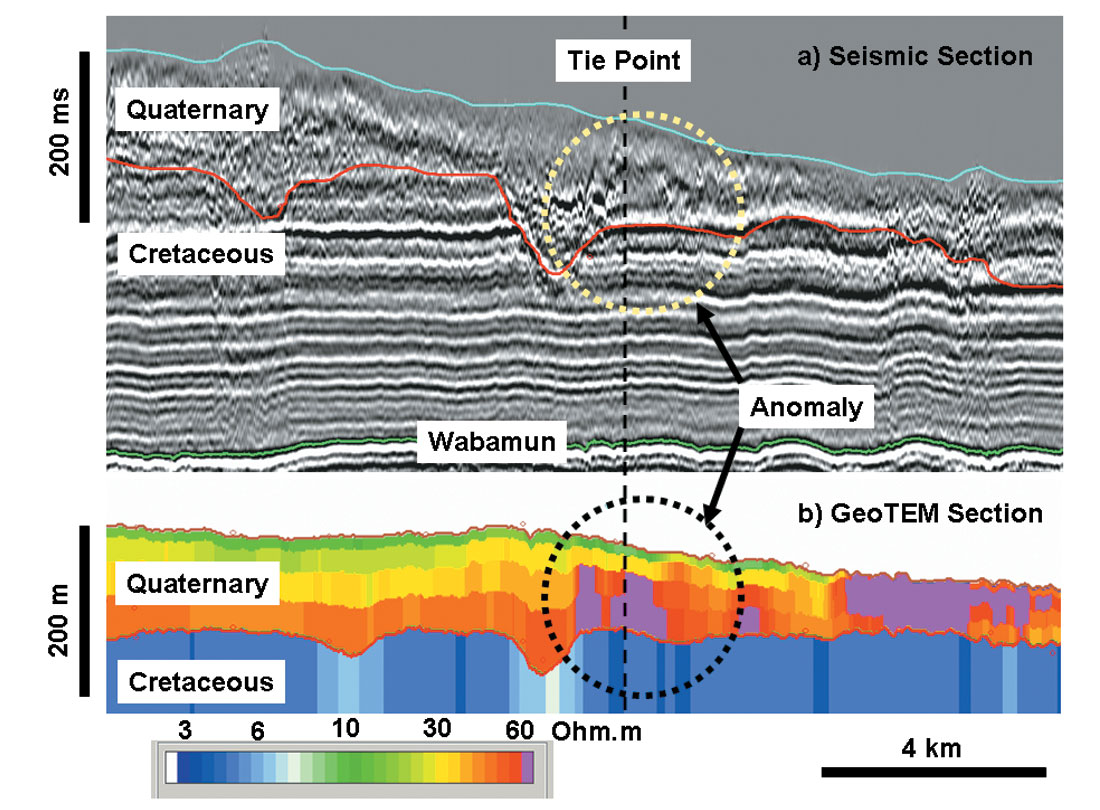
Facies 2
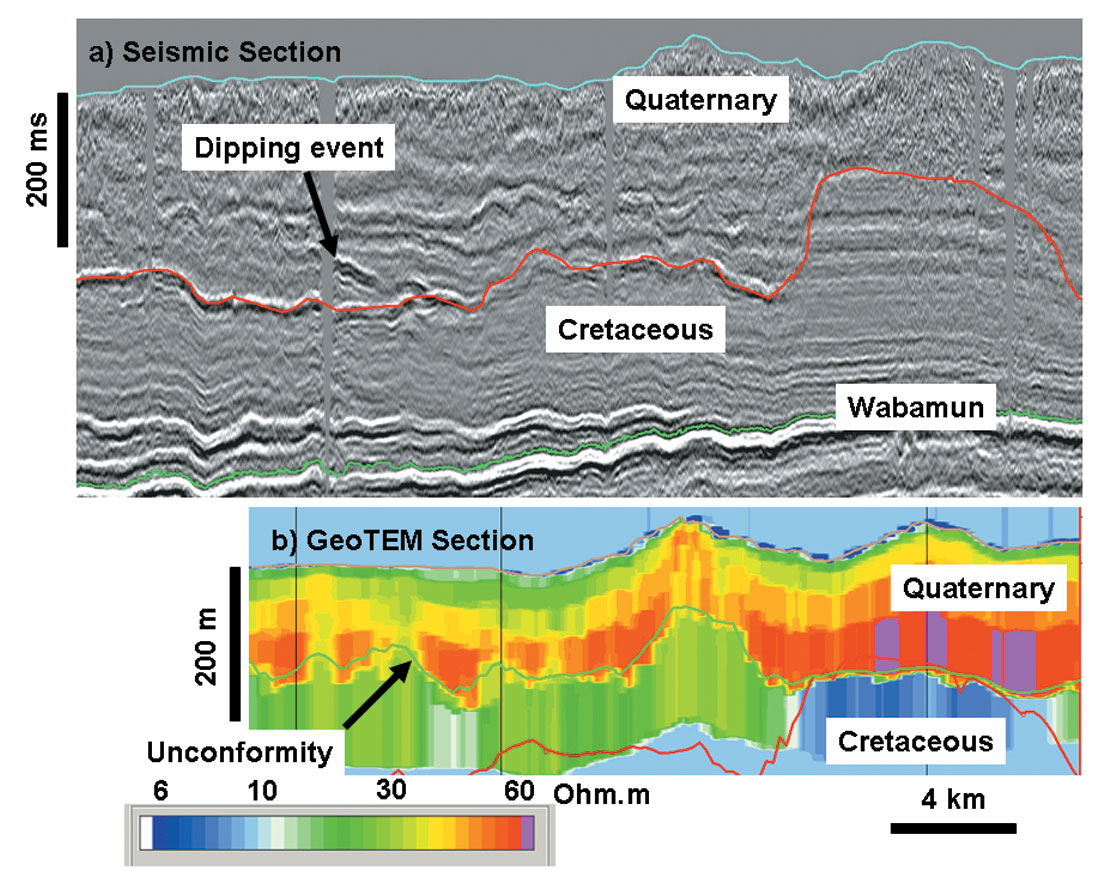
Figure 9, illustrates a major incised valley that cuts down 200 m into the Cretaceous. The valley has several generations of terrace formation, which could be interpreted to indicate a fluvial origin. The base of the channel is flat and is marked by a strong reflector (Figure 9a). Wells that penetrate the centre of the channel indicate that the base is a well cemented “hard-ground”. The sediments deposited on top of this “hard-ground” are flat lying, moderately reflective, and have low resistivity (Figure 9b). The logs show them to be finely bedded silts and sands. The low resistivity may result from more conductive pore fluids, or an increase in clay content. There is a marked boundary between the channel fill and the more incoherent units above. These beds, with chaotic reflectivity and high resistivity, are likely to be sands and gravels that have been deposited rapidly or reworked by glacial processes. The highest resistivities from the airborne EM sections lie on the flanks of the main channels. The more detailed DC resistivity section (Figure 9c) yields a more realistic distribution of sands and gravels draped over the terraces.
The next two “geophysical facies” relate to the more chaotic parts of the paleoenvironment where repeated advances and retreats of the ice front have deformed and homogenized the lithological units (Bennett and Glasser, 1996).
Facies 3
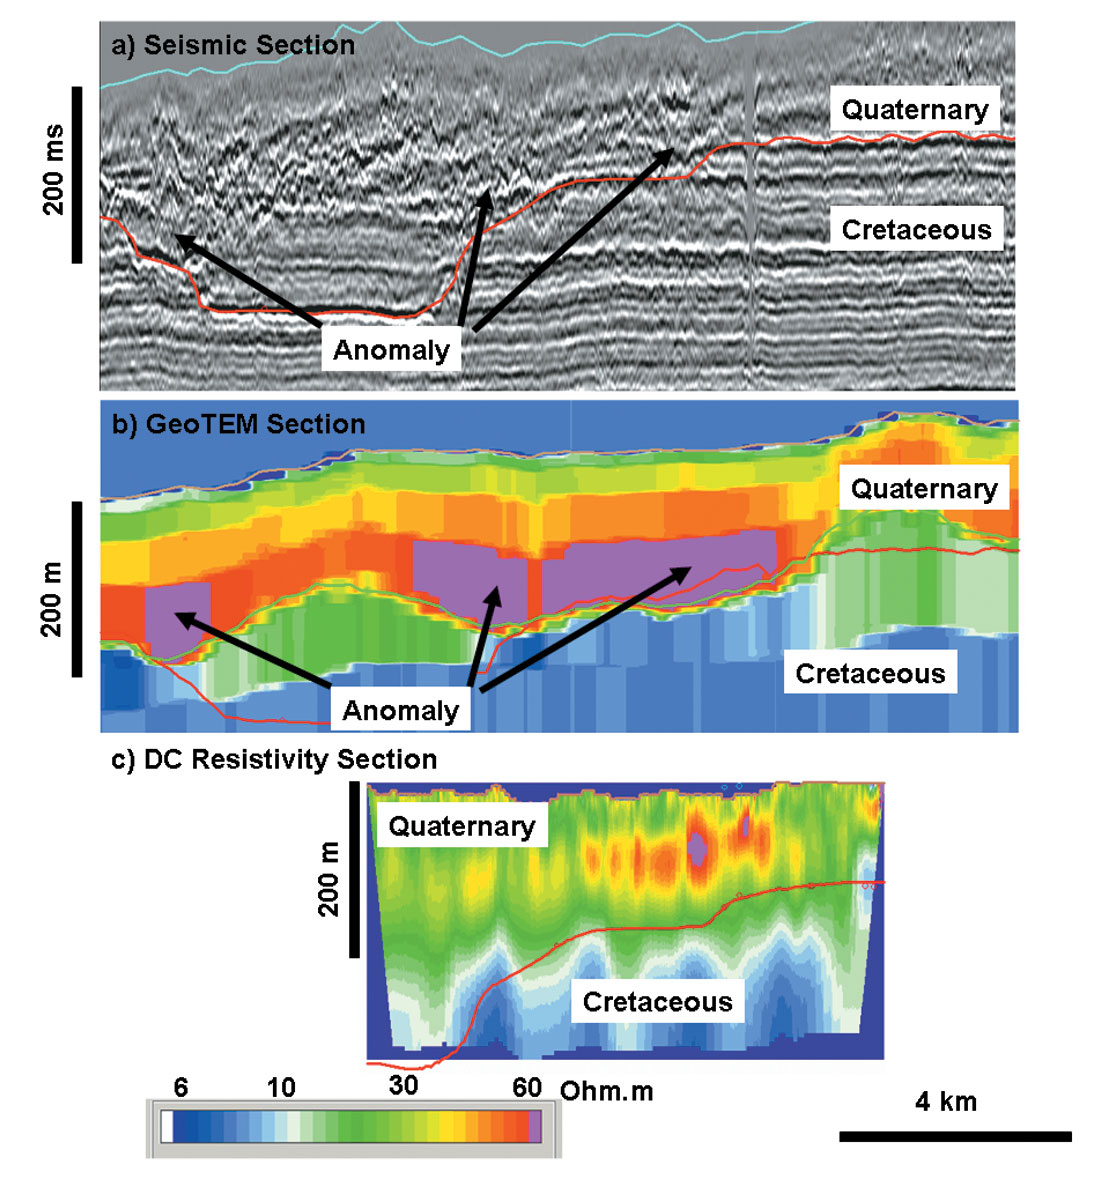
Figure 10 shows the seismic and resistivity section from a broad valley complex. The contact with the bedrock is sharp and convoluted. The infilling Quaternary sediments can be divided into two layers. The basal layer is seismically transparent but there are occasional dipping events that are interpreted to be unconformities. This deeper layer has moderate resistivity (30 – 40 ohm.m). The shallower layer is poorly imaged by the seismic and is dominated by scattered energy indicating the presence of a poorly sorted and coarse-grained sediment. The airborne EM data show strong lateral changes in the resistivity of this shallow layer suggesting localized zones of sand and gravel with potentially high gas saturations. Both the seismic and the airborne TEM produce unreliable images of the very near-surface so there is a danger that the resistive anomalies in the shallow layer may extend to surface. If this is the case then the sands and gravels may be “thief zones” breaching the reservoir to surface.
Facies 4
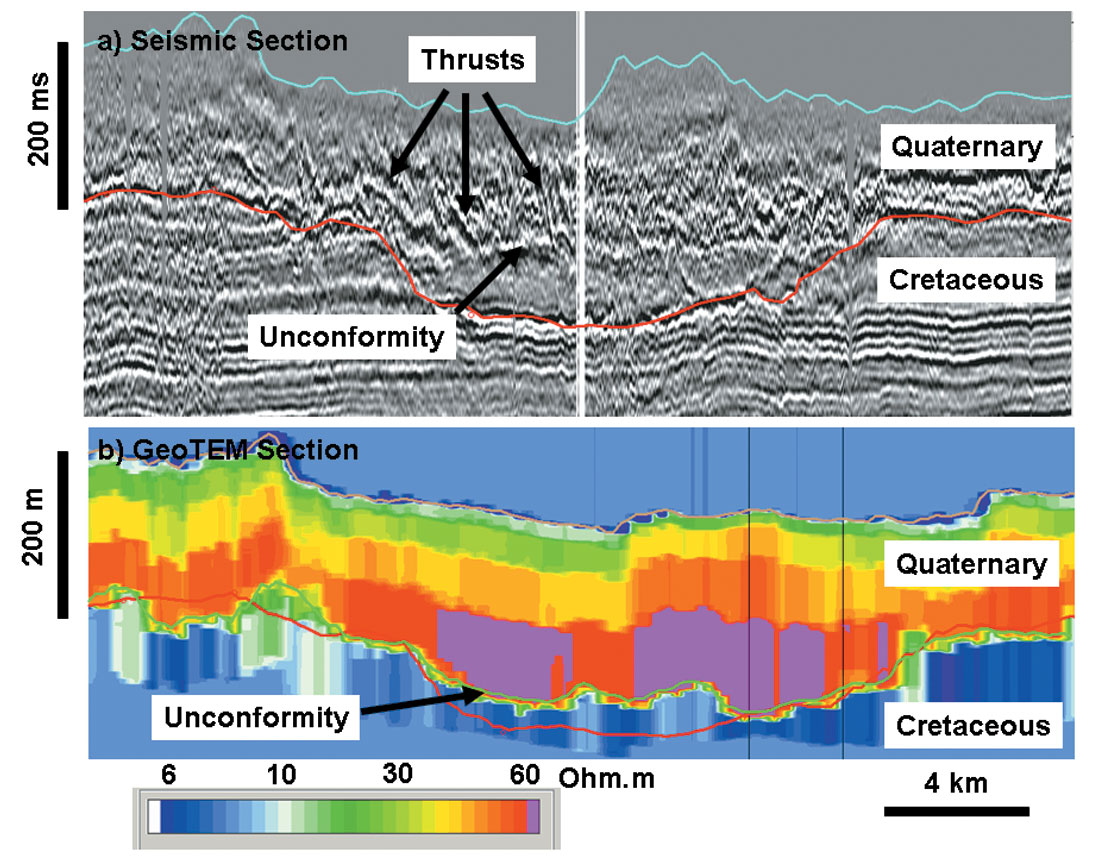
Facies 4 is an even more chaotic environment and typically very high risk for seal. The advancing glaciers have frozen sediment to their base, and have pushed up thrust sheets of till and bedrock. The seismic section has steeply dipping events that are interpreted to be the thrust planes (Figure 11a). Higher resolution seismic surveys from the Cold Lake area show a well-defined imbricate thrust system, and many features analogous to a thrust belt developed in consolidated sediments (Andriashek et al., 1999). These thrusts can extend to surface and produce ice-thrust ridges composed of a chaotic mixture of sands and gravels. Seismic data shot over these ridges is usually of very poor quality because of the loss of energy due to scattering. The EM section (Figure 11b) shows a concentration of high resistivities in several of the thrust sheets. There is evidence for a detachment surface at the base of the thrusts and a basal unit with lower resistivity and more coherent reflectivity. Drilling in these regions can be very risky with a high chance of lost circulation, flowing aquifers, and even over-pressured zones. In addition to the compromised seal, the gas reservoirs are likely to have poor lateral continuity.
Conclusions
The Quaternary gas play is still in its early stages of development. Large areas of northeast British Columbia, Alberta, and the southern North West Territories hold a lot of potential but have not been explored. Mapping the distribution of the channels with existing seismic, and airborne geophysics is an effective way of determining the fairway for exploration. More detailed EM, ground resistivity, and seismic is needed to place exploration wells in the best locations. The key geological risk is the presence of a seal, as breaching to surface is very common. The key engineering challenge is using the appropriate drilling and completion strategy to reduce the risk of formation damage. The main economic risk is the cost of a gathering system and the distance from facilities. However, even if the economics are poor, a factor pushing further exploration for the channels is the possibility of predicting shallow drilling hazards for deeper conventional targets. The Quaternary system is very complex with a poor chance of preservation of many geological facies, but this paper has divided the commonly encountered facies into four sub-sets. The description of “geophysical facies” comprising both seismic and resistivity images is a step forward in reducing geological risk when drilling for ultra-shallow gas reservoirs. Improvements in joint and constrained inversions of seismic, resistivity, and electromagnetic data will require a better understanding of the petrophysical relationships linking resistivity, velocity, and porosity in unconsolidated sediments.

Acknowledgements
This study has been supported by Pioneer Natural Resources Canada. Data presented in the paper were collected by several companies including Fugro Airborne and Worley Parsons Komex. ARCIS Corporation is thanked for their detailed reprocessing of the 1980’s vintage seismic data. Ted Glenn, Jerry Spring, Paul Bauman, and Doug Schmitt provided comments on the merits of inversion, and the resolution of the geophysical methods presented.


Join the Conversation
Interested in starting, or contributing to a conversation about an article or issue of the RECORDER? Join our CSEG LinkedIn Group.
Share This Article