The Reservoir Characterization Project (RCP) at the Colorado School of Mines has pioneered research into 3-D, 3-C (multicomponent) reflection seismology for nearly a decade utilizing both P-wave and S-wave sources. Multicomponent seismic surveys provide significantly more information about petroleum reservoirs than compressional wave surveys. The initial three 3-D, 3-C surveys acquired by RCP were targeted at characterizing naturally fractured reservoirs. The current phase of the project is oriented towards utilizing shear waves to discriminate lithologic and diagenetic changes within stratigraphic reservoirs where compressional seismic data have not been effective. The Joffre Nisku reservoir is the site of RCP's ongoing multidisciplinary research effort in Western Canada. The research team is directed by Colorado School of Mines faculty with graduate team members from the geology, geophysics and petroleum engineering departments. While this study is still in progress, some of the key findings and directions of this research are reported here.
Joffre Field 3-D, 3-C Survey
Joffre field is located in south-central Alberta, near the city of Red Deer on the inner Nisku shelf (Figure 1). The Nisku Formation (D2) at Joffre is a dolomitic shelf carbonate of Upper Devonian (Frasnian) age. This field was discovered in 1956 and has produced approximately 7 million cubic meters (43 million STB) of oil, which is estimated to be 26% of the original oil in place. Updip and lateral filling of porosity with anhydrite has produced the trapping mechanism. This 20 to 25 meter thick reservoir has highly variable porosity and lithologic content (mainly dolomite and anhydrite), suggesting a complex diagenetic history (Arestad, et ai., 1994, AI-Bastaki, et ai., 1994). The geologic complexity of this reservoir, its production spacing units and the hydrocarbon production history suggest that significant additional reserves remain to be recovered. Compressional seismic data have had limited success in reservoir delineation, primarily because the impedance contrast between the Nisku reservoir and surrounding rock is very small. Additionally, multiple and converted wave (P-SV) contamination are major problems for compressional seismic data in this area.
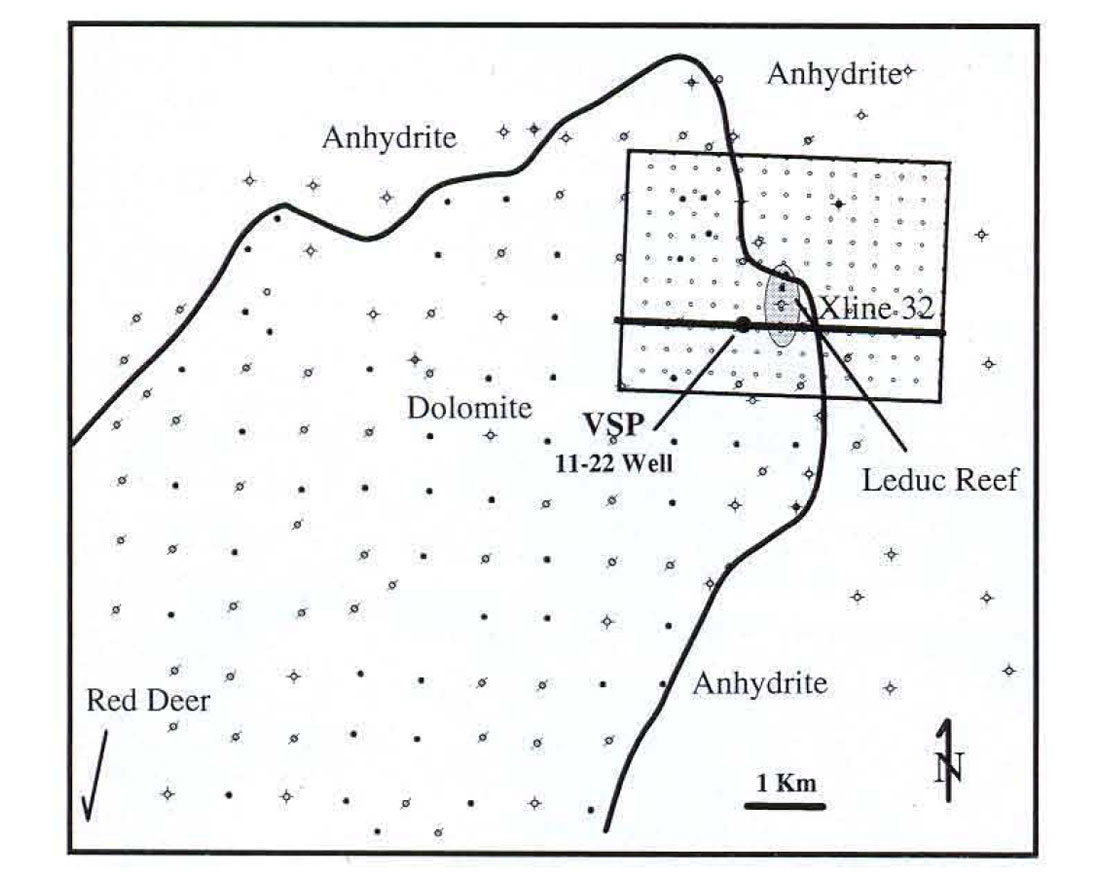
In 1992, the Reservoir Characterization Project sponsors selected Joffre as the primary target for 3-D, 3-C seismic applications for lithology and porosity detection. The northeastern edge of the field was selected for this survey where the Nisku reservoir is present in both updip and lateral sealing positions, and where widely spaced well control (160 ac.) defines this reservoir edge. The survey was designed to test the imaging potential of multicomponent seismic data on the stratigraphic porosity pinchout and to detect if there is additional reservoir potential in this area. Additionally, an oil productive Leduc pinnacle is present below the Nisku reservoir in the middle of the seismic survey area. The survey was shot (as indicated in Figure 1) in May, 1993 and is the first 3-D, 3-C seismic survey to be acquired in Western Canada.
The survey was acquired for RCP by Solid State Exploration using an I/O System II acquisition system, a patch based geometry with 972 live channels (324 sets of live 3 component geophones), OYO 3 component geophones, Mertz 18 P-wave vibrators and Mertz shear wave vibrators (provided by Amoco) with rotating base plates. Compressional data were processed by both Golden Geophysical Corp. and Pulsonic Geophysical Ltd. Golden processed the shear source data and Pulsonic processed the converted wave (P-S) data. Schlumberger Canada acquired a dipole sonic log in addition to near offset compressional, near offset shear and walkaway compressional vertical seismic profiles (VSP) for RCP in the 11-22-39-26 W4 well (11-22) near the center of the 3-D, 3-C seismic survey. The compressional and shear sourced VSP data were processed by RCP (Mattocks, 1993).
Compressional 3-D Survey
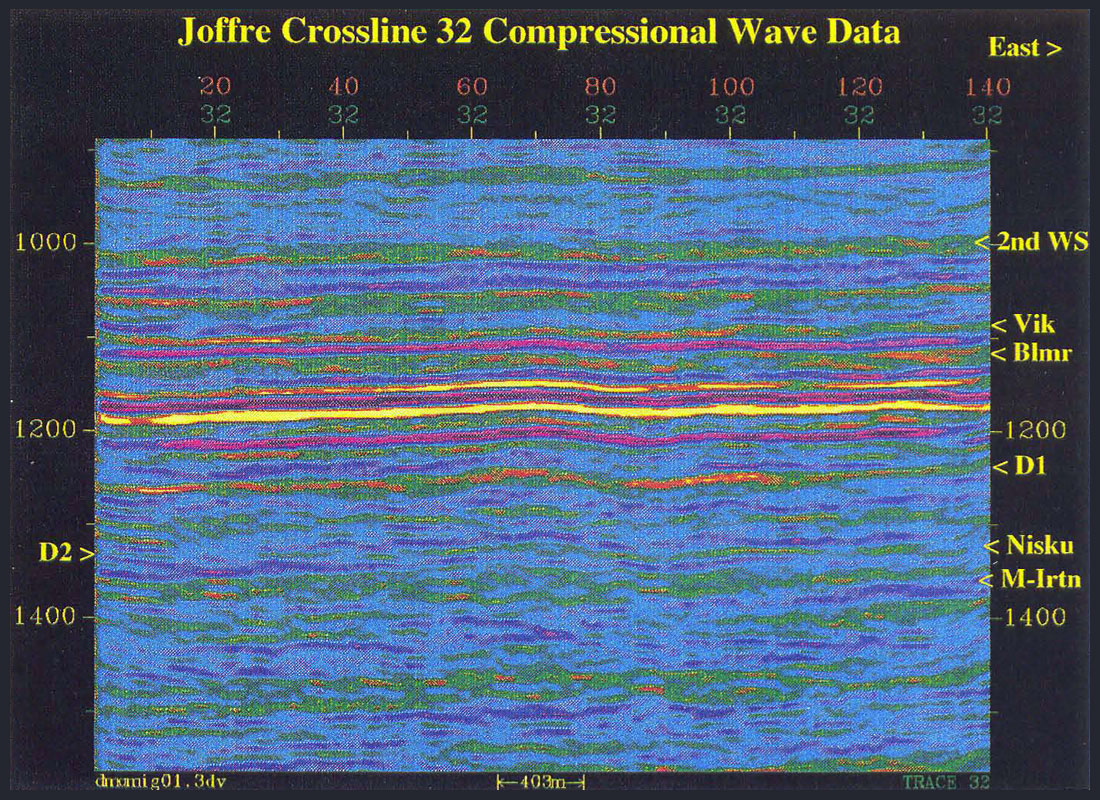
The Nisku P-wave reflection is generally weak and does not allow discrimination between porous and tight zones (Figure 2). Data from the 3-D compressional data volume have been useful for structural mapping, for velocity ratio (Vp/Vs) calculations and for detection of faults and local fracturing. Low amplitude lineations in the compressional volume indicate fault/fracture zones, which are aligned parallel to the present direction of maximum horizontal stress area (Bell and Gough, 1979; Zoback, M. L., 1992). These faults/fracture zones, which had not been previously mapped, appear to contribute to the production heterogeneity of the Nisku reservoir. Some of the better producing Nisku wells are located near these faults/fracture zones. These faults may have been produced by reactivation of an old shear zone, such as can be inferred from the Lithoprobe Alberta Transect seismic line to the north of Joffre (Eaton, et aI., 1994).
Shear 3-D Survey
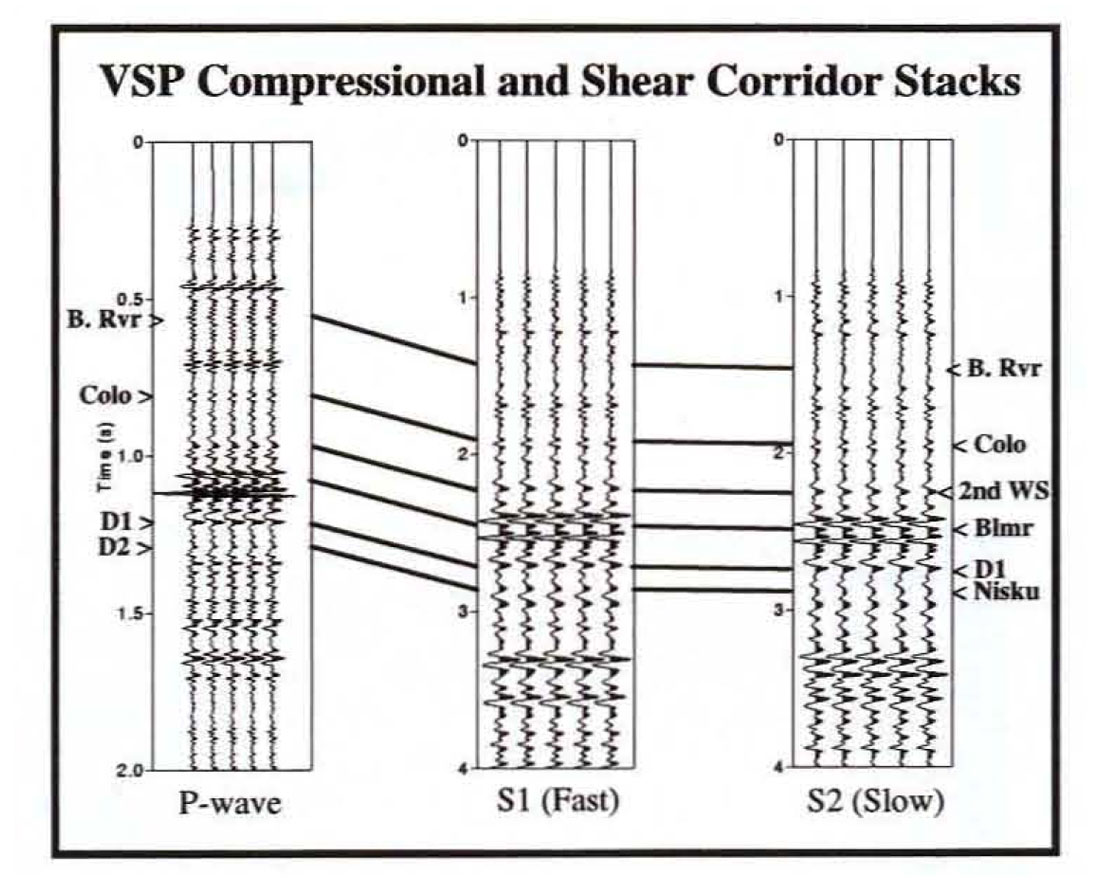
Shear waves are split and polarized into fast (S1) and slow (S2) shear waves when encountering anisotropic media (Martin and Davis, 1987). Shear wave particle motion will be oriented perpendicular (S1) and parallel (S2) to the direction of minimum horizontal stress (S3). Analysis of the polarization directions of the split shear waves is critical in the treatment of shear wave data from anisotropic media. These data must be rotated into their natural polarization directions for both processing and interpretation. Prestack and poststack rotation analysis of the Joffre data yielded average S1 polarization directions of approximately N45°E (Arestad, et ai., 1994). This northeasterly trend has also been observed in the field production data indicating northeast directional permeability (Arestad, et aI., 1994). This northeasterly direction is consistent with the present orientation of the maximum horizontal stress field in this area (Zoback, M. L., 1992). A similar northeast directionality can also be observed on aeromagnetic data from this region (Eaton, et aI., 1994). Since the shear wave sources had been deployed with N4°E and N45°W coordinate frames, only receiver rotations were required to orient the survey properly. The S1 (fast) and S2 (slow) shear wave data volumes were migrated, and a small phase rotation was applied to best match the VSP corridor stack from the 11-22 well. The phase of the VSP P- and S-wave data were checked with synthetic seismograms generated with compressional and shear sonic data from the dipole sonic log. The VSP ties to the P, S1 and the S2 surface datasets were used to provide reliable identification of surface data reflection events. This step is crucial for interval work involving more than one data volume such as velocity (Vp/Vs) ratios and anisotropy calculations. The VSP corridor stacks from the 11-22 well used for these correlations are shown in Figure 3.
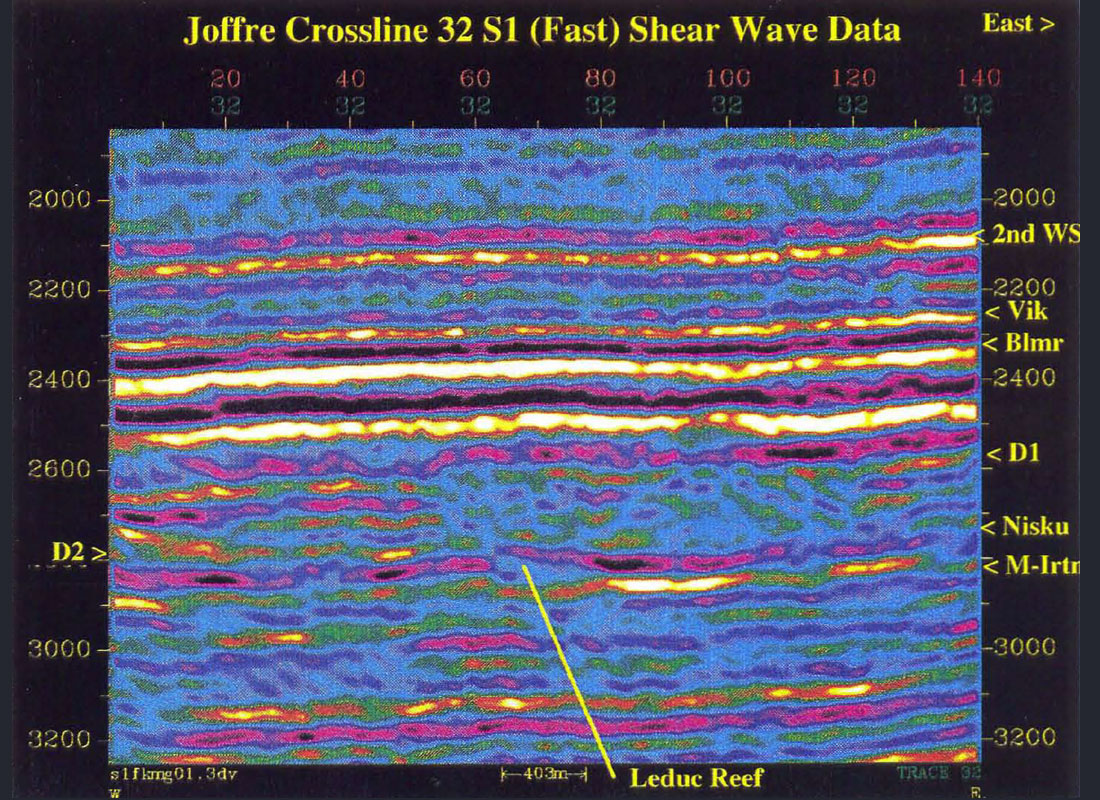
An S1 (fast) shear wave line (Crossline 32) extracted from the 3-D data volume is shown in Figure 4. Vp/Vs ratio analysis was performed on the interval from the Wabamun (D1) through the Nisku to a mid-Ireton marker. The producing Leduc reef, present in the middle of Crossline 32 at about 2800 ms, is imaged by the 3-D shear wave data better than in the compressional data. Shear wave data across a dry smaller Leduc pinnacle to the southeast of this feature does not show this type of response. These results are encouraging and could be significant for Leduc exploration.
Ratios of compressional to shear velocities (Vp/Vs) are extremely powerful for lithologic discrimination (Pickett, 1963). Calculations of Nisku velocity ratios from dipole sonic, array sonic and other wireline logs indicate a strong dependency on mineralogy and porosity, suggesting that the Vp/Vs ratio should be an effective tool for lithology discrimination in the reservoir (Sarmiento, 1994). Velocity ratios for the surface seismic data were computed over the D1 to mid-Ireton interval using the methodology discussed by Tatham and McCormack (1991). Vp/Vs ratios can be computed utilizing interval traveltimes from both the compressional and shear wave data sets, provided that the P-wave and S-wave reflections originate from equal depths and intervals. The Vp/Vs ratio for an interval is equivalent to the shear traveltime to P- wave traveltime ratio (Dts/Dtp) over that interval. The D1 and mid-Ireton reflections were selected for this analysis because they are the strongest continuous events which narrowly bracket the Nisku interval. Identification of the specific horizons was based on the ties of the VSP corridor stacks to the P, S1 and S2 surface data sets, utilizing both visual and cross-correlation approaches.
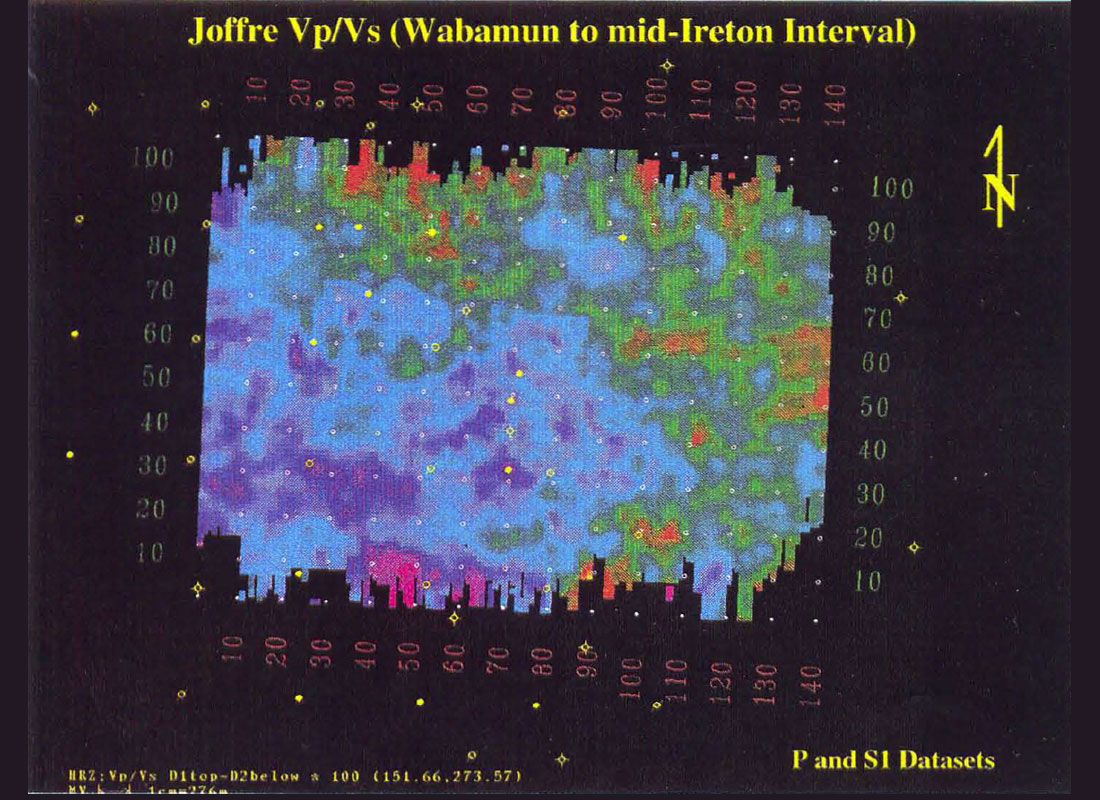
A Vp/Vs map computed from the S1 and P datasets for the D1 to mid-Ireton interval is depicted in Figure 5. The Vp/Vs ratio near the 11-22 well is approximately 2.0, and similarly, the Vp/Vs ratio computed from the 11-22 VSP traveltimes is 1.95 for the fast (SI) shear and P data. The map shows higher ratios in the western (oil productive) part of the survey and the field edge can be tracked by the changes of Vp/Vs ratio. The edge of the Nisku reservoir as determined from well control (see Figure 1) is somewhat different than from the Vp/Vs map, suggesting that there is potential for field extensions. The observed velocity ratio relationship over the field is opposite to what had been expected from the analysis of Vp/Vs ratios on cores and logs in the study area (Arestad, 1993; Sarmiento, 1994). The ratio in the porous dolomite reservoir should be lower than in the tight Nisku section containing both anhydrite and dolomite; the log analysis suggested Vp/Vs values of 1.87 in the dolomite and 2.0 in the anhydrite. The Nisku reservoir interval represents about 10% of the interval being measured in this analysis and may have only a minor influence on the overall interval values. The higher ratios found in the oil productive area may be related to changes of lithology, porosity and/or pore fluids above the reservoir. Similar increasing Vp/Vs ratios results were found in a 2-D, 3-C study over productive carbonates at Kingfisher, Oklahoma, which were attributed to porosity (Tatham and McCormack, 1991). Petrophysical analysis of wireline log data showed that the lithologies of the interval studied (-50% dolomite and -50% anhydrite) vary across the survey area (Sarmiento, 1994). Extreme increases in anhydrite would be required to produce the observed results, which is not justified in log and x- ray diffraction data. However, small lithologic changes may contribute to this effect, as may oil and gas within this interval. The porosity of this interval is low, but may be the largest contribution to the observed velocity ratio differences.
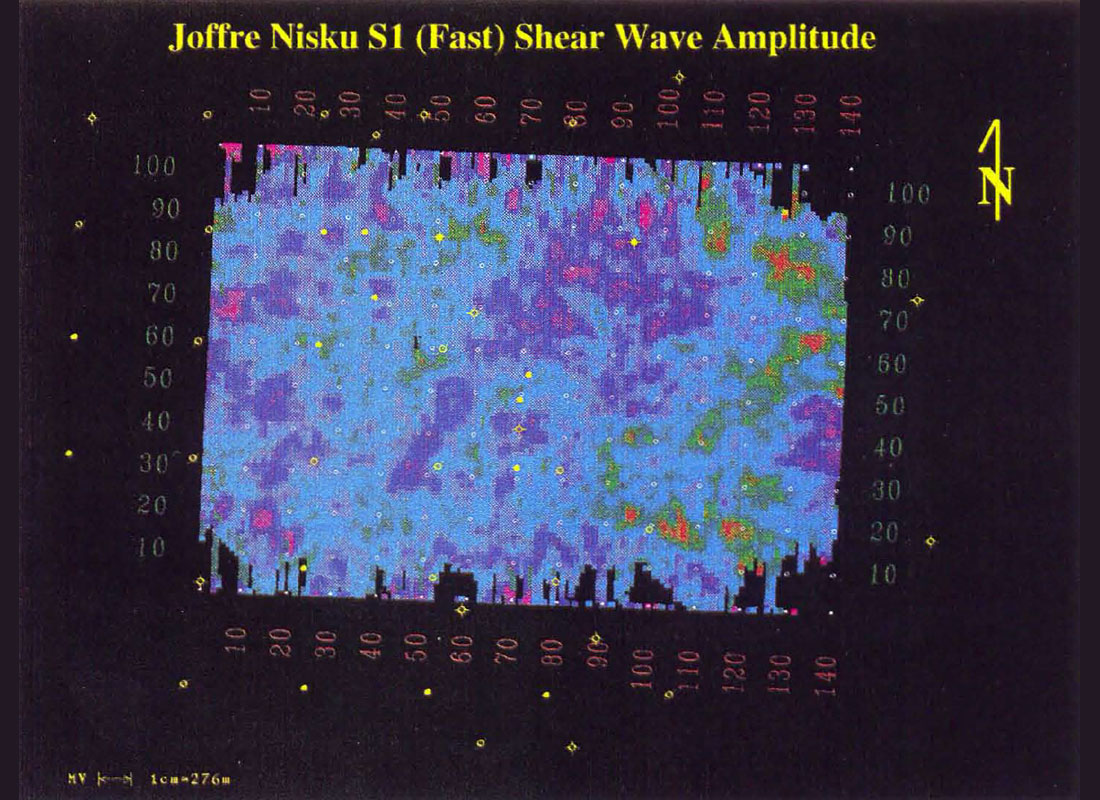
Changes in S1 reflection characteristics are influenced by lithologic variations and changes in S2 reflections are influenced by both lithologic and directional permeability (open fracture) variations (Mueller, 1994). Amplitude measurements from a geologic interface with an impedance contrast yields information from a thinner interval than the computed interval Vp/Vs velocity ratios, and will have better vertical resolution than Vp/Vs ratios extracted from interval timing measurements. The amplitude of the S1 Nisku event is stronger on the seismic section to the west of the Leduc reef where the D2 is productive (see Figure 3), which is an effect not observed on the compressional data (see Figure 2). Figure 6 is an amplitude map on the Nisku event from the S1 data volume. The higher amplitude areas correlate with better producing areas within the field. An exception to this observation is the broad higher amplitude feature centered at Inline 90 and Crossline 80. However, the edge of this feature was tested by the 12-26-39-26 W4 well, which had minor Nisku porosity and produced 12,000 STB of oil. The complex nature of this map is consistent with the known rapid lateral and vertical geologic changes within the Nisku reservoir.
Converted Wave 3-D Seismic Survey
Compressional seismic waves encountering an impedance contrast (reflector) at an offset greater than normal incidence will produce converted shear waves (P-SV). These converted shear waves will split into fast (P-S 1) and slow (P-S2) shear waves when encountering anisotropic media. While acquiring the compressional data at Joffre, both vertical and horizontal components were recorded. Converted wave data are present on the horizontal components. On the converted wave datasets, the Viking, BIairmore and Wabamun events are very strong, whereas the Nisku event is weak. The Nisku event is more continuous and stronger on the shear sourced data. Some of this weakness may be attributed to acquisition geometry. From the Joffre field experience, an improved survey acquisition design methodology has evolved, which will enhance future P, Sand P-S datasets. In general, the amplitudes on the P-S1 map are more diffuse and cannot be readily correlated with known Nisku reservoir changes. Additional analysis of these datasets are ongoing, which may improve our understanding of these data and their potential application towards reservoir characterization.
Reservoir Characterization
The ultimate test of information developed with new geophysical technologies and geologic concepts is drilling and development of additional reserves. By incorporating these new data into the Joffre full field reservoir simulation model, their importance can be evaluated and from which future drilling may result. An initial field reservoir model has been constructed (Al-Bastaki, et al., 1994). Results of the analysis of the compressional seismic survey' combined with geologic and reservoir engineering studies, are being incorporated into this model. While the compressional seismic volume could not be correlated to reservoir changes, it does show evidence of local faulting or fracturing that influence the direction and volume of fluid flow. These local features have been included in the model. Analysis of the production database supports the existence of a preferential permeability direction towards the northeast. The overall grid orientation for the reservoir simulation has been based on known fluid permeability directionality (determined from injection studies), local compressional seismic features and the polarization orientation of the split shear waves. The calibration of lateral reservoir property variations to the shear wave and Vp/Vs data is underway and will be included in the reservoir simulation.
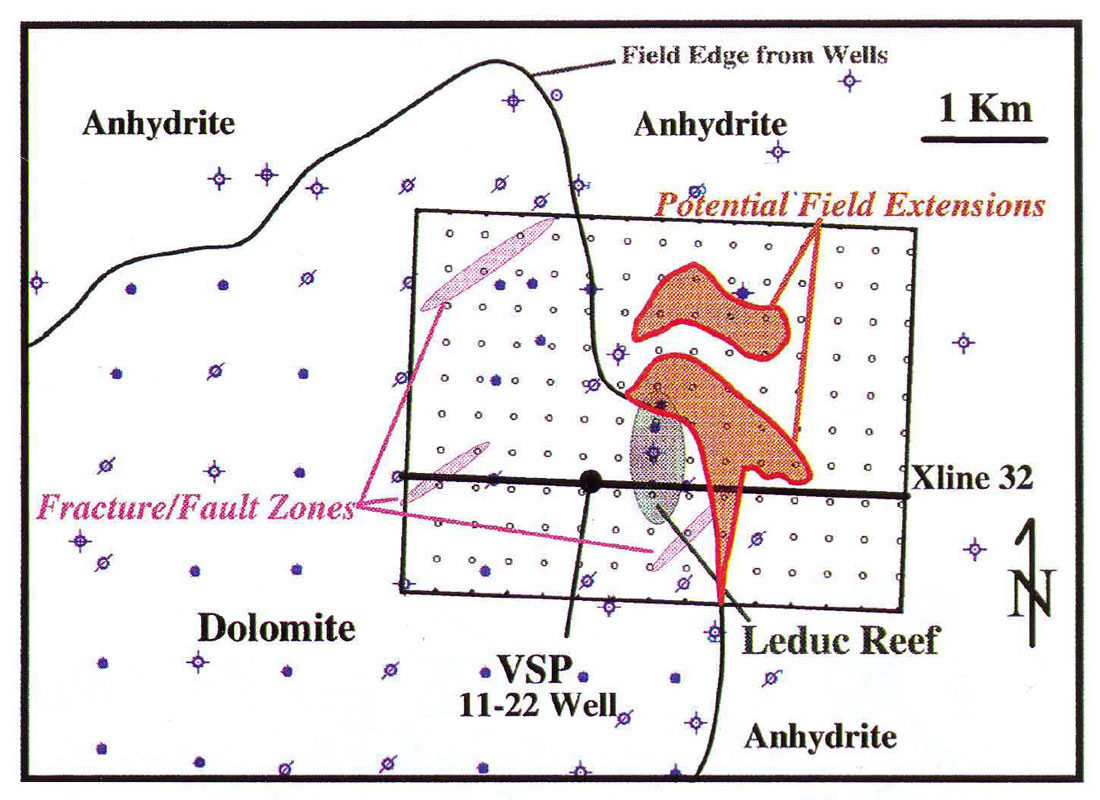
While this research is still in progress, evidence of reservoir compartmentalization has been found which should be important to the field operators. From the compressional 3-D data, the existence and locations of northeast trending fault and fracture zones, which may influence the reservoir fluid flow directions, have been identified (Figure 7). These zones, associated with good producing wells, must be accounted for in the design of an effective waterflood program. Both the Vp/Vs ratio and S1 amplitude mapping have shown potential field edge extensions. The S1 amplitude mapping suggests rapid lateral changes of reservoir properties within the Nisku reservoir, which may be exploitable.
Conclusions and Future Directions
Compressional seismic data have been ineffective for detection and characterization of the Joffre Nisku reservoir. Interpretation of the compressional 3-D survey has outlined the structural features of the area. Amplitude mapping of the Nisku reflection shows no correlation with reservoir properties or lithology.
Vp/Vs ratios over the Wabamun to mid-Ireton interval appear higher over the productive Nisku reservoir, which is a direct indicator of Nisku reservoir presence. Shear wave amplitudes from the SI data have a general correlation with the cumulative production of the Nisku reservoir. Significant lateral Nisku reservoir heterogeneity is shown. The knowledge of the spatial distribution of various reservoir compartments can be used to recover additional reserves through field redevelopment, which might include horizontal drilling.
For the first time, shear wave technology has been able to characterize the spatial variability of lithology within this complex dolomite reservoir. This technology will contribute towards improved hydrocarbon recovery and exploitation of this reservoir through improved imaging of lateral reservoir heterogeneities.
Research on these data is progressing towards inversion of the compressional and shear data volumes to produce Vp/Vs volumes. Amplitude versus offset (AVO) studies are focusing on anisotropic effects in the Devonian carbonate section. Geostatistical correlation of various attributes (such as shear wave amplitudes) to reservoir properties is ongoing. Reservoir simulation of the field is underway and will utilize information from the 3-D, 3-C seismic survey to test this technology and improve the reservoir model in the survey area. Research being conducted on the sedimentology and diagenesis of the Nisku formation in the Joffre area may result in new models for this complex stratigraphic unit.

Acknowledgements
The authors thank the other members of the Joffre research team (Abdul AI-Bastaki, Karen Bard, Max Rolla and Victor Sarmiento) for their enthusiastic and truly integrated multidisciplinary research. A thorough reservoir characterization is not possible without the personal conviction and effort made by each team member. We express our appreciation for direction, encouragement and financial support for this research to the RCP - Phase V Industry sponsors: Advance Geophysical Corporation, AGIP, Alberta Energy Company, Amerada Hess Corporation, Amoco Production Company, Arco Oil and Gas Company, Bow Valley Industries Ltd., Canadian Hunter, CGG, Chevron, China National Petroleum Corporation/Shengli, Chinese Petroleum Corporation, Conoco, Conwest Exploration Company Ltd., Exxon Production Research Company, Gas Research Institute, Golden Geophysical Inc., Gulf Canada Resources Ltd., Halliburton Energy Services, Japan National Oil Corp., Marathon Oil Co., Mitchell Energy Corp., Mobil Exploration and Producing Technical Center, Mull Drilling Company, NAL Resources, Noranda, Norcen Energy Resources Ltd., Northern Geophysical of America, Numac Energy Inc., Occidental International Exploration & Production Company, Pan Canadian Petroleum Ltd., Phillips Petroleum Co., Pulsonic Corporation, Schlumberger Canada, Solid State Exploration Ltd., Suncor Inc., Talisman, Texaco Inc., Union Pacific Resources, UNOCAL and Wascana Energy.


Join the Conversation
Interested in starting, or contributing to a conversation about an article or issue of the RECORDER? Join our CSEG LinkedIn Group.
Share This Article