Today's generation of superscalar workstations and high performance supercomputers allows full prestack time migration of 3-D data volumes within a time frame that is manageable from the explorationist's viewpoint. Most geophysicists are aware that performing prestack time migration on structured data sets offers certain advantages, particularly from the viewpoint of velocity analysis. However, many may be surprised to learn that sometimes 3D prestack time migration produces superior image quality even on "Canadian plains"-type data. In some situations the amount of improvement is large enough to justify the relatively large cost associated with this computationally intensive processing step. However, sometimes the amount of improvement is negligible, so the extra expense and computer time required for prestack migration would be wasted. The purpose of this article is to explain when to expect significant differences between 3-D prestack and posts tack time migration on data with little structure.
At first glance, it is somewhat puzzling that 3-D prestack time migration should produce any improvement over the more conventional flow of NMO, DMO, stack and 3-D poststack time migration since these two processing sequences are theoretically identical for a constant velocity medium. Constant velocity DMO algorithms work well even when the velocity is mildly varying, so for a large number of real world situations, you would expect results obtained from the two processing sequences to be very similar. In particular, prestack and poststack time migration of Canadian plains data, where flat-lying geology gives rise to a small DMO correction, ought to yield similar outputs based on this simple argument.
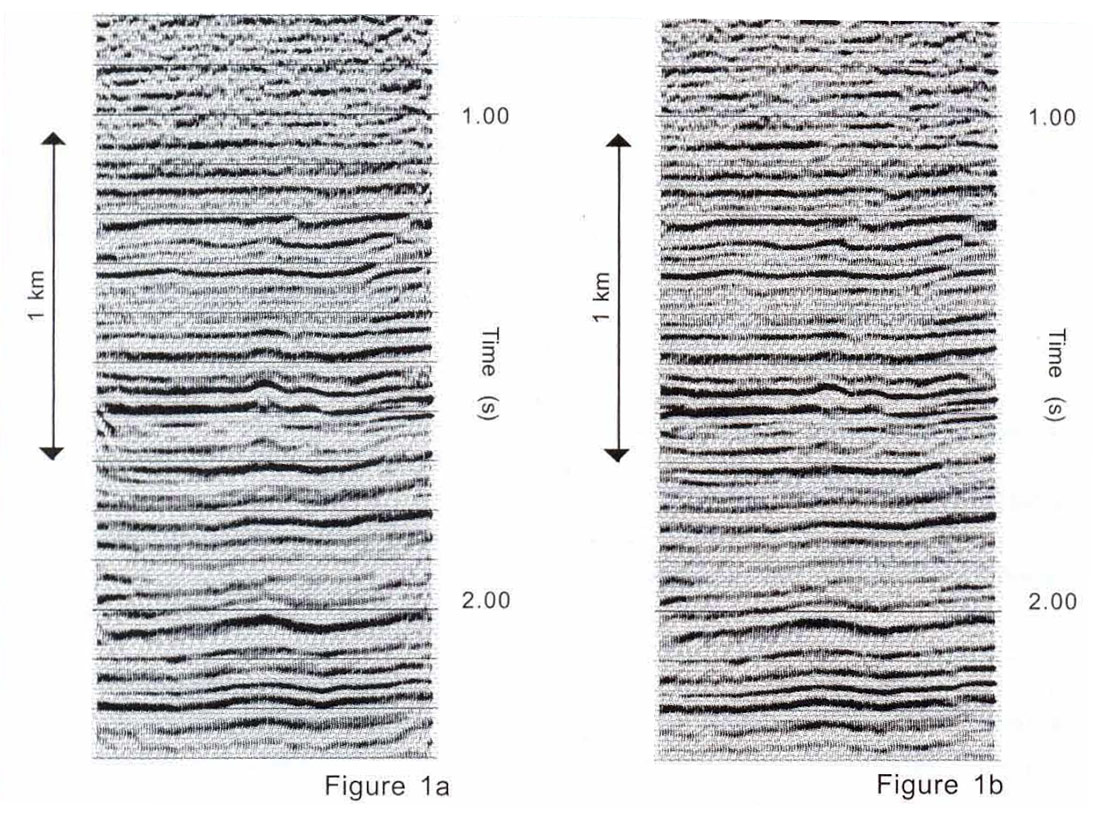
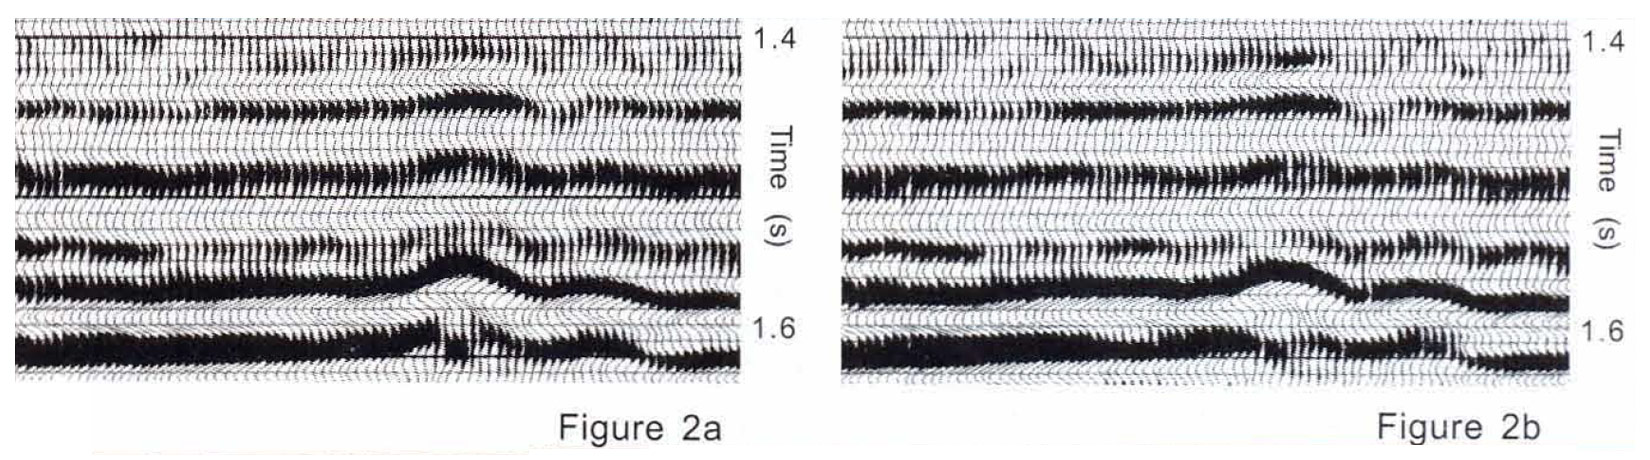
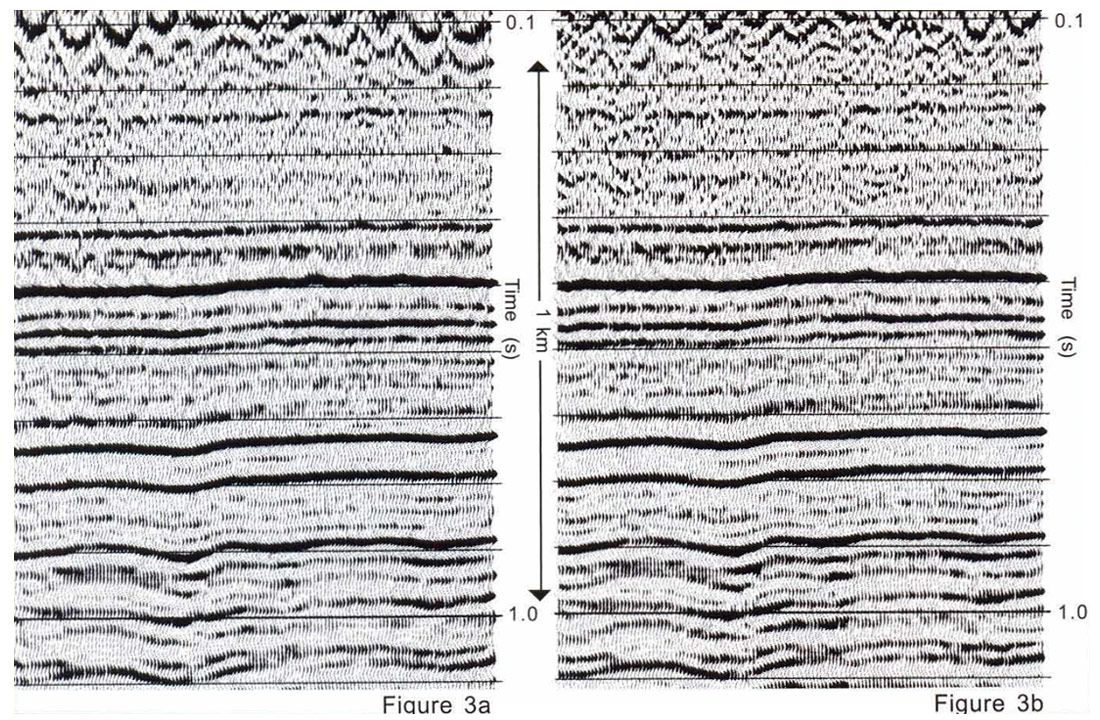
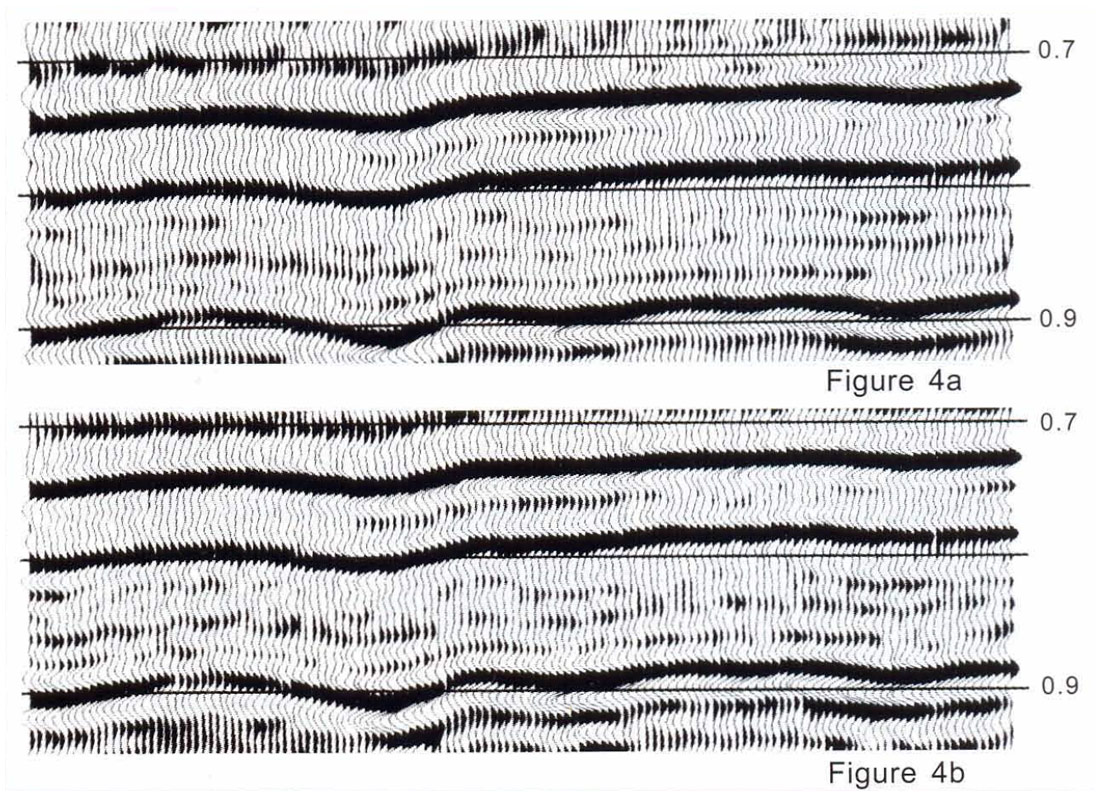
The reality, however, is that Kirchhoff 3-D prestack time migration can sometimes provide significant improvements on plains-style data, even when no migration velocity analysis is performed. On some data sets, horizons appear better focussed, and the seismic sections look cleaner after prestack migration. On other data sets, very little difference is observed between prestack and poststack migration images. Figures 1 and 2 show the results of applying 3-D Kirchhoff prestack time migration and NMO + DMO + stack + 3-D Kirchhoff poststack time migration to a Canadian land data set. The same migration velocities were used in both cases. Figure 2 clearly shows that the short wavelength component of the spatial structure is better resolved after prestack migration. On the other hand, Figures 3 and 4 show another plains data example where 3-D prestack time migration made little discernible improvement.
What is the reason for these different results? One possible explanation might be that prestack and poststack migration algorithms exhibit different signal-to-noise (SIN) enhancement characteristics. If this were the case, then prestack migration might preferentially improve the appearance of the output for noisy input data sets, but do little to enhance image quality for cleaner ones. Another possibility might be that the prestack migration does a better job of handling some acquisition geometries than others. A third reason could be that prestack migration sometimes does a better job of performing the dip moveout correction than conventional DMO algorithms. We have heard all of these arguments used in the geophysical processing community in attempts to explain why prestack migration can work so well, some of the time, in areas that exhibit only mild structural variation.
In this article, we try to unravel some of the mystery as we investigate all three possible explanations using synthetic data sets. Our results indicate that the ability of prestack time migration to handle the effects of irregular acquisition geometry accounts for the improvements observed after prestack migration. Specifically, 3-D prestack time migration, at least Kirchhoff 3-D prestack time migration, does a better job of handling midpoint scatter than NMO + DMO + stack + poststack time migration. Our findings help shed some light on the effect of 3-D acquisition on final image quality, as well as on which 3-D prestack migration algorithms correctly account for midpoint scatter.
Random Noise
Interpreters and processors are aware that poststack migration provides a degree of noise attenuation beyond that associated with the stacking process. In particular, limiting the migration aperture cleans up seismic sections. Krey (1987) derived an expression for the RMS amplitude of noise that accumulates on a trace after stack plus 3-D Kirchhoff migration. We extend his work by writing the expression in terms of the migration aperture angle:

where N(j) is the amplitude of the accumulated RMS noise at frequency f, MCDP is the CDP fold, v is the velocity, Δx is the size of one side of the CDP bin (square bins are assumed), ɸ is the migration aperture angle defined as the tangent of the migration impulse response at its steepest point, and n is the RMS level of noise on the input prestack trace. The corresponding expression in 2-D depends on the fourth root of the sine of the aperture angle.
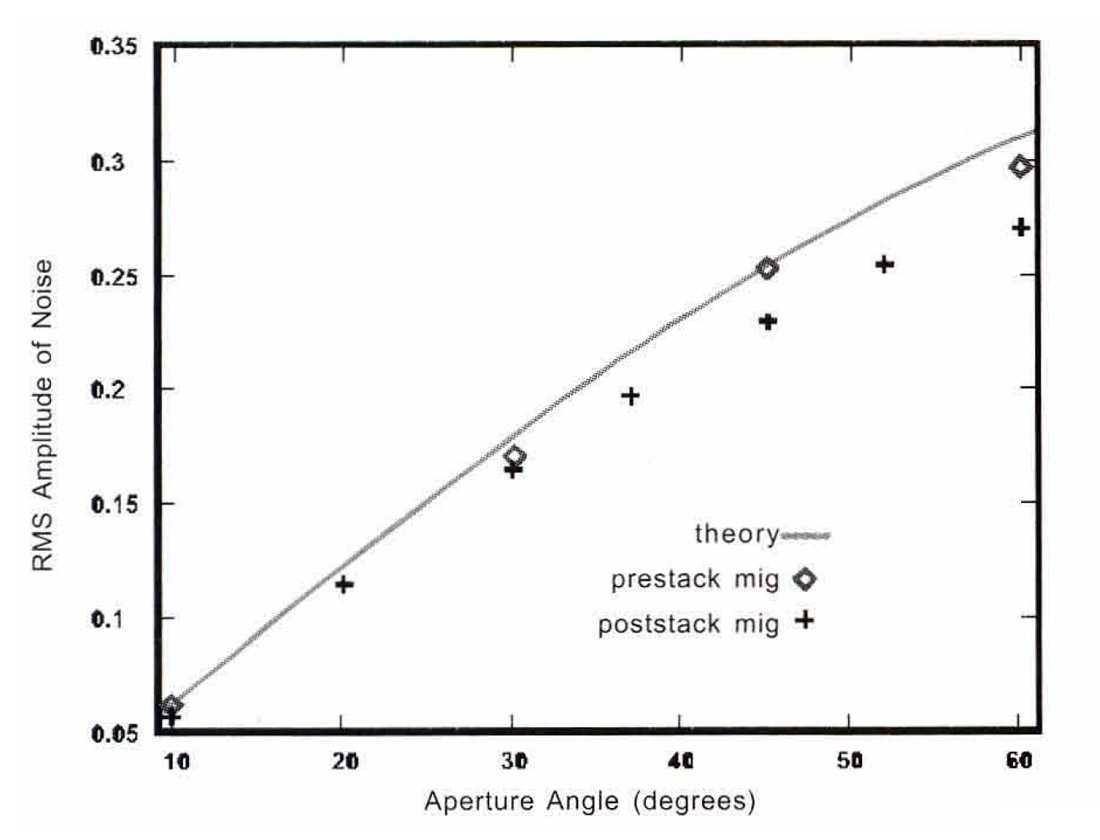
Krey (1987) implies that Kirchhoff prestack and poststack migration ought to have similar noise attenuation characteristics but he does not actually compare any prestack and poststack migrated output. Using noisy synthetic prestack data sets, we validate his claim by comparing the SIN enhancement characteristics for 3-D prestack and poststack Kirchhoff migration algorithms. Our earth model consists of a series of horizontal reflectors embedded in a constant velocity medium (v = 3000 m/s), and the additive random noise is Gaussian, zero mean, and uncorrelated from trace to trace. Figure 5 shows the RMS value of accumulated noise after 3-D Kirchhoff prestack and poststack time migration using several different migration apertures. For comparison purposes, the theoretical expression is also displayed in this plot. Note the similarity among the poststack, prestack and theoretical curves. Our tests confirm that the SIN after migration is approximately the same for both the prestack and poststack cases. Thus, it seems unlikely that noise attenuation characteristics could account for the improvement observed in some prestack migrated data sets.
Irregular Geometry
We have found that 3-D acquisition geometry can have a pronounced effect on Kirchhoff 3-D prestack time migration. In some parts of the data volume, irregular geometry can actually degrade the appearance of prestack migrated output. This is because the irregular spatial sampling of the input data prevents the proper interference of the prestack migration operators, as pointed out by Gardner and Canning (1994). In a Kirchhoff summation scheme, these operators should interfere constructively where reflectors are present in the subsurface and interfere destructively everywhere else. Imperfect operator cancellation can be conspicuous on prestack migrated sections at early traveltimes in the vicinity of the mute zone and also around the perimeter of the 3-D volume.
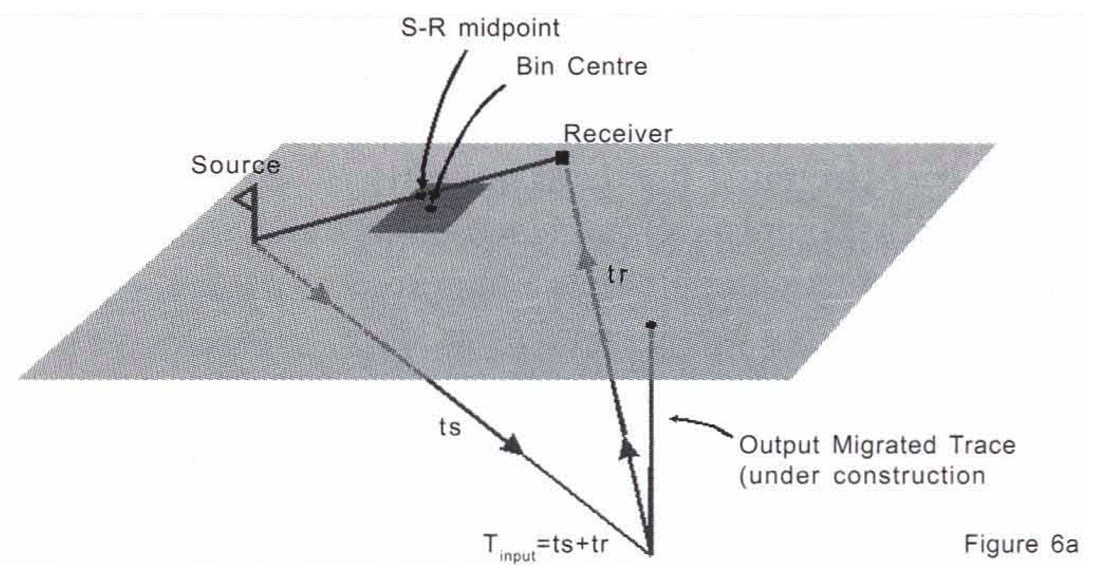
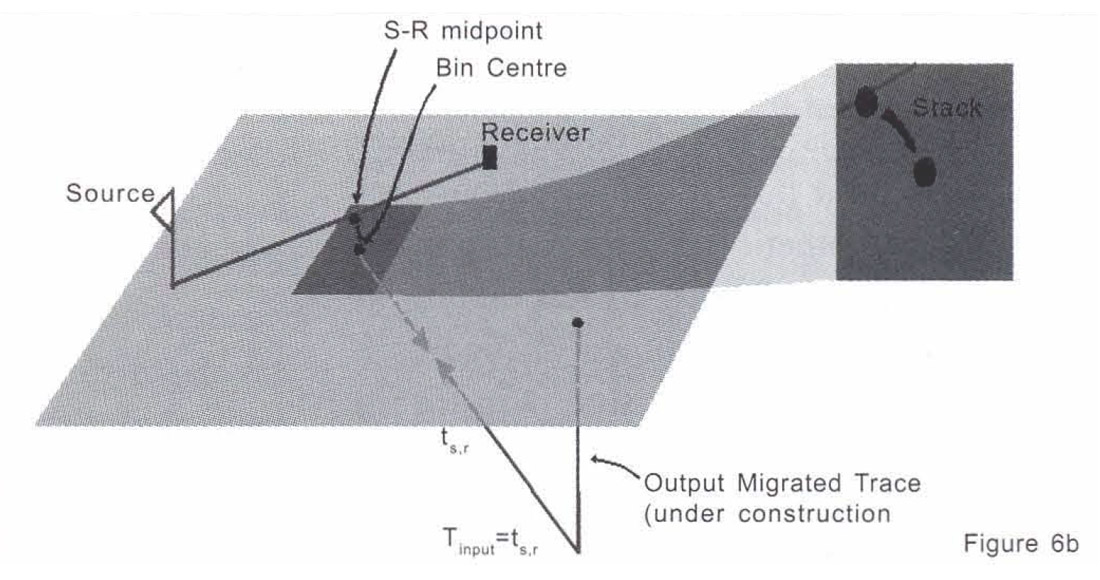
On the other hand, Kirchhoff prestack migration can produce higher quality images than poststack migration throughout the interior region of the data volume whenever the acquisition geometry gives rise to source-receiver midpoints that are not centred within the midpoint bins. The reason is quite simple: true source and receiver coordinates are used to compute travel times along the Kirchhoff prestack migration operator. By contrast, all poststack migration algorithms compute operator traveltimes based on bin centre coordinates since the input data have been subjected to the spatial smearing effects of the stack (Figure 6). The amount of blurring introduced by stacking increases with increased midpoint scatter, spatial frequency of geological structure and temporal frequency of the input wavelet.
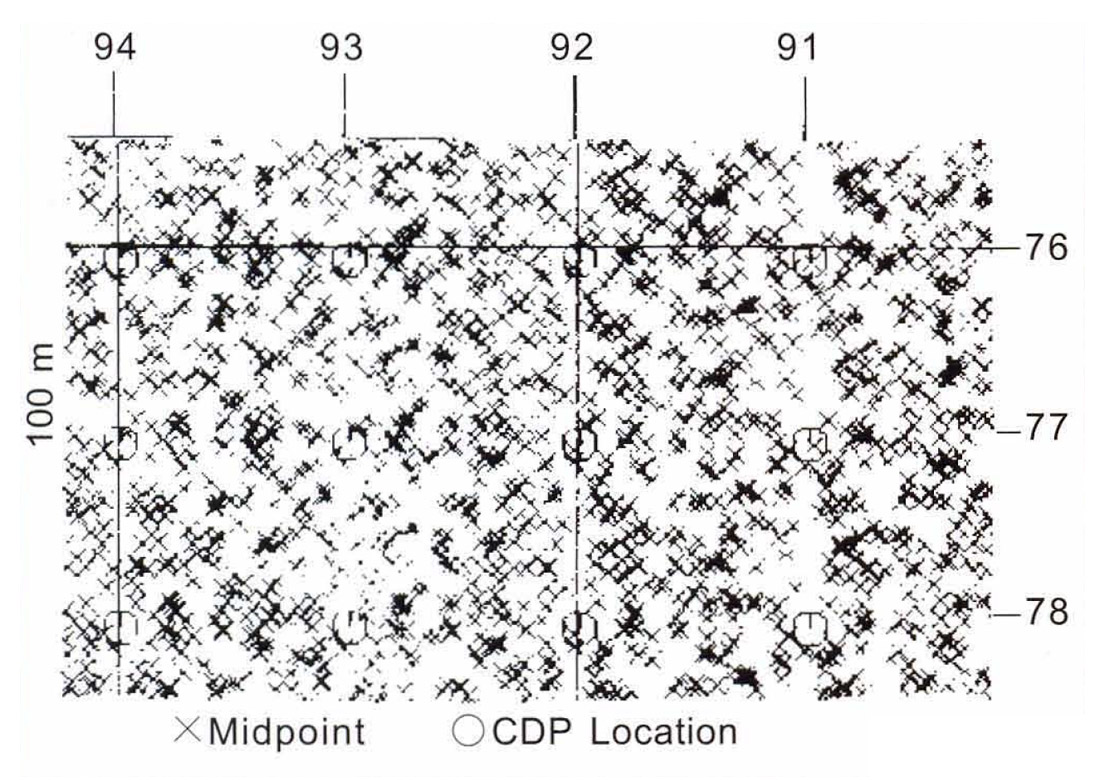
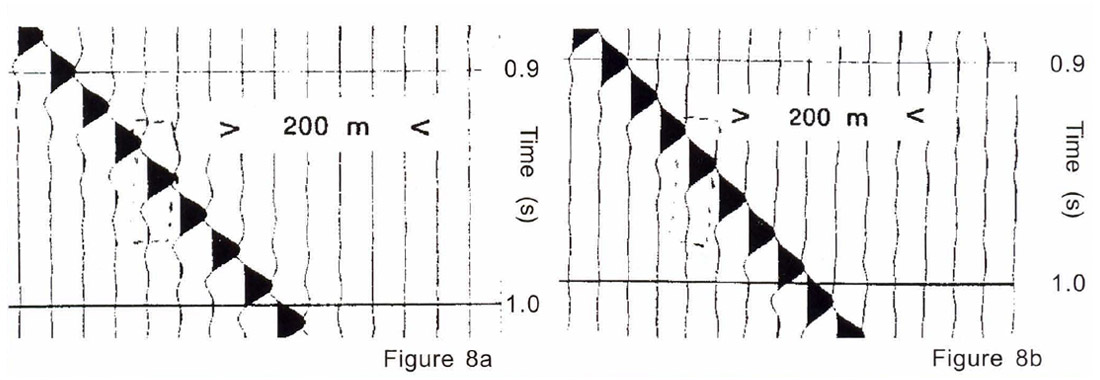
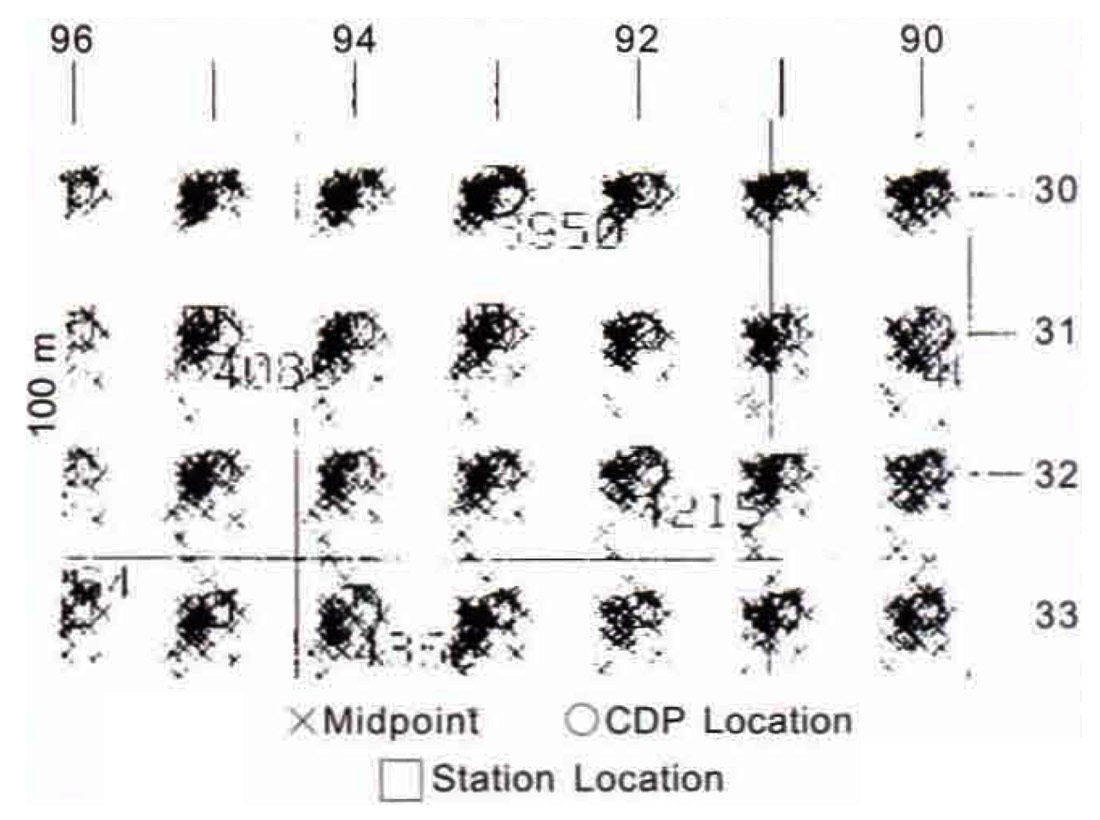
To study the effect of midpoint scatter on prestack and poststack migrations, we generated a synthetic prestack data volume using survey coordinates corresponding to the real data examples shown in Figures 1 and 2. The bin scatter plot (Figure 7) reveals significant midpoint scatter. The earth model consisted of a single uniform 30° dipping reflector embedded in a constant velocity medium (v=3000 m/s). Figure 8a shows the result of applying 3-D Kirchhoff prestack time migration to these synthetic data. Next, we stacked the data using v/(l-sin230 cos2θ)1/2, where θ is the shot-to-receiver azimuth. For constant amplitude reflections, this procedure simulates an exact DMO correction (since the dip and azimuth dependence of the stacking velocity has been removed) but it retains the smearing effect of NMO + stack in the presence of midpoint scatter. We did not actually apply DMO to the data because 3D DMO has its own problems in handling irregular geometry (Ronen, 1994) that could have confused our analysis. The resulting stack was then migrated using a Kirchhoff poststack algorithm (Figure 8b).
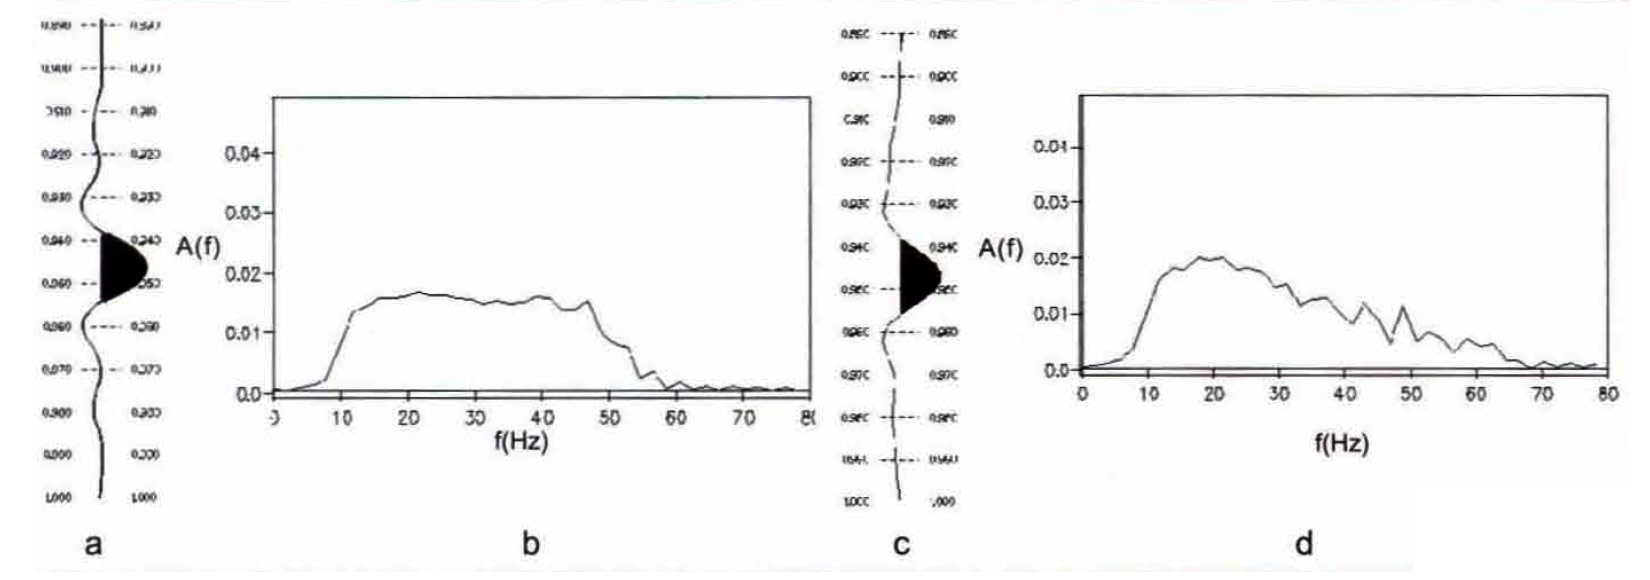
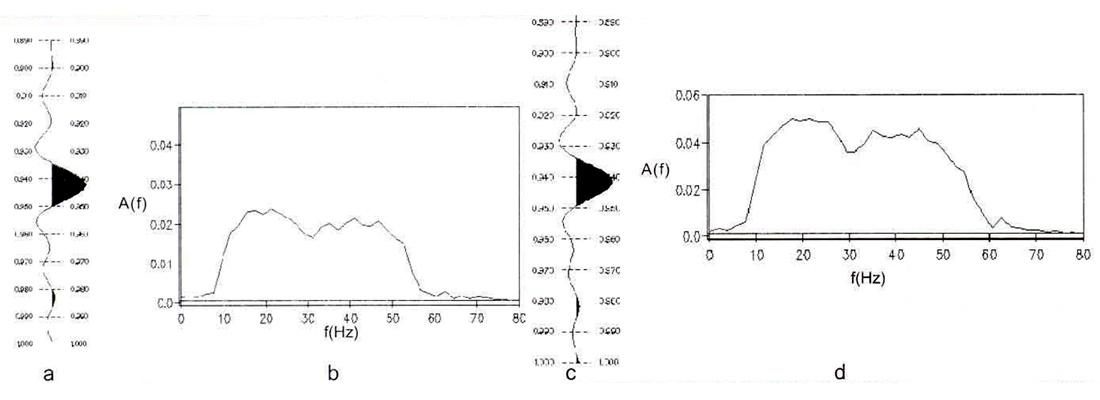
In order to compare the results from the two types of migration, we examine a single output wavelet from both sections. The wavelet after prestack migration is shown in the time domain in Figure 9a and in the frequency domain in Figure 9b. The corresponding displays for the posts tack migration are shown in Figures 9c and 9d. By comparing the time-domain displays (Figures 9a and 9c) a distinct difference in the nature of the side lobes between the two wavelets can be seen. The wavelet after prestack migration has "ringy" side lobes which are similar to those on the input wavelet (not shown here). The input wavelet was constructed in the frequency domain using a 0/5-64/70 Hz trapezoidal filter. On the other hand the wavelet after poststack migration reveals a single long-period negative side lobe on either side of the central peak, suggesting that some wavelet distortion has occurred. Also, the main peak of the wavelet after pres tack migration is narrower than its counterpart after poststack migration ( -14 ms vs. -16 ms). This observation reveals that the signal has become smeared under the action of stacking. The loss of high frequency content in the wavelet after poststack migration shows up clearly in a comparison of the amplitude spectra (Figures 9b and 9d).
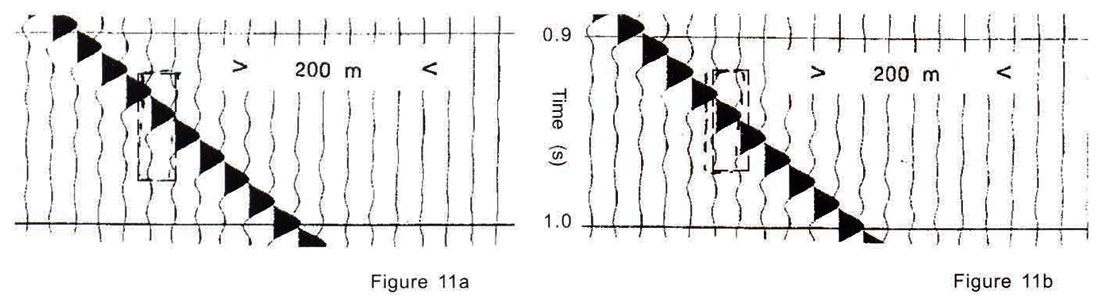
As a control case, we generated another synthetic prestack data set using the same earth model, but this time we chose a real survey geometry that displayed very little midpoint scatter (Figure 10). This geometry corresponds to the real data examples shown in Figures 3 and 4, where very little difference was observed between pres tack migration and NMO + DMO + stack + poststack migration. The results of performing prestack migration and dip- and azimuth-dependent stack plus poststack migration are shown in Figures 11a and 11 b, respectively. Careful inspection of the wavelet after prestack migration (Figures 12a, 12b) and the wavelet after poststack migration (Figures 12c, 12d) reveals very little difference in output wavelet character. These tests indicate that the smearing effect associated with the stacking of non-coincident midpoints can significantly degrade the quality of the image after poststack migration. This problem can be overcome by avoiding the stacking process through use of Kirchhoff prestack migration.
Midpoint Scatter Effect Vs DMO Effect
The fact that we did not apply DMO prior to stacking and poststack migration in our synthetic tests may raise the question of whether improvements observed in the real data examples arise because pres tack migration is doing a better job of accounting for the midpoint scatter, or because it is providing a better dip moveout correction than conventional DMO. As we stated in the previous section, DMO algorithms, like prestack migration, may encounter difficulties in handling irregular geometry. Irregular offset and azimuth distributions and midpoint scatter can cause imperfect cancellation of the DMO operator. In addition, 3-D DMO computes a 2-D operator which, in general, does not pass through the bin centres. Another possible source of error is the constant velocity assumption used in most DMO algorithms.
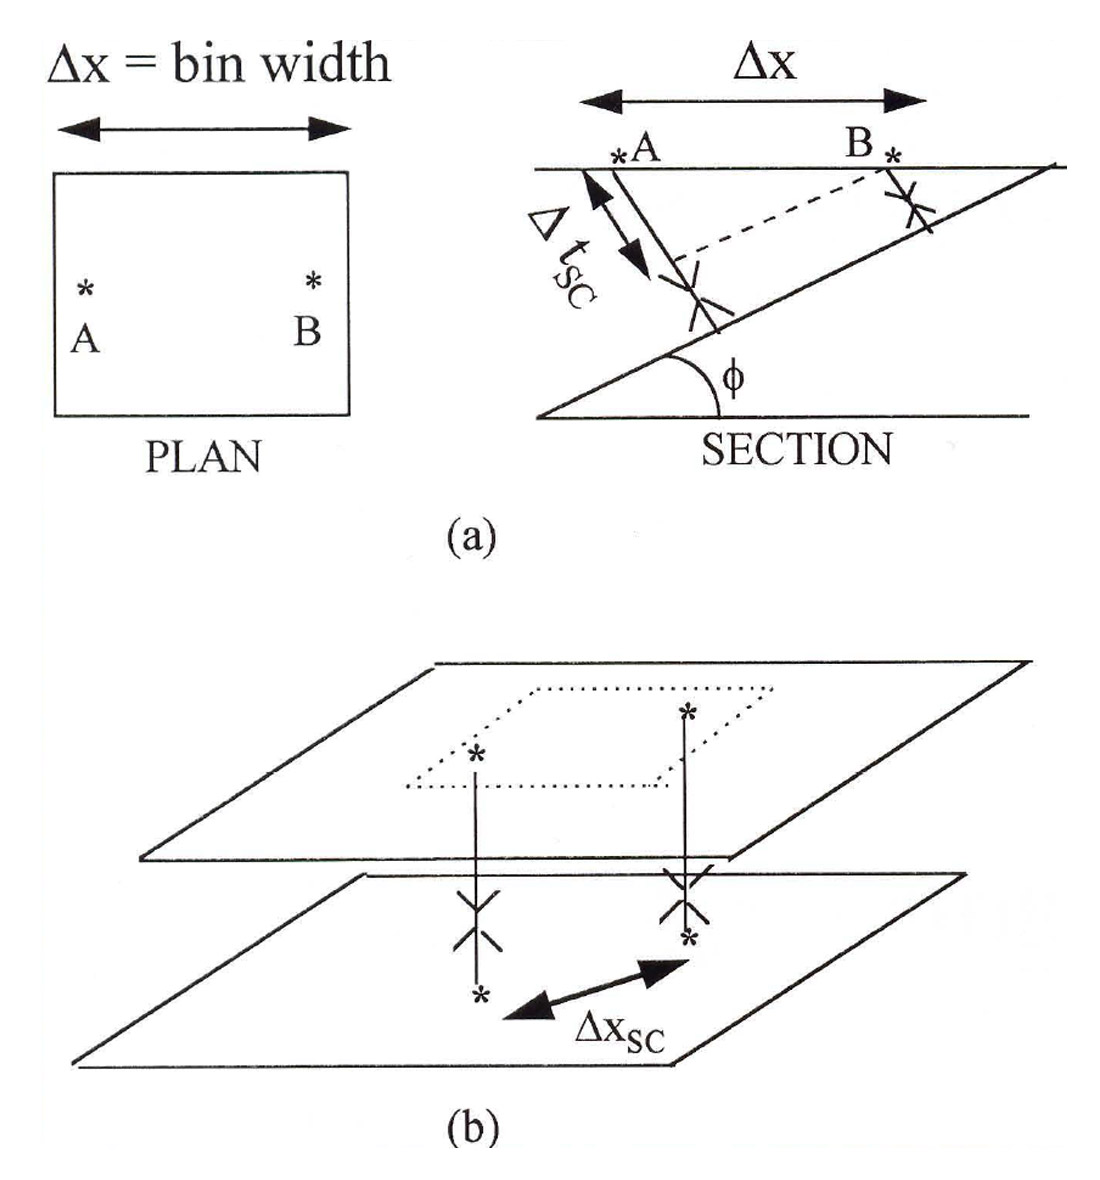
In order to compare the sizes of the midpoint scatter effect and the DMO correction, we perform an analysis of the errors involved. First, we note that midpoint scatter gives rise to both a traveltime error and a lateral mispositioning of energy. The traveltime error is caused by the stacking of traces containing energy from a dipping reflector (Fig. 13a). This type of error accounts for the degradation in the appearance of the synthetic wavelet in Figures 9c and 9d. From Figure 13a, the size of the travel time error is given by Δtsc=(2Δ xsin ɸ)/v, The lateral mispositioning error can be thought of as the limitation on lateral resolution imposed by the stacking of trace~ with non-coincident midpoints, as illustrated in Figure 13b. From the figure, a representative size for this error is on the order of a bin width, say Δtxsc = 40 m.
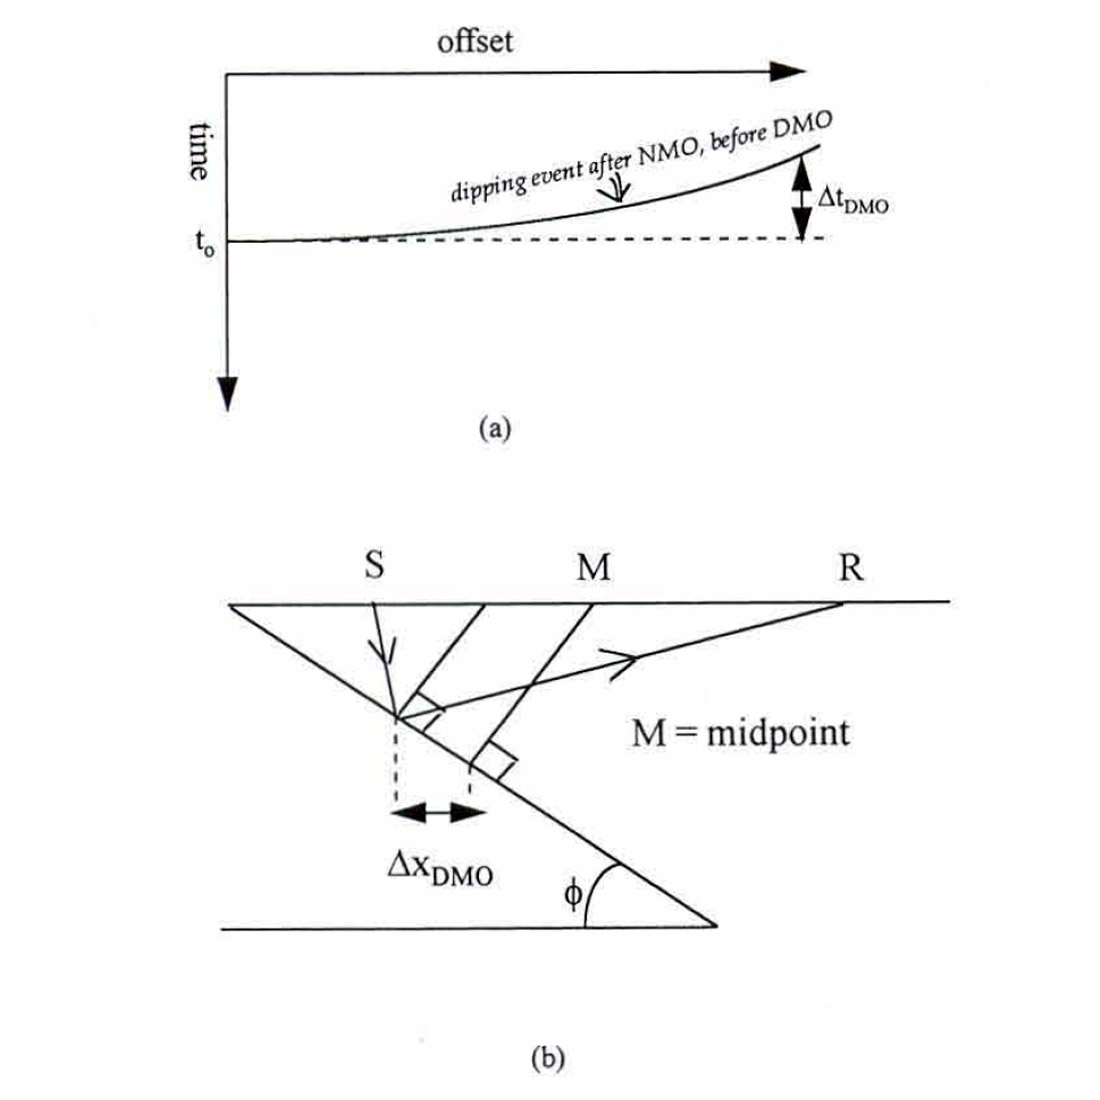
Similarly, the DMO effect can be viewed in terms of both a traveltime correction and a lateral repositioning of energy, The traveltime correction arises from performing NMO using the dip-dependent velocity vNMO = v/cosɸ, where ɸ is the dip, and is equal to the difference between NMO-corrected time using velocity v and the zero-offset reflection time to (Fig. 14a):
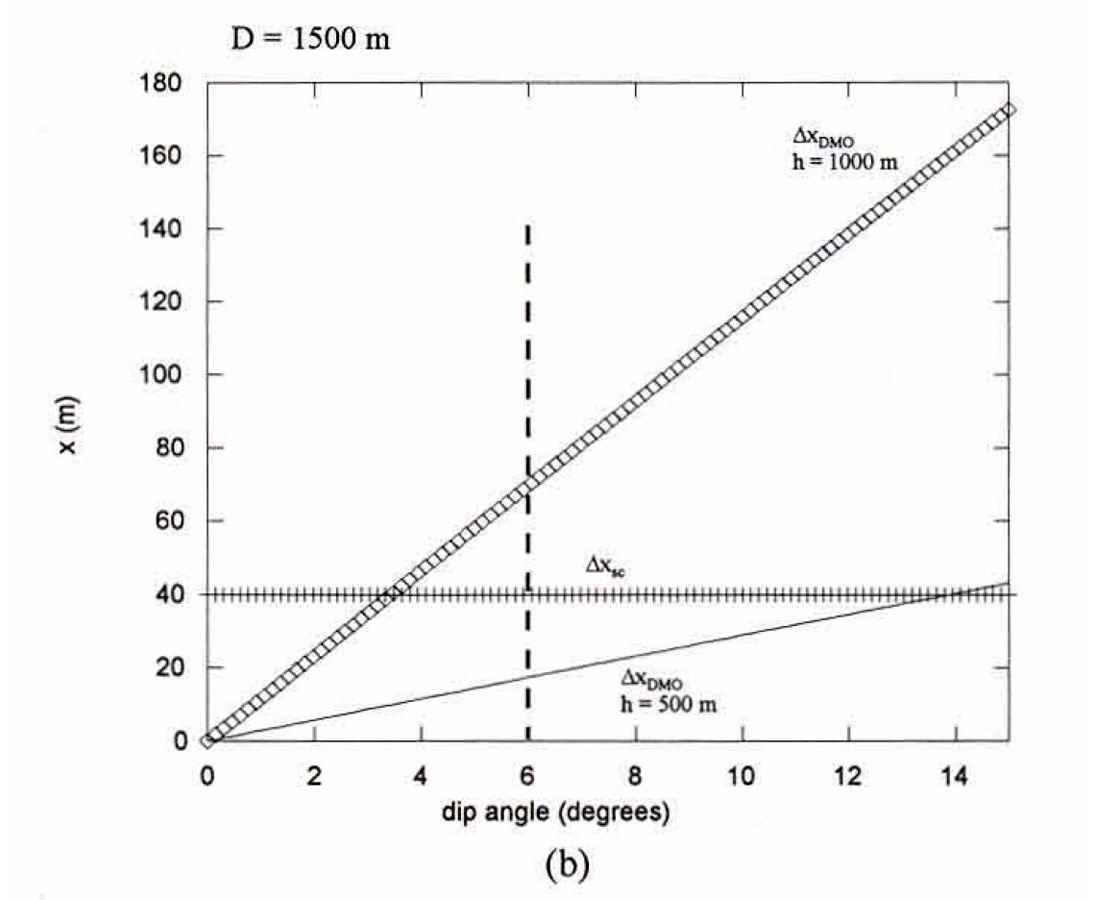
ΔtDMO =t0 - (t02 - (4 h2 sin2 ɸ )/v2)1/2 where h is the half-offset. The lateral repositioning correction is due to the elimination of reflection point smear by DMO and is given by ΔxDMO =(h2 sin2ɸ)/D, where D is the perpendicular distance between reflector and source-receiver midpoint (Fig. 14b).
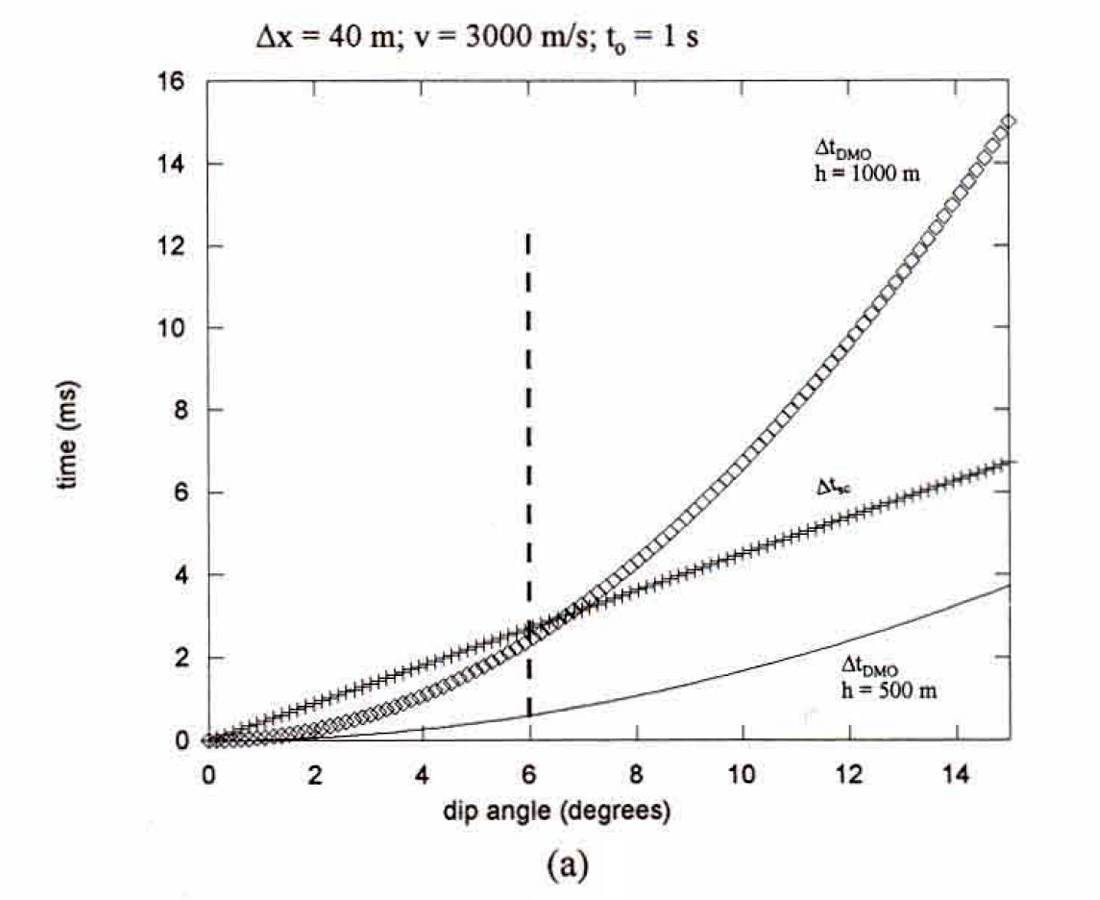
The traveltime effects Δtsc and ΔtDMO are plotted as a function of dip angle using representative values for h, v, Δx and t0 in Figure 15a. The lateral repositioning effects Δxsc and ΔxDMO are also displayed as a function of dip angle using D = 1500m (Fig. 15b). These plots reveal that for the shallow dips typically present in plains-style geological settings (ɸ < 6°), the error introduced by midpoint scatter is more significant than the DMO correction. Therefore, improvements observed after pres tack migration of plains-styIe data sets are likely due to midpoint scatter effects and not to any shortcomings that might be associated with the DMO algorithm used in the poststack migration processing flow.
Discussion
We believe that this research provides convincing evidence that midpoint scatter introduces noticeable smearing in the final migrated image when a conventional processing flow is used. Midpoint scatter gives rise to image distortion on poststack migrated sections so that the high frequency components of structure are poorly resolved, regardless of whether the regional geological setting is simple or complex. It is precisely such short wavelength information that may be of great interest to the interpreter, especially with Canadian plains data. Fortunately, the problem introduced by stacking can be overcome through the use of a prestack migration algorithm which honours true source and receiver locations in its operator traveltime computation.
Our findings have implications for 3-D survey design. Because of economic constraints, it is usually desirable to try to obtain a sufficiently high quality of final image with as little data being acquired as possible. It may be tempting to purposely design 3-D surveys with low fold, and assume that prestack migration will provide the desired image quality that poststack migration would provide with a higher fold survey. However, we have found that for Canadian plains data, prestack migration only produces improvements when there is significant midpoint scatter. The logical conclusion from this finding is either that 3D pres tack migration should be used to process data when midpoint scatter is significant, or alternatively, that 3-D surveys should be designed to avoid midpoint scatter so that prestack migration is unnecessary. Often, some degree of midpoint scatter on land 3-D surveys is unavoidable, so that the best choice may be to save money on the acquisition side by shooting a smaller quantity of data, but to spend more on processing by doing prestack migration. It cannot be forgotten, however, that other processes (such as statics) require a certain minimum amount of data to work effectively. As usual, the final decision will be a balance among budget constraints, the desired quality of the final product, and difficulties encountered during field acquisition.
It is important to note that while Kirchhoff prestack migration honours true source and receiver coordinates, many other pres tack migration schemes do not. For example, any prestack migration algorithms which require binning of the input data into limited offset sections prior to migration, such as FK or finite difference methods, introduce some error into the operator traveltime computation. Although the magnitude of the error caused by such binning processes may be insignificant for the purposes of many prestack migration applications (e.g., velocity analysis, handling steep dips in complex velocity regimes where DMO fails), it can be as large as the error that is caused by full-offset stacking in the presence of midpoint scatter.
Finally, it is worth pointing out that Kirchhoff migration does not provide a perfect solution to the problems of irregular geometry, even in the interior of the data volume. This is because Kirchhoff migration, which is essentially a summation over available data traces, is an approximation to the theoretically rigourous Kirchhoff integral solution, which involves integration over the acquisition surface. Our results simply show that, within the interior of the 3-D data set, prestack migration can provide a better approximation to this integral than NMO + DMO + stack + poststack migration. Further work is required to determine more quantitative relationships among fold, midpoint scatter and final image quality.
Summary
We have investigated the perplexing question of why 3-D prestack time migration works well in areas of flat-lying geology for some data sets, but offers little, if any, improvement for other data sets. Our synthetic tests indicate that Kirchhoff prestack and poststack migrations exhibit similar SIN enhancement characteristics but that the prestack algorithm does a better job of handling midpoint scatter. Improvements observed after prestack migration of structurally simple data sets are attributable to midpoint scatter effects, and not to the possibility that the prestack migration is performing a better dip moveout correction than conventional DMO. Many pres tack migration algorithms, such as those requiring offset-based binning of the input data prior to migration, cannot properly account for the traveltime error caused by midpoint scatter. Despite its added cost, Kirchhoff prestack time migration can be a very valuable processing tool, even for Canadian plains-style data sets, whenever the zone of interest has short wavelength features and the midpoints are scattered.

Acknowledgements
We are grateful to HPC High Performance Computing Centre, Calgary, for providing the hardware platform for the bulk of this research. Prestack migrations were run on a Fujitsu VPX240/10 vector supercomputer. We would also like to thank Wainoco Oil Corporation of Canada and Petro-Canada Resources for supplying the coordinates for the 3-D surveys and for granting us permission to show their data.


Join the Conversation
Interested in starting, or contributing to a conversation about an article or issue of the RECORDER? Join our CSEG LinkedIn Group.
Share This Article