Abstract
2-D resistivity surveying is a technique that has taken advantage of solid state relays and modern inversion techniques to make an evolutionary leap from 1-D resistivity soundings, a survey method that has changed little after almost 90 years of practice. 2-D resistivity exploration has been used extensively for exploration in the oil sands and, more recently, for very shallow gas exploration (less than 400 m below ground surface). While much of present day exploration for new oil and gas resources involves investigating deeper and in more remote locations, another far less expensive and greatly overlooked play concept exists in reservoirs stranded behind casing. For most of these potential zones, even minimal geophysical logging data do not exist. 2-D electrical resistivity surveying provides explorationists a second chance to definitively, and in a cost-effective fashion, explore for "ultra" shallow oil and gas resources in the upper 400 m.
Introduction
For the last seven years we, at Komex, have been routinely and successfully applying geoelectric techniques in the exploration and direct detection of oil sands and, more recently, gas charged fluvial channels nested in the Quaternary buried valleys of Alberta. Nevertheless, our successes have been born out of years of personal scepticism based on experience. From 1981 to 1985, as a wireline field engineer and base manager for Schlumberger in Borneo and Papua New Guinea, I ran hundreds of logs in the fresh connate water reservoirs of the Mahakam and Sembakung Deltas, and other highly productive oil fields in extreme precipitation equatorial areas. Even with the latest prototype models of electromagnetic propagation tools and every induction and resistivity tool available in Schlumberger’s arsenal, the question of whether an interval was oil or fresh water often could only be resolved after wireline formation sampling. At the time, it was clear to me that if one million dollars of geophysical instrumentation could not distinguish oil from water in the borehole when the formation fluid was millimetres from the sensors, direct detection of hydrocarbon from surface was impossible.
My scepticism seemed to be confirmed at the University of Waterloo where I worked on the application of geophysical methods to the direct detection of dense non-aqueous phase liquids, or DNAPLs. These non-polar organic fluids are common in dry cleaning, wood preservation, asphalt operations, and other previously considered innocuous activities. From an electrical properties perspective, DNAPLs closely resemble hydrocarbons. In our attempts to directly detect pure phase DNAPLs in groundwater, myself and subsequent researchers (Brewster et. al., 1994) carried out surveys with a wide range of electrical and electromagnetic techniques and instruments including ground penetrating radar, galvanic resistivity, self potential, complex resistivity, capacitively coupled resistivity, and electromagnetic induction systems. While some success was achieved in controlled spills with time lapse surveys, no technique emerged as being practicably useful in real world industrial spill situations. My experience in Alberta of carrying out hundreds of induction and resistivity surveys at contaminated oil and gas sites has further confirmed that while salts, and even trace metals, are viable targets, the hope of reliable and routine direct detection of hydrocarbons from surface is illusory.
Yet, despite intuition to the contrary, there are a number of types of very economic oil and gas plays for which geoelectric techniques for direct detection have been successful, and continue to be used. In Alberta, two examples of plays of note are the Athabasca oil sands, and the gas charged Quaternary channels of northwestern Alberta. While unusual, these plays are not unique. The characteristics that have made these plays particularly amenable to geoelectric exploration include their shallow occurrence, their significant thickness relative to their depth, and their very high resistivity contrast with the host geology.
2-D Resistivity
Historically, a number of geoelectric techniques for direct detection of hydrocarbons have been tried in Alberta with varying degrees of success. These include 1-D time domain electromagnetic surveys, 1-D resistivity surveys, airborne fixed frequency and time domain surveys, and magnetotelluric surveys. 2-D resistivity, also known as electrical resistivity tomography (ERT) or electrical resistivity imaging, is the most recent entry into shallow, non-seismic exploration programs. This author believes this technique to be the most successful of the various electrical techniques in terms of providing high confidence interpretations as well as a cost-effective approach given the geology and logistics usually encountered in Alberta.
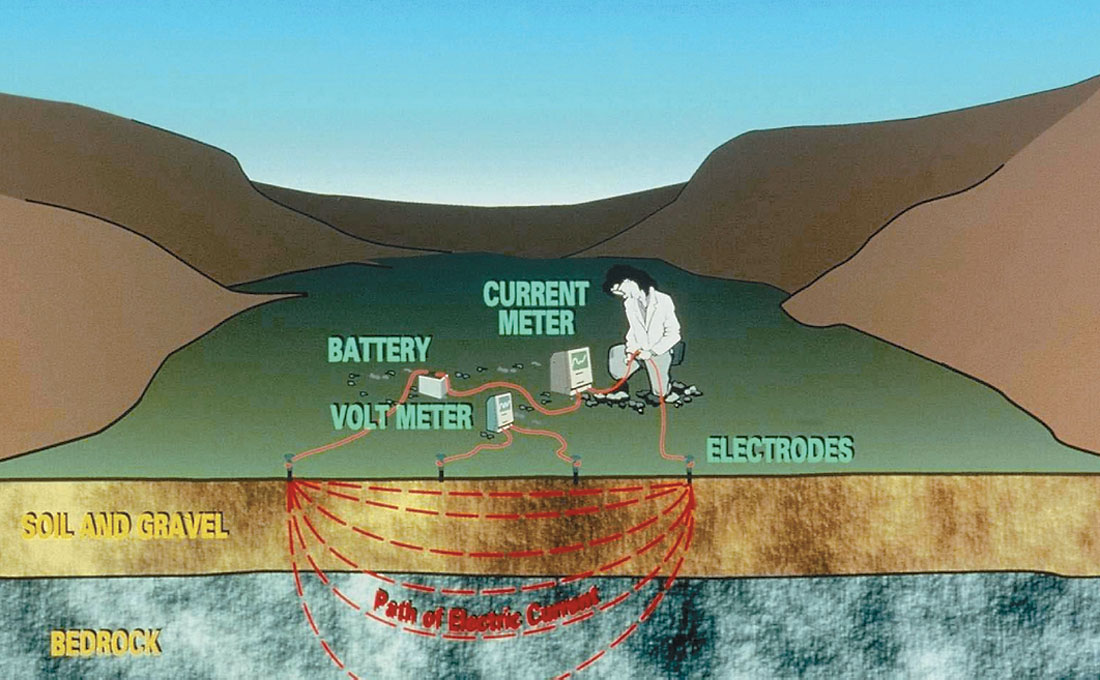
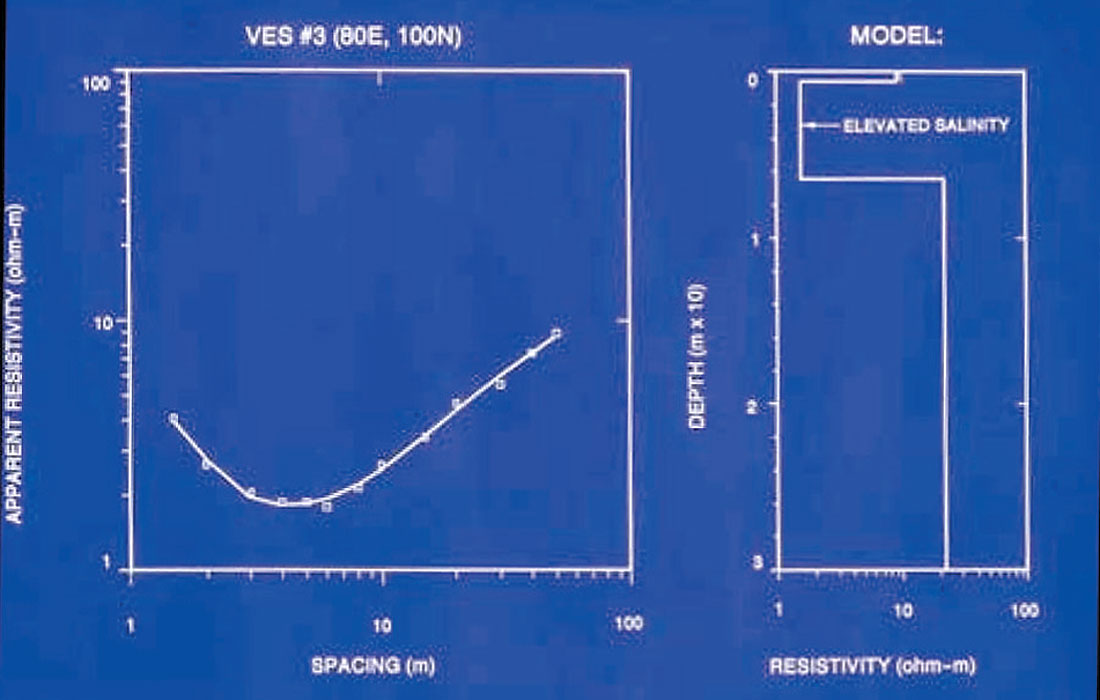
The physics of 2-D resistivity are no different than those of 1-D resistivity as initially investigated by Conrad Schlumberger in France and Frank Wenner in the United States in 1917 and 1918 (Burger, 1992). A known direct current (DC) moves in the subsurface from one electrode to an electrode return at some measured distance away (Figure 1). Two potential electrodes measure the potential drop, that is, the force needed for the current to overcome the resistance of the subsurface earth materials. We know the current we put into the subsurface, we measure a voltage, and with Ohm’s Law, we then calculate a resistance (voltage divided by current). Given the geometry of our four electrode array, we can calculate an apparent resistivity of the subsurface. By changing the geometry of the electrodes, we measure an apparent resistivity at a different depth in the earth. The principles of electrical soundings were established in the 1920’s; interpretation by using two and three layer master curve matching was developed in the 1930’s (Dahlin, 2000). As an undergraduate in the 1970’s, I interpreted the log-log sounding curves of 1-D resistivity surveys with overlays from books of type curves. As a graduate student in the 1980’s I used computer generated curves and 1-D inversion software to more conveniently produce better fits (Figure 2). The problems, though, remained. The interpretation of any single 1-D resistivity sounding (or time domain sounding) is inherently non-unique, with infinite unconstrained models providing a solution to the curve fit. And of course, the solutions by definition assume a 1-D layered model.
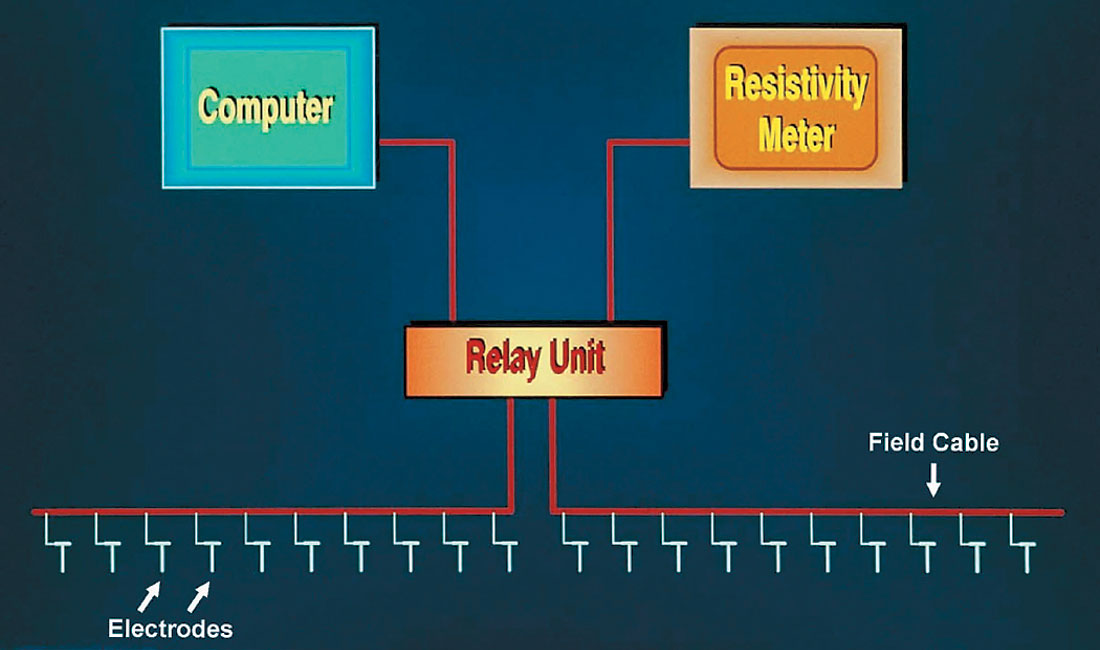
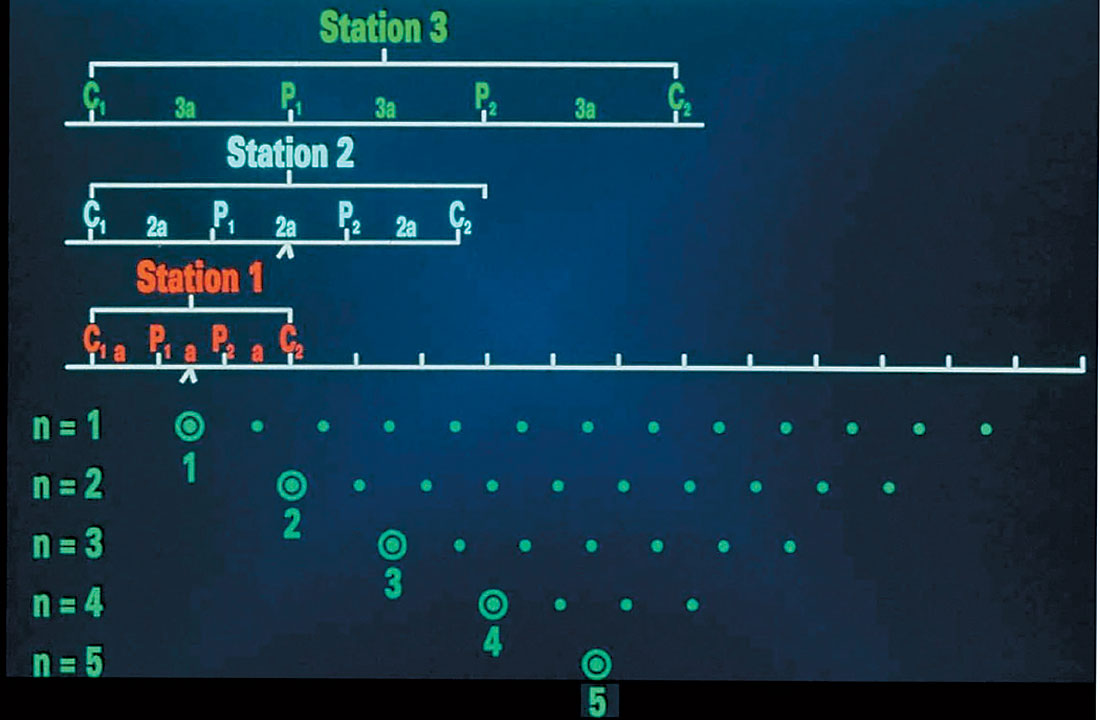
Instead of four electrodes, a 2-D resistivity array can be constructed of any number of electrodes, though in practice this typically ranges from 42 to 256. The electrodes must be colinear and evenly spaced, though 3-D (Loke and Barker, 1996a; Tsourlos and Ogilvy, 1999; Li and Oldenburg, 2000; Bentley and Gharibi, 2004), borehole to borehole, and borehole to surface arrays are also possible (Ramirez et. al., 1993; LaBrecque et. al., 1996). While any one measurement still involves two current and two voltage measurements, all possible quartets of electrodes can be addressed by the transmitter/receiver via a patchbox filled with solid state relays, similar to your local neighbourhood telephone routing centre (Figure 3). Which electrodes are addressed, and when, is determined by software commands laid out by the geophysicist as governed by the objectives of the exploration program (how deep, flat lying or vertical structures, etc.). All electrodes are connected to the electronics via one of several types of multicore cable. The survey proceeds in an automated fashion while the field crew picks up cable from behind and rolls out cable ahead in a fashion very analogous to seismic surveys. With present day transmitters and receivers, up to 8 voltage measurements can be made simultaneously, with a single measurement requiring as little as a fraction of a second. In practice, for surveys requiring depths of investigation of 200 to 400 m below ground surface (bgs), about 1,000 voltages (and apparent resistivities) are measured in an hour. From 2.5 to 6 km of data can be acquired on a daily basis, depending on the active spread lengths being used. Stacking, signal discrimination, and other quality control measures are carried out to ensure the recording of reliable data. The product of a survey is hundreds or thousands of apparent resistivity measurements at various depths beneath the entire length of the electrode array, or what is known as a resistivity pseudosection (Figure 4).
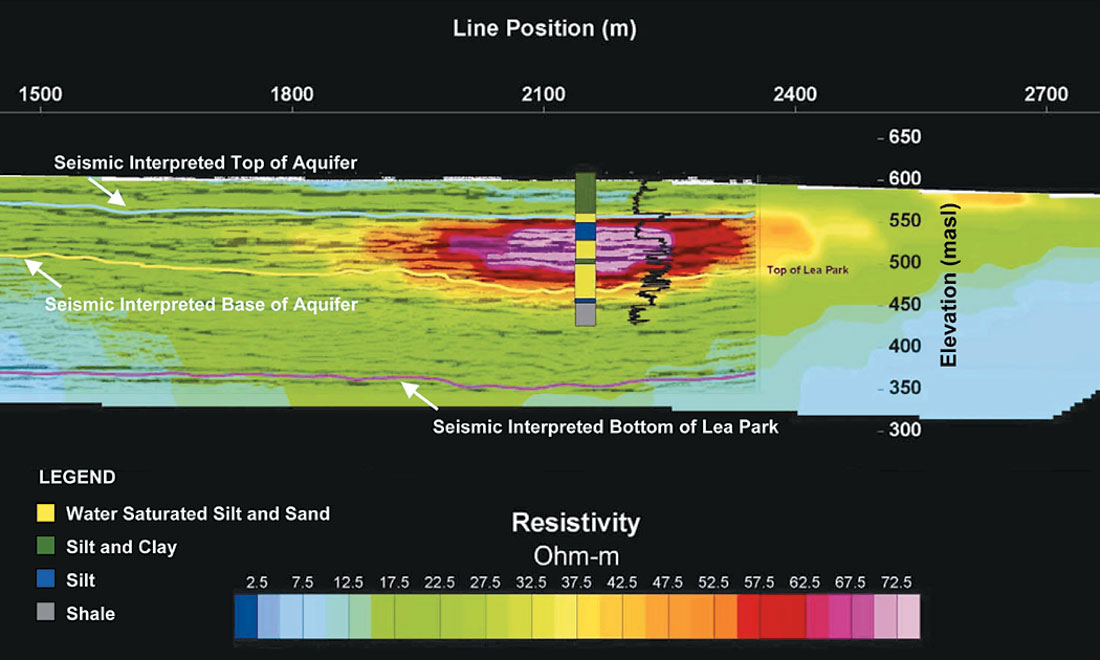
The 2-D survey described in the previous paragraph could have been acquired without modern solid state relays and with single wires dedicated to each electrode, so perhaps a better description of this approach is "automated" 2-D resistivity surveying, for it is the automation of electrode selection that allows this type of survey to be cost-effective. Regardless of the number of data points and speed with which they are acquired, without numerical modelling one is left with a pseudosection of apparent resistivities plotted at somewhat arbitrary depths. Numerical modelling techniques developed in the early 1990’s (Oldenburg and Li, 1994; Loke and Barker, 1996b) now allow one to invert large pseudosections consisting of several thousand field measured apparent resistivities into "true" geoelectric sections in a few hours. The size of the model blocks, and hence the resolution of the technique, is limited by current spreading and practical limitations on how much data can be acquired. While the size of the model blocks dictates that 2-D resistivity results may never approach the vertical resolution of a seismic reflection survey, the ability to invert for true resistivities means that in certain geologic contexts, the pore fluids of fresh water, salt water, oil, and gas can each be distinguished (Figure 5).
2-D Resistivity Exploration in the Athabasca Oil Sands Deposits
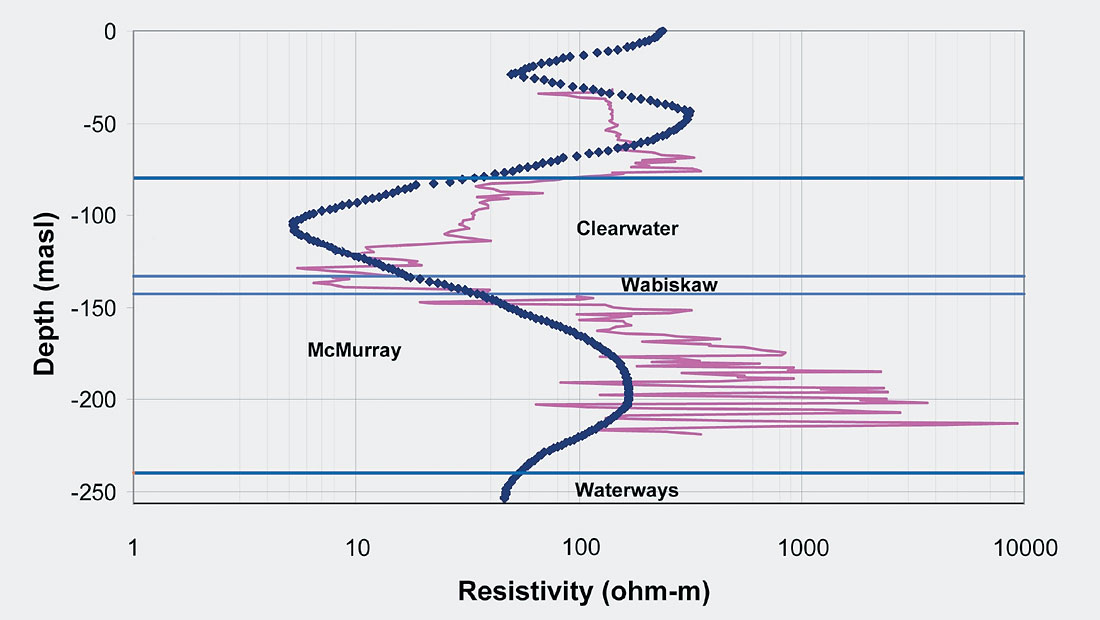
Figure 6 is a typical resistivity log through the main units in the Athabasca oil sands. The McMurray Formation bitumen saturated sand is not homogeneous; nevertheless, resistivities generally exceed 200 ohm-m. In the overlying marine shales of the Clearwater Formation, resistivities are less than 30 ohm-m. In the calcareous marls of the Waterways Formation which underlies the McMurray sand, resistivities are less than 20 ohm-m.
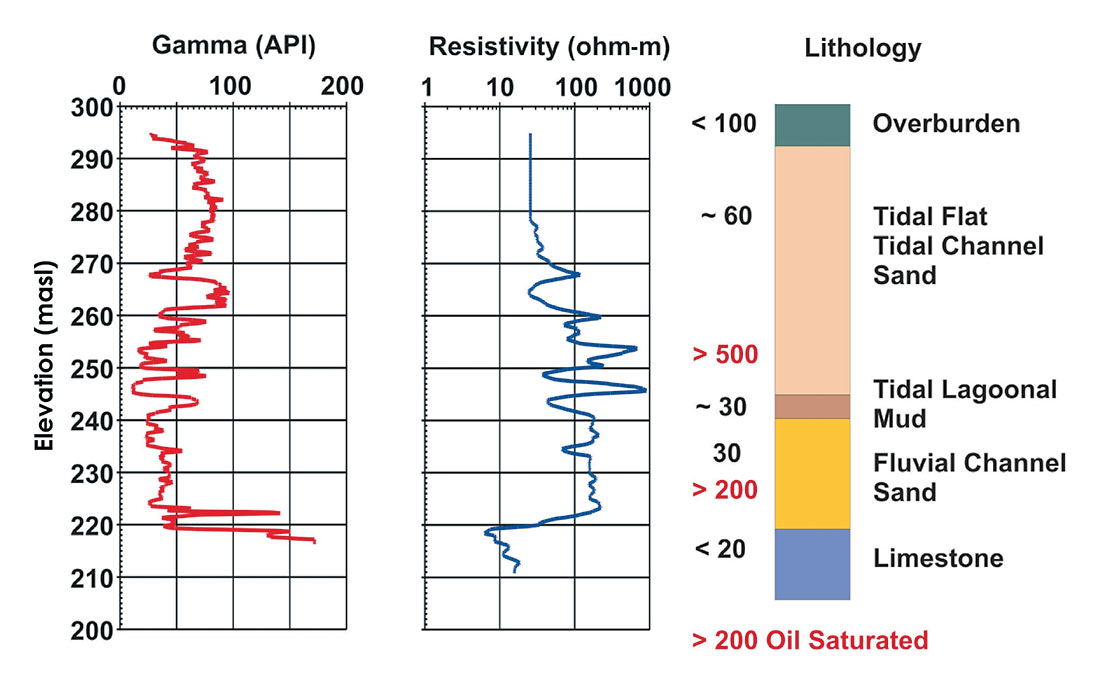
Figure 7 shows a one kilometer geoelectric section across a mineable ore (oil sand) body. Mineable bitumen bodies appear as targets with resistivities exceeding 300 ohm-m, and even exceeding 500 ohm-m. To the west, the McMurray sand is sandwiched between conductive Clearwater shale above, and conductive Devonian marls below. Small resistive targets at or very near surface are Quaternary gravels associated with small creeks or till. The explanation of why the indicated wells did not target the highest grade ore zones is that they were drilled before the geophysical survey.
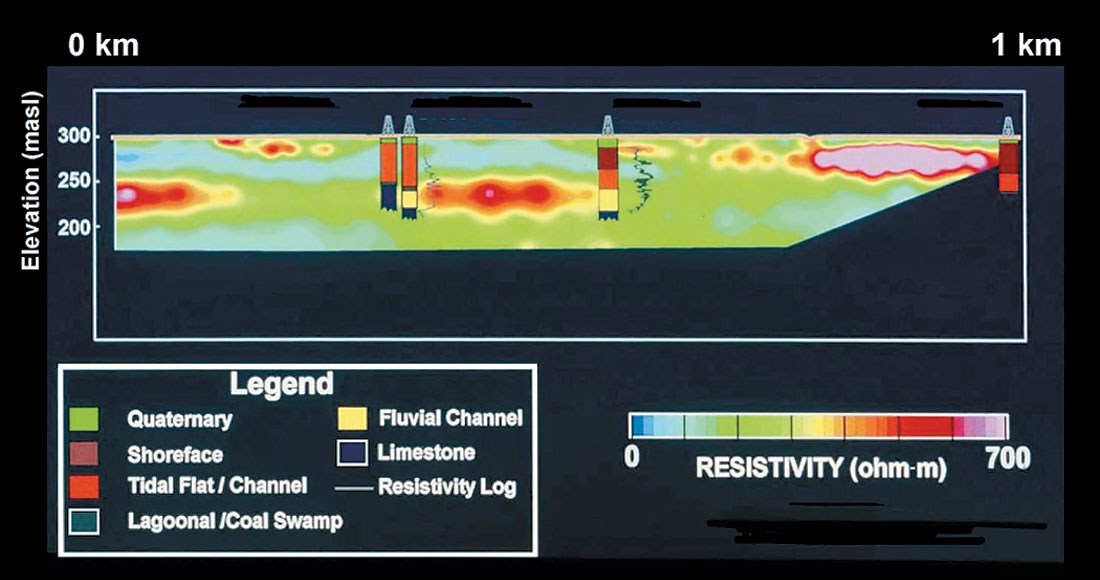
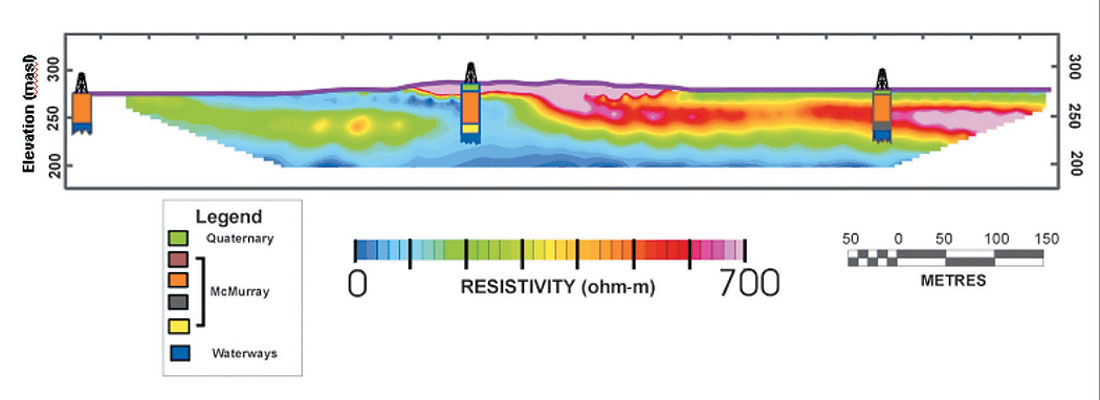
Figure 8 shows a second geoelectric section across a high grade bitumen zone in the eastern portion. Resistivities exceed 500 ohmm. The centre of the section traverses a partially water saturated esker where resistivities also exceed 500 ohm-m. As in any exploration scenario, geoelectric anomalies must be placed in their proper geological context using whatever information is at hand - surficial geological maps, aerial photographs, drilling information, etc. - and subsequently tested by drilling.
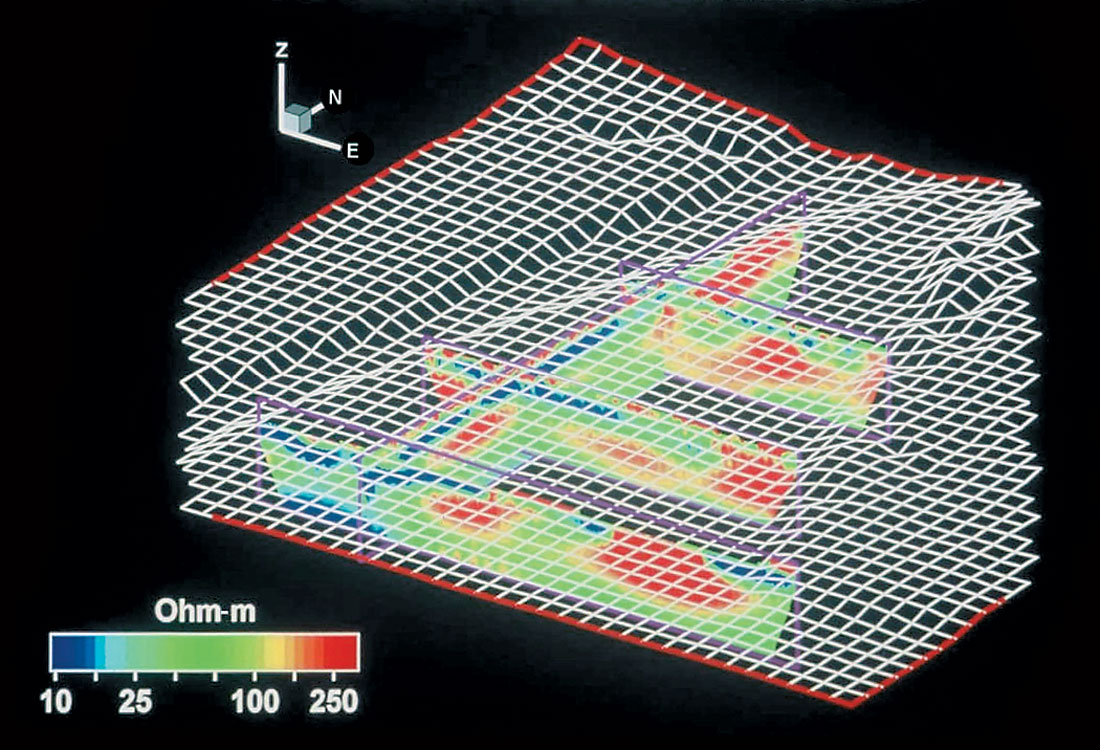
Looking at a larger scale, Figure 9 shows about 40 km of geoelectric sections assembled into a fence diagram in order to provide a broad view of the spatial relationship of a number of bitumen saturated channels. Figure 10, showing a 1-D resistivity curve extracted from a 2-D section and overlaid by an electric log, demonstrates that although a downhole log has far greater detail than the 2-D surface data, the 2-D resistivity survey faithfully identifies the contacts and true bulk resistivities of the imaged lithologies.
2-D Resistivity Exploration for Gas Charged Quaternary Channels
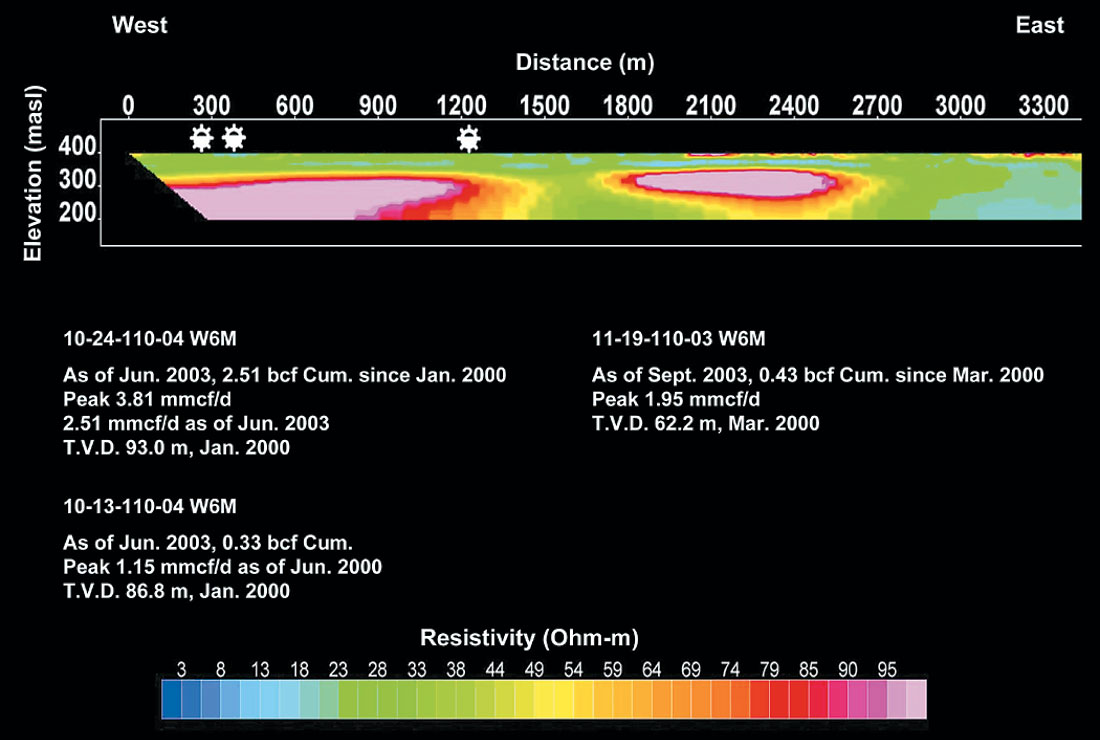
2-D resistivity surveying has been used routinely and successfully in the exploration for unusually shallow gas reservoirs in northwestern, central, and eastern Alberta. Typically, as with the Sousa and Rainbow fields near High Level, the reservoirs are at less than 100 m depth, and consist of gas charged Quaternary channels (Canadian Discovery Digest, 2001). The channels are incised and stacked within broader buried valleys (Pawlowicz et al., 2004) that are often recognized in seismic reflection data or airborne geophysical surveys. These gas-charged reservoirs are particularly easy to identify in northwestern Alberta, where bedrock is ubiquitously of marine origin - there are no coals or extensive freshwater bedrock aquifers that could also potentially be imaged as highly resistive anomalies. To date, approximately 15 bcf of gas have been produced from these shallow targets west of High Level.
Figure 11 shows two gas charged zones each displaying resistivities exceeding 100 ohm-m. The reservoir to the west is straddled by three gas producing wells with total depths ranging from 62 to 93 m bgs. The Shaftesbury shale defining the bottom and sides of the buried valley can be seen subcropping in the east. The electrically conductive overburden trap, though thin, is well defined above the reservoir. Depths to the tops of the reservoirs, as well as the lateral boundaries of the reservoirs, are generally very precisely and accurately defined. The bottoms of the reservoirs are often overestimated due to the strong resistivity contrast with the shales below, and subsequent "contamination" of the deeper and larger numerical model blocks at depth.
While unusual, these gas charged Quaternary channels in the Sousa and Rainbow fields are not unique in Alberta, nor unique to Alberta. Similar channels have been identified in eastern and central Alberta, northeastern British Columbia and the southwest of the Northwest Territories, as well as in Quebec, Denmark, Russia, and Patagonia. Economic shallow Quaternary gas reservoirs of biogenic origin are presently being produced in China (Lin et al., 2004). Direct detection of gas in shallow bedrock reservoirs such as the Belly River has also met with some success. In July 2003, the Alberta Energy and Utilities Board successfully capped "Old Salty," an orphan well 80 m from the Peace River that had been flowing 340,000 cubic feet of natural gas a day for 87 years (Calgary Herald, 2004). Even as late as 1982, relief efforts were not able to safely drill below 99 m bgs because of the pressures. Clearly, significant volumes of gas in the top 400 m remain to be discovered in Alberta, and it is unlikely that seismic reflection will be a cost-effective exploration tool at these depths.
The Near Future
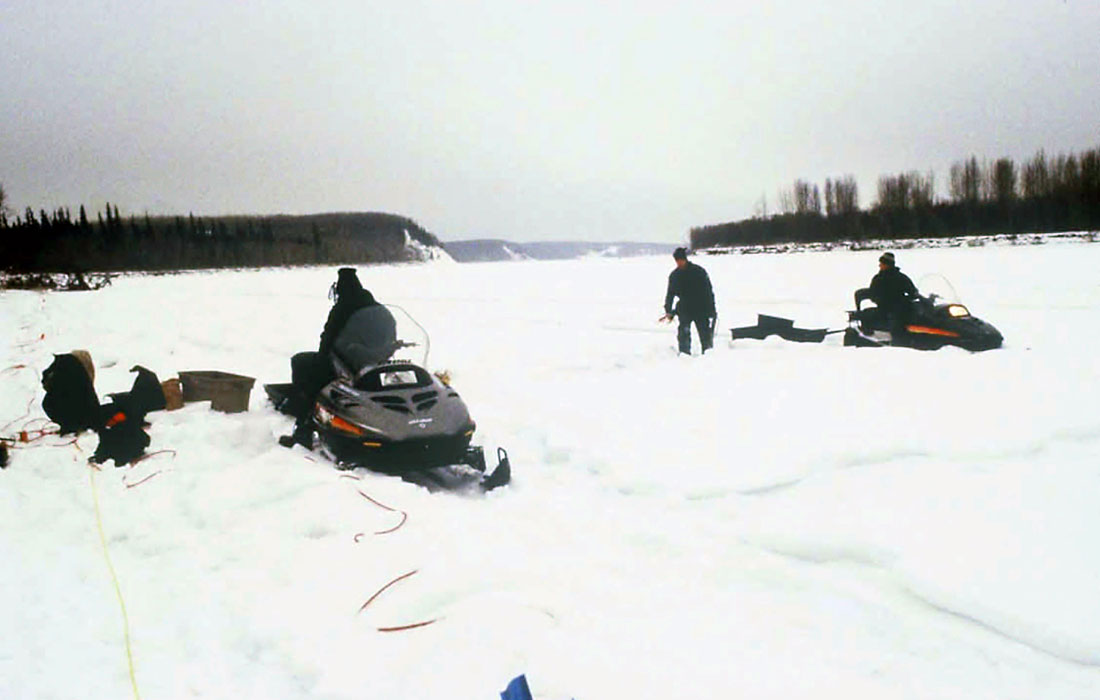
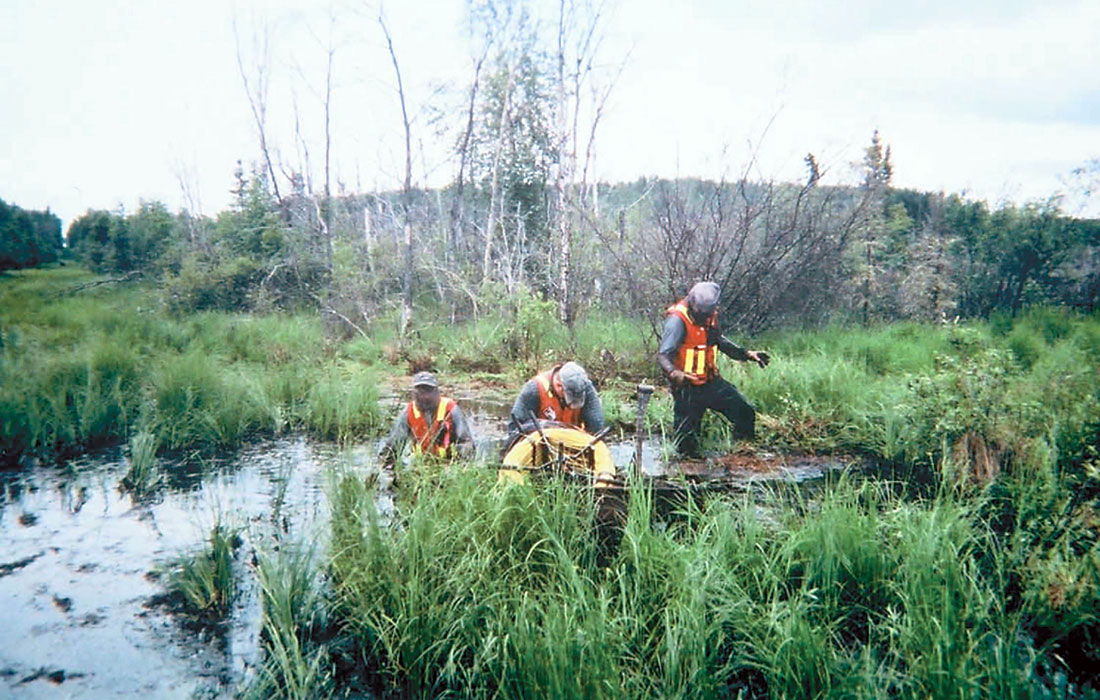
Geophysics textbooks of the 1980’s put severe limitations on the applications of resistivity techniques. Telford et al. (1986), for instance, noted that "the chief drawback is its large sensitivity to minor variations in conductivity near surface," hence, resistivity surveys were usually avoided in dry, frozen, or other soil types exhibiting extreme electrical contrasts. Telford et al. also noted a second severe limitation in "the practical difficulty involved in dragging several electrodes and long wires over rough wooded terrain." Progress in hardware, software, an understanding of the physics of the measurement, and in logistical aids has removed the above noted obstacles in less than a decade (Figures 12, 13, and 14).
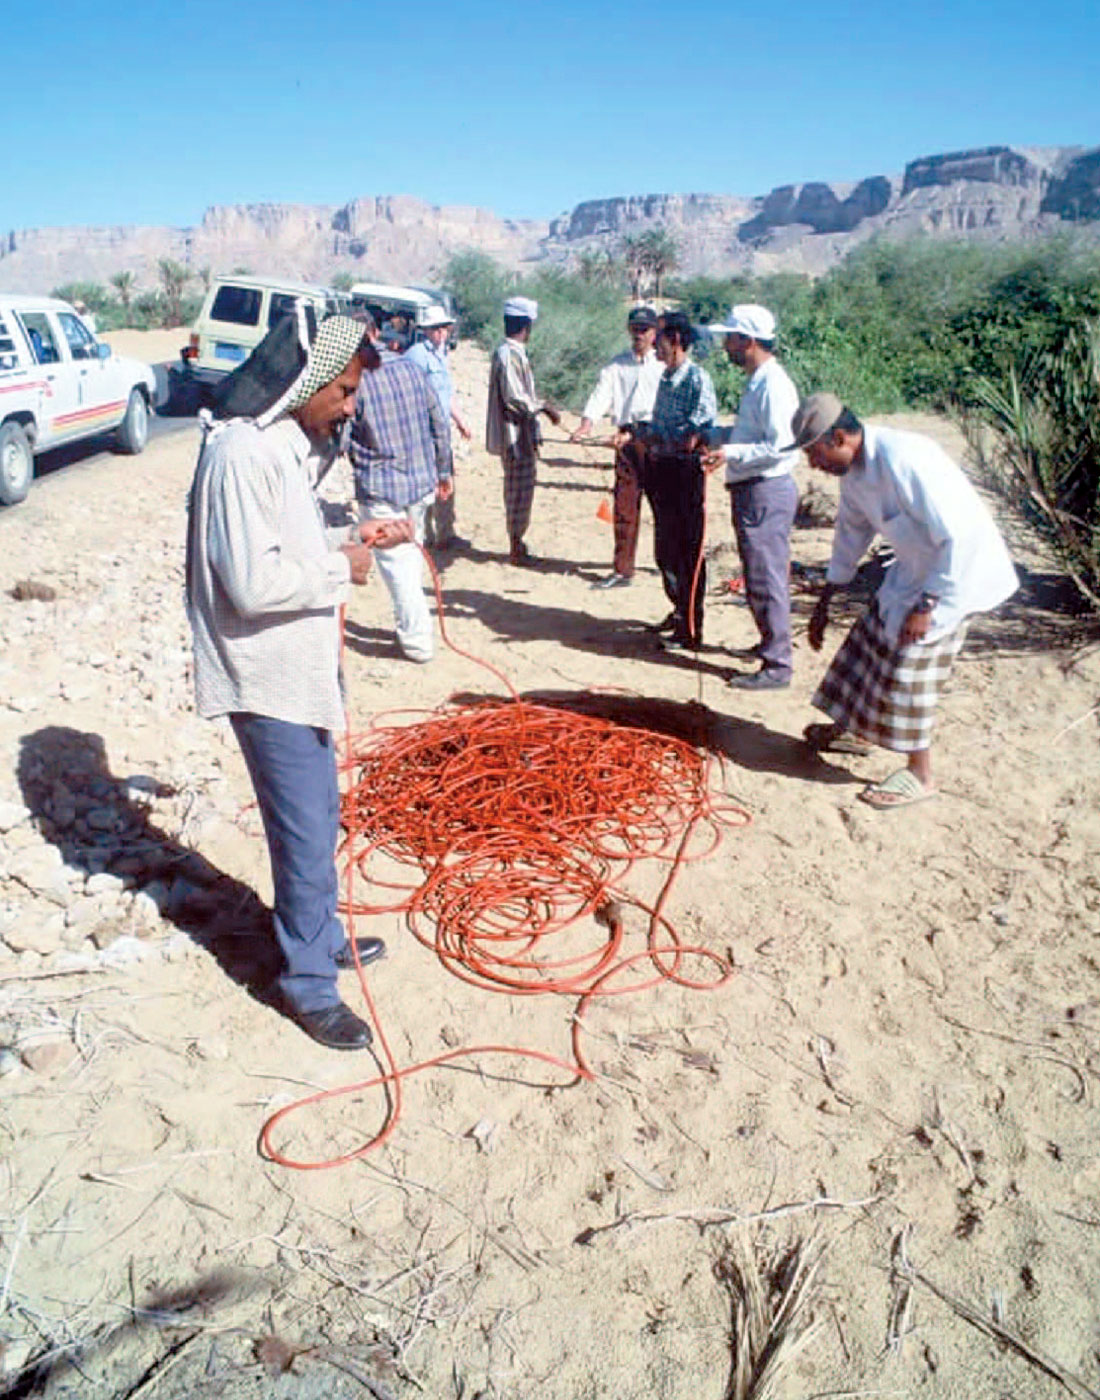
Notwithstanding, very significant developments in the methodology of 2-D resistivity surveying are presently occurring. The hardware development of improved and expanded multichannel transmitters and receivers will directly effect the speed of acquisition, and hence, the cost-effectiveness of both 2-D and 3-D surveying. Pulled resistivity arrays, already in use in Europe for over a decade (Sorensen, 1994), may be particularly appropriate for the wide open prairies of Western Canada. 2-D arrays from surface, used by Komex for monitoring air sparging at contaminated industrial sites, could be expanded for temporal monitoring of steam chamber development in SAGD operations. The use of permanently installed arrays (Dahlin and Johansson, 1995) and telemetry will make 4-D monitoring inexpensive and essentially continuous. More powerful computers and accompanying algorithms will facilitate faster inversions and joint inversions with other geoelectrical and non-geoelectrical data. Increased capabilities of inversion software to incorporate known constraints will improve accuracy, resolution, and depth of investigation. The survey costs of resistivity surveying, already approximately 25% of the per kilometre cost of high resolution shallow seismic reflection, will continue to be proportionately less as the above developments increase the speed and quality of acquisition and processing.
Conclusion
After being presented with possibilities of alternative geophysical exploration methods for certain hydrocarbon plays, I have occasionally heard oil and gas explorationists resignedly refer to seismic reflection as the "white bread" of geophysics. Yet, 80 years after seismic reflection was first used in oil exploration (Telford, 1986), it still holds a well deserved overwhelming dominance as an exploration tool due to its great depth of investigation while preserving useful vertical and lateral resolution. Nevertheless, seismic reflection has some fundamental failings including a very low probability for direct detection, and the reality of measuring a parameter at surface (acoustic impedance) sensitive to physical properties (density and velocity) that are different from those measured in the borehole to identify the resource (resistivity and porosity). Still, for most hydrocarbon exploration programs, electrical methods should not even be considered. Insufficient resolution and/or depth of investigation are the usual limitations. The niche applications, however, are not insignificant. In Alberta, shallow oil sand resources are spread across an area the size of Ireland. The three components of a Quaternary gas play - a shallow primary gas reservoir, an incised channel breaching this reservoir, and a low permeability trap - exist over most of Alberta and much of Western Canada. And while more efficient exploitation of gas reserves stranded behind surface casing will not be the answer to a looming energy crisis, such zones are cost-effective targets for exploration and delineation by surface electrical methods. Other fields similar to Sousa and Rainbow are surely waiting to be discovered.


Join the Conversation
Interested in starting, or contributing to a conversation about an article or issue of the RECORDER? Join our CSEG LinkedIn Group.
Share This Article