Summary
Unconventional resources such as shale and tight gas plays require engineering disciplines to develop solutions to achieve economic production levels. However, reservoir heterogeneity as seen in various forms of data has prompted for a better understanding of reservoir properties to optimize drilling and completion programs.
Seismic methods for reservoir characterization were implemented in this study to achieve an improved understanding of these unconventional resources. Amplitude variation with offset inversion was performed to estimate the elastic properties that ultimately relate to the geomechanical properties important in hydraulic fracture stimulation. In addition, fault mapping was performed to identify potential barriers that could affect fracture propagation. The results were calibrated against microseismic monitoring data to validate the effectiveness of the seismically derived properties in the prediction of fracture behavior.
Introduction
Unconventional shale and tight gas plays were predominately an engineering focus in its early stages of development. The low permeability (sub-millidarcy) reservoirs require engineering disciplines to develop solutions for extended laterals with multi-stage hydraulic fracture stimulation completion strategies to achieve economic production levels. The objective of the completion is to maximize reservoir contact through the generation of fracture networks to increase the permeability and allow for the movement of gas through the reservoir and into the production well.
Microseismic monitoring provides the means to characterize the induced fracture networks generated by hydraulic fracture simulation, allowing for the determination of the extent of stimulated reservoir to optimize drainage. The pressure field created by the injection of fluids into the reservoir results in the failure of the rock and the release of energy due to fracturing can be recorded to determine the magnitude and location associated with the fracture. The microseismic monitoring data have demonstrated a non-uniform fracture response in these reservoirs and in conjunction with data obtained from wireline and coring, suggests the existence of heterogeneity within the reservoir. The high cost of stimulation therefore prompted a need to better understand the property variations within the reservoir to optimize drilling and completion strategies.
Seismic methods can be utilized in such reservoir characterization studies to achieve an improved understanding of the reservoir heterogeneity. Amplitude variation with offset (AVO) inversion provides the means to estimate subsurface elastic properties that ultimately relate to the geomechanical properties important in hydraulic fracture stimulation. In addition, seismic methods for fault mapping can provide insight on local stresses and fracture barriers. This study integrates various geophysical methods in mapping the reservoir heterogeneity and validates the results through microseismic monitoring data to illustrate the uplift provided by geophysics in the development of these unconventional gas plays.
Geological Setting
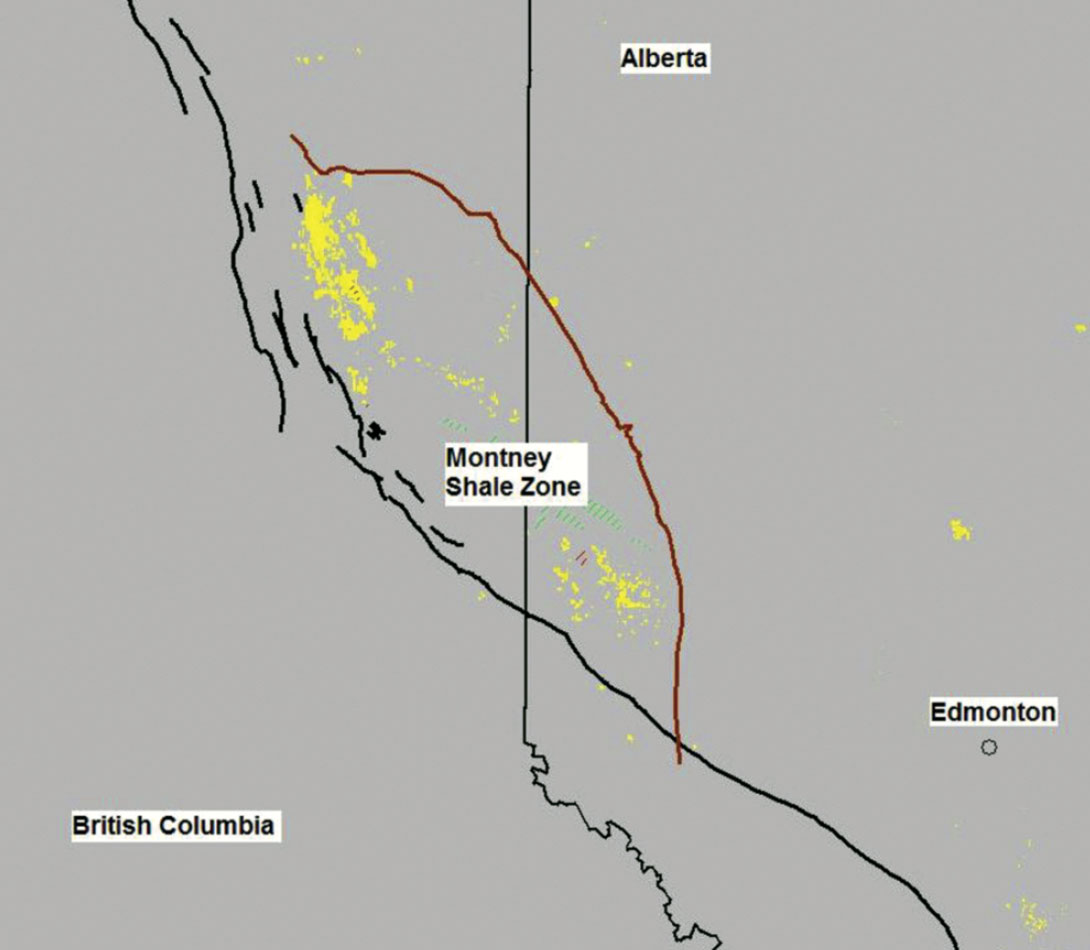
The Lower Triassic Montney (Figure 1) is a 250-300 m thick succession of siltstones and shales. The Montney is a deepwater deposit sitting above the Permian Belloy or Mississippian Debolt (when the thin Belloy is missing) and below the Middle Triassic Doig. The Montney was deposited along a paleo-continental shelf in a generally NW-SE direction, and becomes thicker to the SW.
The Montney has generally been, to date, subdivided into the Upper and Lower Montney along a major flooding surface, referred to as the Mid Montney Marker. The entire Montney section in the area of application is gas charged. Gas is trapped as a continuous phase in the fine grained low permeability silts and shales where capillary forces restrict migration either up-dip or into coarser grained rock. The Montney is also organic rich which creates a self-sourcing hydrocarbon system which is generally overpressured. This combination of local sourcing, low permeability and overpressure culminates in a widespread unconventional gas resource.
The Upper Montney consists of fine to very fine grained siltstones that were deposited in a series of prograding packages. It is unclear if pre-existing structure played a role in the depositional pattern of these silts but geological mapping shows subtle regional thickening and thinning of these silts and shales. Data in this area is very sparse but cutting and core data confirm the unconventional nature of the reservoir with porosities between 3-6% and permeabilities in the 0.001 to 0.05 mD range.
In general, the Poisson’s ratio (PR) can be inversely correlated to the quartz-clay ratio where relative high values of PR represent areas of increased ductility. In addition, from qualitative and empirical evidence, an increased quartz-clay ratio (or a decrease in PR) correlates to increased porosity, lower breakdown pressures for stimulation and enhanced relative production (Miller et al., 2007). Therefore, knowledge of the PR can be a direct indicator for reservoir quality.
AVO Inversion
The offset dependent amplitude response of seismic data is governed by the plane wave Zoeppritz equations. It is a set of equations that is a function of six independent elastic parameters, the compressional (P) wave velocity, shear (S) wave velocity and density above and below a reflecting interface. Due to their complex nature, approximations were sought for a more practical implementation. Various approximations exist in the literature, all of which are parameterized as the changes in average properties at the reflection interface. In this study, we perform an inversion of the offset dependent reflection amplitudes using a three term AVO equation parameterized in terms of the acoustic impedance, PR and density.
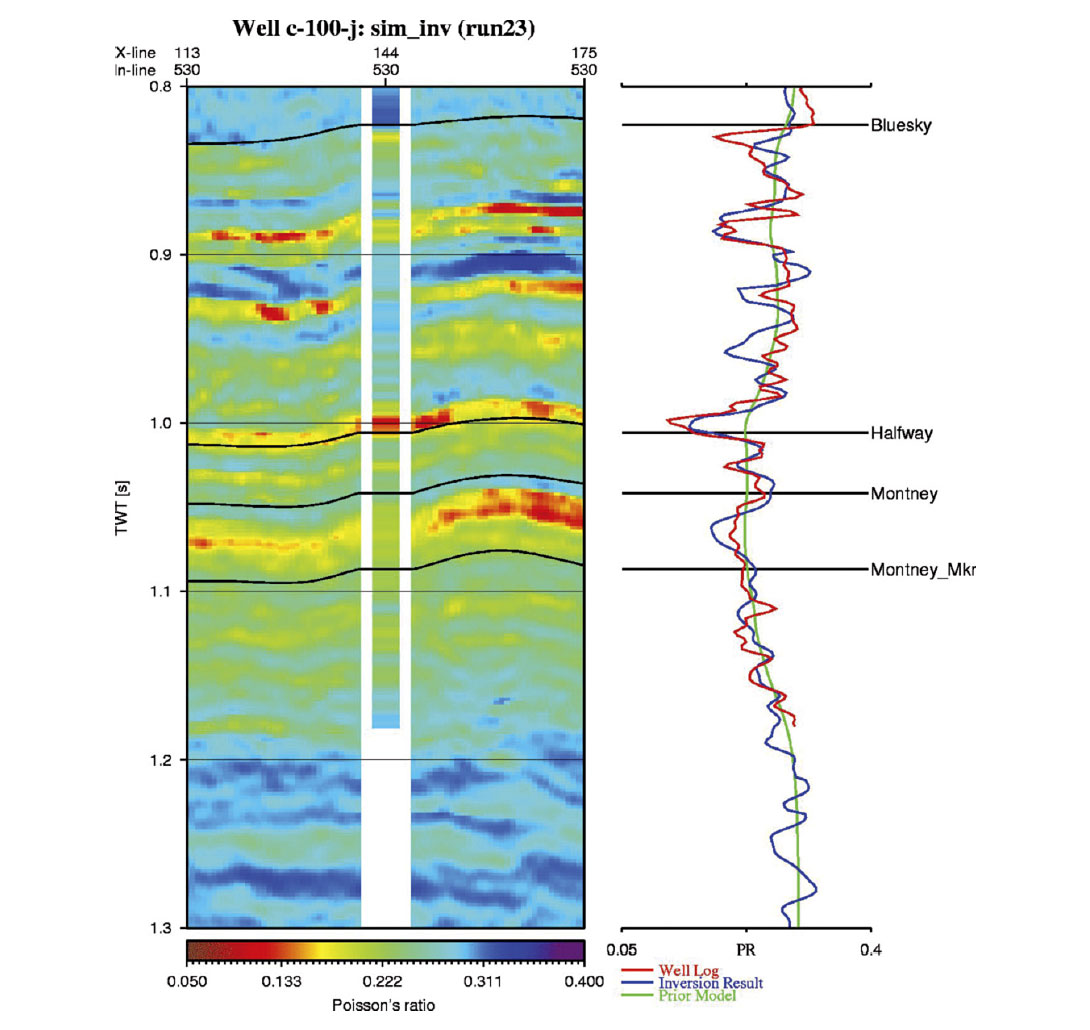
As discussed above, the property of interest was the PR where it can be used as an indicator for reservoir quality. Figure 2 shows a comparison of the PR inversion results with the measured well information. The zone of interest is between the Montney and Montney_Mkr horizons where the property variations in the reservoir can be seen.
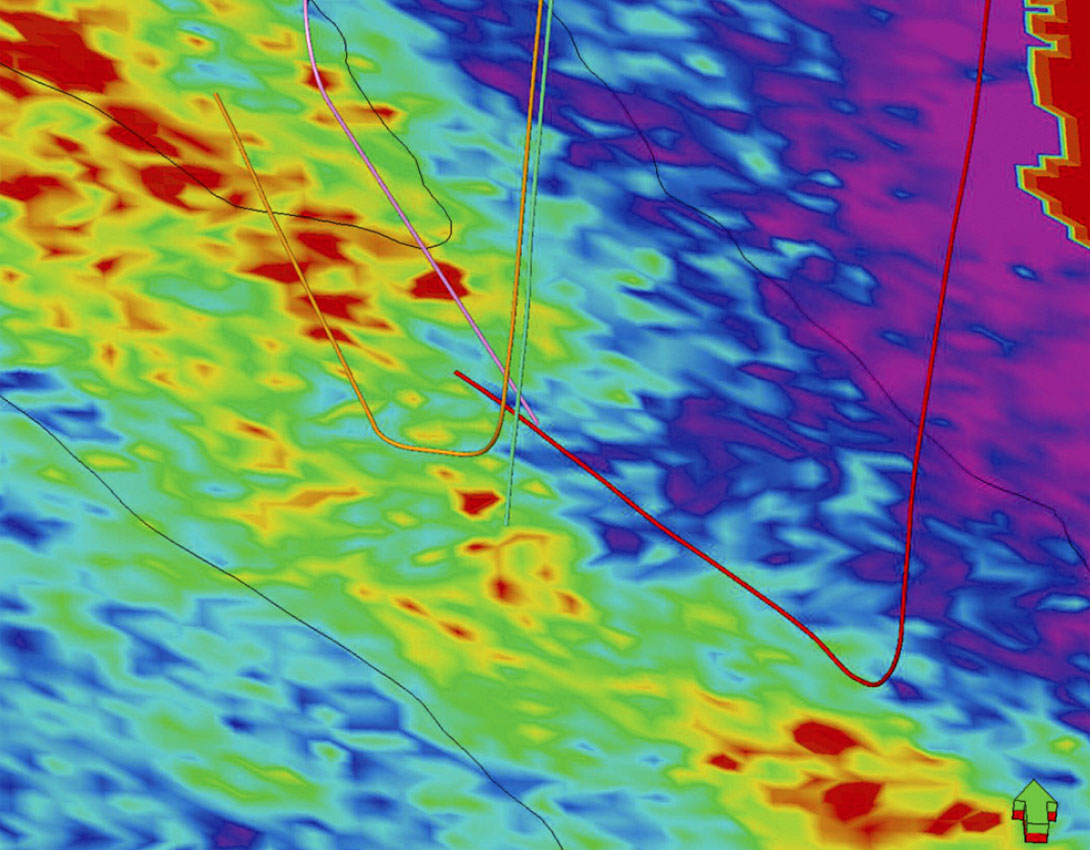
Since the ‘sweet spots’ associated with the reservoir are relative low PR values, a map of the minimum values within the reservoir interval was generated as shown in Figure 3. The map demonstrates a large degree of variation within the zone of interest.
Fault Mapping
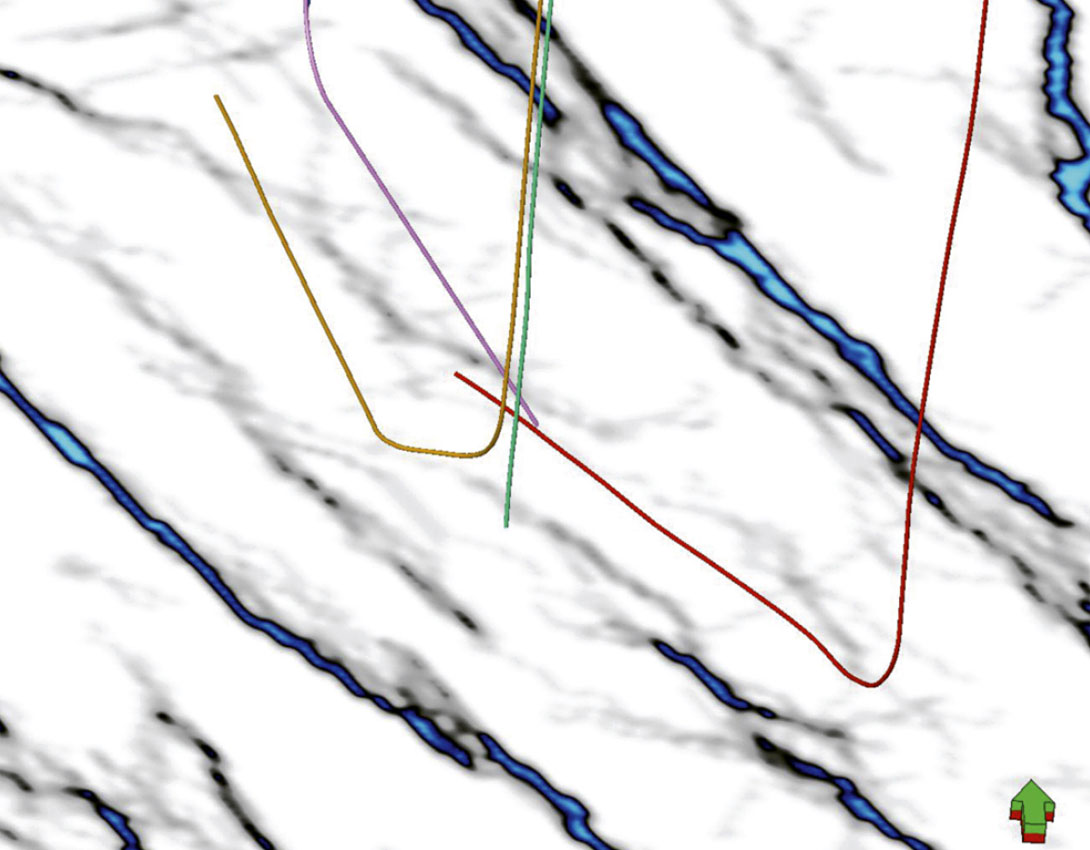
The Ant-Tracking algorithm was utilized to generate a fault attribute volume. Several steps are involved in the workflow including data pre-condition, edge detection and Ant-Tracking. The data pre-conditioning step applies an edge preserving smoother to the input seismic in order to enhance reflector continuity while preserving discontinuous events corresponding to the presence of faults. Next, an edge detection method is implemented to extract features that represent discontinuities in the seismic image. This process however, will detect all discontinuities including faults, channel boundaries, acquisition footprint, reflector amplitude variations and various other features that disrupt reflector continuity. The Ant-Tracking algorithm then extracts features within the edge detection volume that exhibit fault-like behavior. It uses principles from ant colony systems to extract like trends in a noisy data environment. Digital intelligent agents (ants) are distributed throughout the edge detection volume and extracts features that exhibit characteristics in terms of consistency in dip, azimuth, planarity and spatial continuity. The output is then an attribute volume that corresponds to only fault like features. Figure 4 shows the Ant-Tracking results at the reservoir interval.
Understanding the fault geometry is essential in the characterization of the reservoir. The presence of faults could pose drilling hazards as well as influence the completion of the well. Locally varying stress fields deviating from the regional stress directions could result due to the presence of faults and influence fracture propagation. In addition, faults could form fracture barriers in stimulation where the energy could reactivate or be dissipated along existing faults. The Ant-Tracking results were used to identify existing faults and provide an indication of areas with stress variations. The stress variations manifest in the form of velocity changes that can be detected by seismic amplitude measurements. Therefore, discontinuities in the seismic image that do not exhibit an observable reflector displacement could indicate areas of increased stress (subseismic resolution faults that are likely to be still tectonically loaded) where these areas would be prone to strain release upon an increase in effective stress as a result of the hydraulic fracture treatment (Maxwell et al., 2011).
Microseismic Monitoring
Microseismic monitoring of hydraulic fracture treatments has become a normal part of completion operations in unconventional gas reservoirs. It is used routinely in all the major shale gas basins, particularly in the areas where the development is more mature. Microseismic images of fracture evolution and geometry provides an opportunity to go beyond pumping rates and pressures monitored at surface as a means of inferring the behavior of the stimulation downhole.
The microseismic events from three treatment wells are shown in Figure 5. The majority of events exhibit a linear fracture geometry which lie consistently NE-SW in the direction of the regional maximum horizontal stress. However, clear variations of fracture geometry from stage to stage demonstrate the heterogeneity of reservoir mechanical properties along the wellbore.

Results and Discussion
The microseismic results for the three treatment wells show significant variations in the fracture length, direction and number of events occurring in each stage. This variation can be correlated with the PR values as well as the Ant-Tracking results.
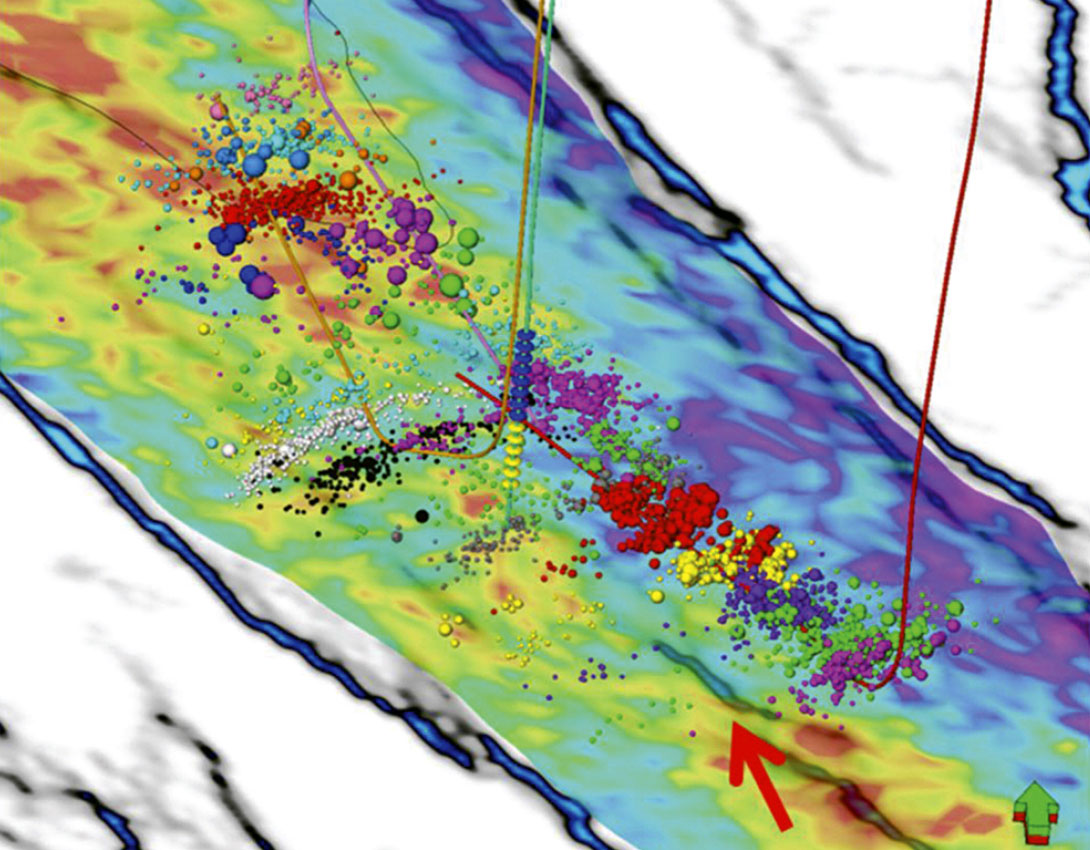
In Figure 6 the microseismic events are overlaid on the minimum PR map and Ant-Tracking results. The results indicate that the reservoir stimulation creates fracture networks that prefer the lower PR rock. There is a NW-SE boundary between the lower PR and the higher PR values which clearly appears as a boundary for the microseismic events. The easternmost two wells exhibit little to no extent of induced fractures to the NE into the higher PR rock but exhibits fracture propagation heading SW into the lower PR rock. A supplementary explanation for the preferential direction of fracture propagation into the lower PR rock is that a lower PR corresponds to lower horizontal stresses resulting from a vertical lithostatic load as given by

where σH and σh are the maximum and minimum horizontal stresses respectively, σv is the vertical stress and ν is the PR. Isotropy is assumed in equation 1 and provides a relatively simple alternative interpretation of the preferential fracture direction towards the lower PR rock. Anisotropy was not taken into account for this study but is hypothesized to control the fracture geometry. Ongoing work is being performed to validate this hypothesis.
The Ant Tracking volume has created a detailed picture of the smaller scale faults in the Montney zone. It is believed that these smaller scale faults play a significant role in the effectiveness of the stimulation. From Figure 6, there appears to be a lack of microseismic events in the vicinity of a secondary fault as indicated by the red arrow. This could be indicative of energy dissipation along the fault. In addition, the southernmost well was drilled in the vicinity of a very subtle fault feature as seen in figure 4. The recorded microseismic events to the NE are localized around the wellbore. This could be an indication of fault activation acting as a barrier for fracture propagation. A more detailed discussion of this result can be found in Maxwell et al. (2011).
The rock properties and faulting appear to have a clear effect on the resulting direction, length and amount of rock that is stimulated. Thus, there is a significant advantage for using inversion and fault mapping to assist in planning the optimal well spacing and stimulation programs.
Using the PR and fault mapping, Progress Energy has been adjusting its inter-well spacing, its fracture stimulation programs and most importantly its vertical placement within the Montney zone. Since these early wells, we have drilled and completed 12 more horizontal wells and have continued to see a strong correlation between the PR data and the production. As we continue to drill more wells we have been able to use the seismic information to successfully improve our production results.
Conclusions
Unconventional shale gas plays have been dominated by an engineering focus where advancements in hydraulic fracture stimulation have allowed access to these large gas reserves. An important step in the continued improvement of these plays is the incorporation of seismic methods. Two of these methods, inversion and fault mapping have been shown here to give valuable information about the local heterogeneity within these shales and the effect on the fracture stimulation programs. Using these seismic methods we can better plan our well locations and stimulation programs to optimize the results.

Acknowledgements
Many thanks to Frederik Horn, David Close, Richard Parker, Zuolin Chen and Jessica Budge from Schlumberger for their involvement in this study. Also thanks to Progress Energy Resources for permission to publish this work.
Related Reading


Join the Conversation
Interested in starting, or contributing to a conversation about an article or issue of the RECORDER? Join our CSEG LinkedIn Group.
Share This Article