Summary
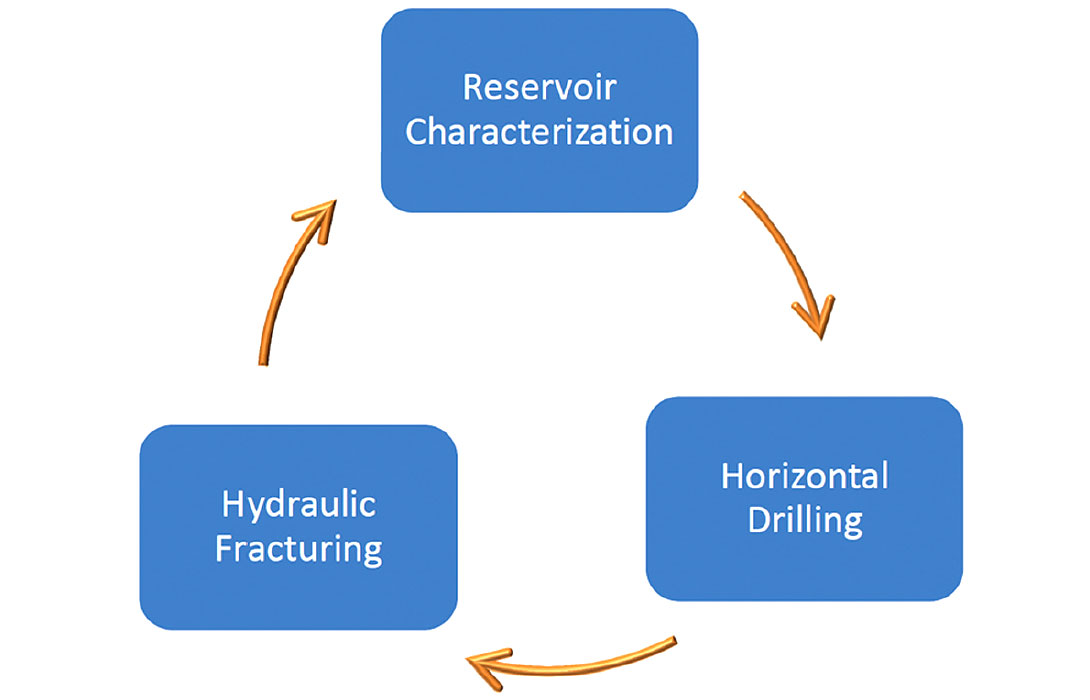
Producing commercial quantities of petroleum and natural gas from organic rich shales was uncommon a decade ago. Due to improved technologies and strengthening in the price of petroleum, activity in unconventional shale projects has increased significantly, particularly as more and more oil reservoirs have been identified. Maximizing recoverable reserves is enabled by a trilogy of refined technologies for exploitation of these types of reservoirs. These consist of: 1) Reservoir Characterization, 2) Horizontal Well Drilling and 3) Horizontal Hydraulic Fracturing (Figure 1).
Shale plays have revolutionized the oil and gas industry in North America and exploitation of these kinds of plays are steadily gathering pace in other parts of the world. Optimizing recoverable reserves from shales requires proper placement of horizontal well bores, drilling the laterals in the proper direction and keeping the lateral portion of the well bores in the optimum layer. It further requires production stimulation by hydraulic fracturing (fracing) of the rocks in order to induce fractures extending laterally from the horizontal well bore.
In this article, a method is presented to identify these optimum areas and layers in the shale using a seismic characterization workflow, where both well and seismic data are closely integrated. The first stage is well data analysis to extract petrophysical, rock physics and geomechanical information. Shale formations often have a complex mineralogy requiring a more sophisticated petrophysical analysis to define the relationship between desirable petrophysical and mechanical properties and elastic rock properties. Then a simultaneous AVO seismic inversion is performed to determine elastic properties, which are used to characterize the important petrophysical and mechanical properties of the shale reservoirs and allow us to predict how the rocks will respond to hydraulic fracing. Fracability can be reliably estimated by the combination of Poisson’s Ratio and Young’s Modulus. These two mechanical properties (Rickman et al, 2008) indicate the rock’s propensity to fail under stress. The final stage is an interpretation of the inverted properties in order to arrive at an accurate model of the subsurface. This is facilitated by identifying the probability of encountering the facies most suitable for fracing and production. The various shale facies are defined and facies models created through a Bayesian probabilistic interpretation. The final models describe the overall thickness and complex architecture of the shale interval. The shale is classified by its individual facies and the thickness and architecture of the most desirable facies within it. These models can be further used to identify the optimum areas, the proper lateral directions and vertical depth variances required to drill successful production wells. The ultimate result of strategic well bore placement is the maximization of cumulative volumes of hydrocarbon production per barrel of hydraulic frac fluid. Simply put, if hydraulic frac jobs are completed within the area and strata most conducive to the creation of complex fracture patterns that remain open and conductive to fluid flow, more oil or gas can be produced.
Introduction
Shales are the most abundant form of sedimentary rock on Earth. They usually have very low permeability but can be a source rock for hydrocarbons which migrate into permeable reservoirs. Shales can also act as seals, trapping oil and gas in the underlying sediments.
Tight, organic-rich shale deposits with potential for hydrocarbon production are referred to as unconventional reservoirs or resource plays (Boyer et al, 2011). These resources, until recently considered only a source rock for hydrocarbon reservoirs, are now recognized in their own right for their huge potential for oil and gas production. They also act as both the trap and the seal. As with conventional plays, the economic case for developing and producing a field is based on how much hydrocarbon resource exists, whether it is primarily a gas or oil opportunity, and how much can be extracted and at what cost. The answers in shale plays lie in the volume and maturity of the total organic carbon (TOC) and the ability to create an effective fracture network which will conduct the hydrocarbon to each borehole. This in turn requires an understanding of lithology, mineralogy, relative rock brittleness, natural fracturing and the directionality of in situ rock stresses (Holden et al, 2013).
Hydrocarbon-bearing shales usually have insufficient permeability to allow significant flow to a well bore and production from these unconventional reservoirs comes with unique challenges. The sweet spots should have all of the ingredients to make wells profitable – good free gas volumes, adequate porosity, lower Vclay and higher brittleness (hence fracable).
Contributions from multiple geoscience disciplines over decades have shown that the Barnett Shale is organically rich, thermally mature, and vertically variable in its lithology and geomechanical properties. Additionally, the formation is simultaneously the source, reservoir and trap for hydrocarbons. Although the Barnett Shale was discovered in the 1950s, only in the 1980s was hydraulic fracturing proven to provide an escape flow-path for the formation’s natural gas which led to the current boom in its natural gas production.
In this Barnett Shale project, a simultaneous AVO (pre-stack) inversion was used to demonstrate the feasibility of constructing a subsurface geological and geomechanical model describing the thickness and complex architecture of the brittle/fracable portion of the formation. This information can, in turn, be used to determine optimal well bore trajectories. Considering that the Barnett Shale has a significant structural component, an accurate design of the well bore trajectory is required to remain within the bounds of the most appropriate facies.
Historical data show that productivity is a function of the induced fracture extent or complexity and how well the formation can maintain those fractures. Fracability, the propensity of the formation to fracture and maintain the fracture, is directly correlated with brittleness. In turn, the field results validate that the formation’s susceptibility to fracturing can be reliably predicted from the brittleness as calculated using Poisson’s Ratio and Young’s Modulus (Pitcher and Buller, 2012).
Geological Setting
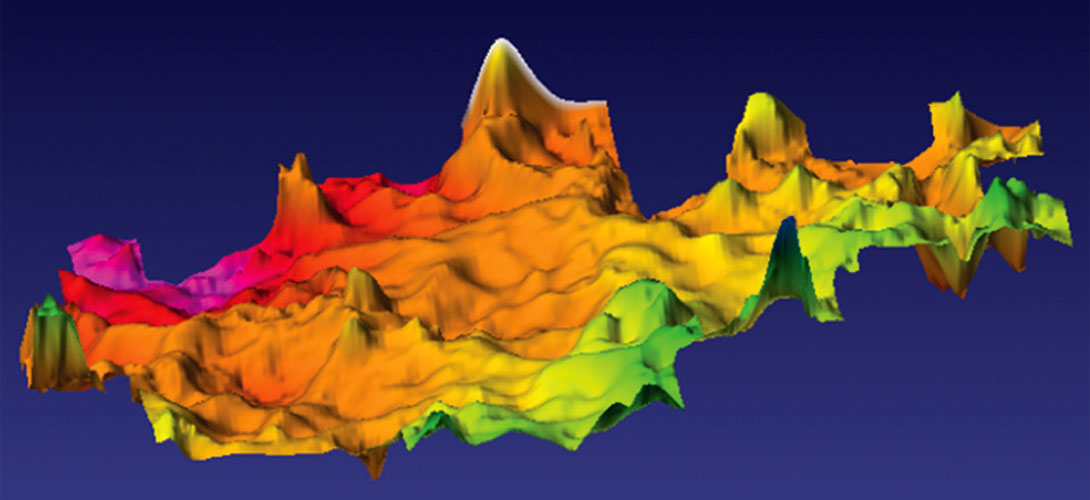
The Mississippian-age Barnett Shale, located within the Bend Arch – Fort Worth Basin of Texas, is one of the most important hydrocarbon- bearing geologic formations in North America. The structurally deepest part of the Fort Worth Basin lies to the northeast where the Barnett Shale formation is more than 1000 ft (305m) thick and interbedded with limestone units; westward, it thins rapidly over the Mississippian Chappel shelf to only a few tens of feet (Pollastro et al, 2007). The Barnett Shale stretches over a dozen counties in northern-central and eastern Texas and protrudes into a small area of southwestern Oklahoma. Multiple tectonic events have structurally deformed the Barnett Shale so that it is a naturally fractured reservoir, very irregular and undulating (Figure 2). It is structurally an asymmetric basin and exhibits major tectonic features. Tectonic faults and fractures are associated with the collapse of the Barnett Shale into karst features in the underlying Ellenburger Group carbonates (Montgomery et al, 2005). The Barnett Shale is the second largest producing on-shore domestic natural gas field in the United States, after the San Juan Basin in New Mexico and Colorado. It covers an area of around 5,000 square miles (13,000 square kilometers). The field is proven to have 2.5 trillion cubic feet of natural gas.
Petrophysics
The highly laminated nature of most shales presents a challenge for traditional analysis. These fine grain sand formations harbour consolidated and compacted parasequences of shallow marine sediment, clay, quartz, feldspar, and heavy minerals (Haege et al, 2012). They exhibit ultra-to-low inter-particle permeability, low to moderate porosity, and complex pore connectivity (Themig, 2011).
Shale play sweet spots are typically characterized by mid to high kerogen content, lower clay volumes, higher effective porosity, low water saturation, high Young’s Modulus and low Poisson’s Ratio.
The first stage in the seismic characterization workflow is to analyze the core data and wireline logs, in order to describe the shales in terms of their source rock potential: total organic content and thermal maturity. Shales may also be described in terms of mechanical properties using measures such as silica content, fracture content, brittleness and pressure gradient. The formation permeability is in the micro-Darcy to nano-Darcy range and porosity varies between 0.5 and 10%. This reservoir needs to be artificially fractured in order to produce gas.
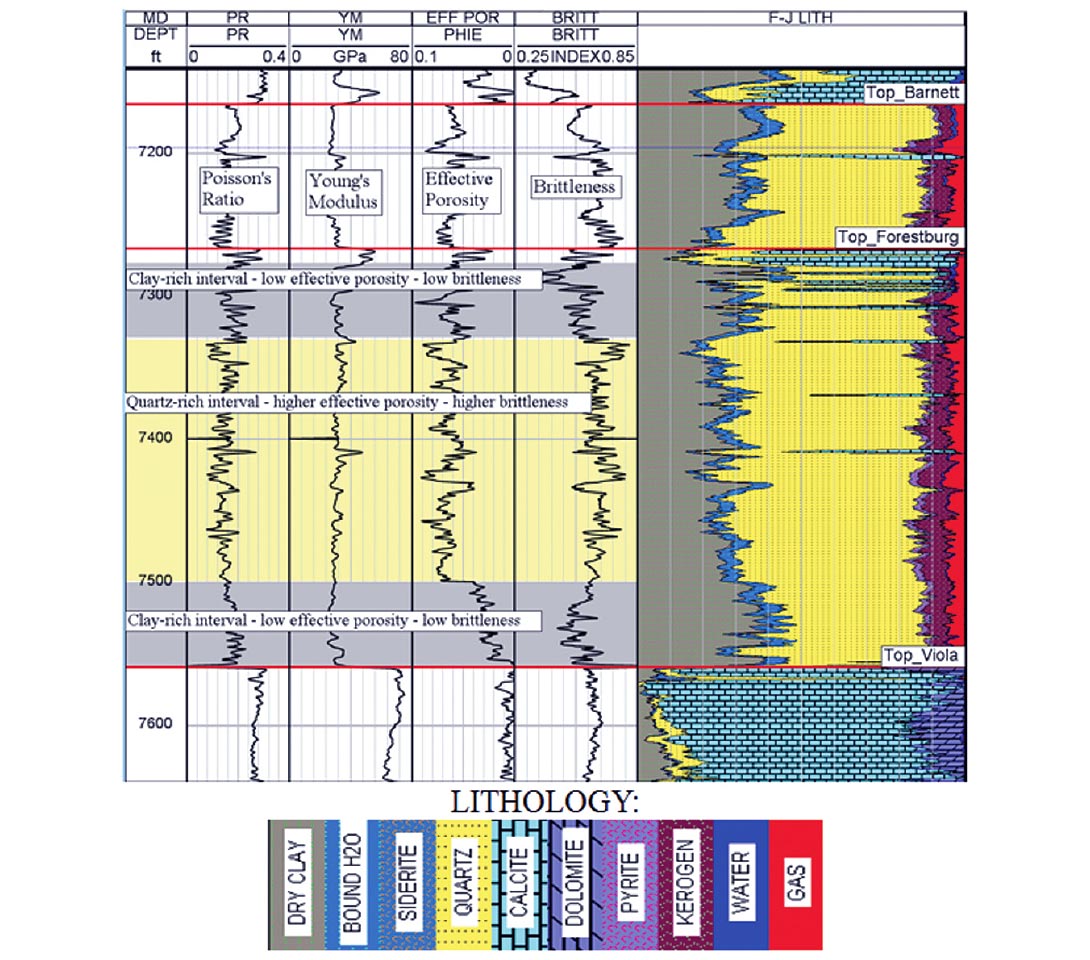
The mineralogy of the Barnett Shale is comprised of clays, quartz, calcite, kerogen and other minerals. In Figure 3, a stochastic approach was adopted to estimate the mineral volumes of the shales (Jenson et al, 2012). The model results for each mineral were then calibrated to X-ray diffraction (XRD) core cutting analysis (Holden et al, 2013).
Once the stochastic model is derived and calibrated, it can be applied to other wells in the area. In our case, the stochastic model was further detailed by incorporating rock physics to understand and predict the ability of a rock to fail under stress (Poisson’s ratio and Young’s Modulus). These mechanical properties were used to compute brittleness (Rickman et al, 2008). Brittle shales are more likely to be naturally fractured and respond favourably to hydraulic fracing treatments whereas ductile shales with higher clay content are not good reservoirs due to lower fracability and lower permeability. The Barnett Shale reservoir is suitable for water fracs because of its mineralogy and the presence of natural fractures. For example, certain minerals such as quartz are more prone to fracture, while clay tends to fill and close fractures when they occur (Holden et al, 2013). Natural fractures re-activate during stimulation and increase efficiency by widening the treatment zone (Gale et al, AAPG 2007).
Reservoir Characterization
The information gained from the well data analysis needs to be extrapolated away from the well locations and simultaneous inversion can help with this requirement.
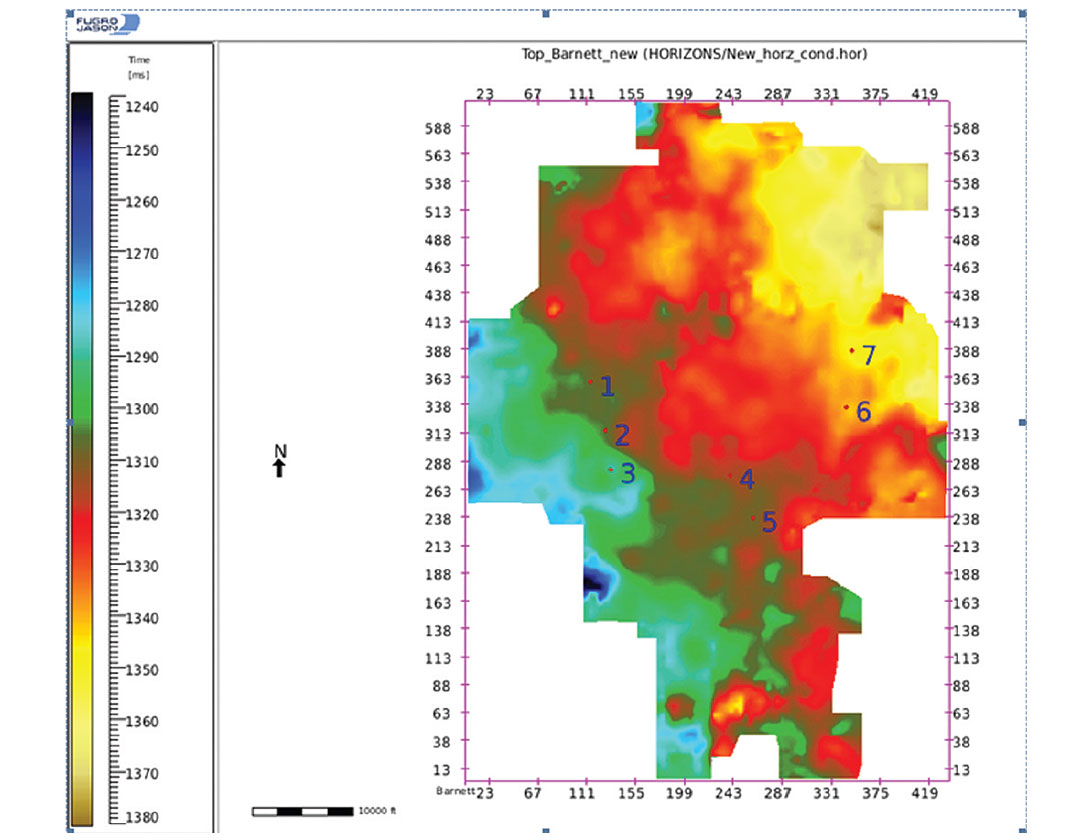
In this case study, a reprocessed 3-D seismic dataset (2011), consisting of three partial angle stacks (near 0º-20º, mid 20º-35º, and far 35º-50º), along with seven pilot wells, were prepared for an elastic inversion (Figure 4). All the wells had P and S-Sonic, Vp/Vs and density logs. Some of the survey wells penetrated water zones and displayed thickness variability and lateral lithological changes.
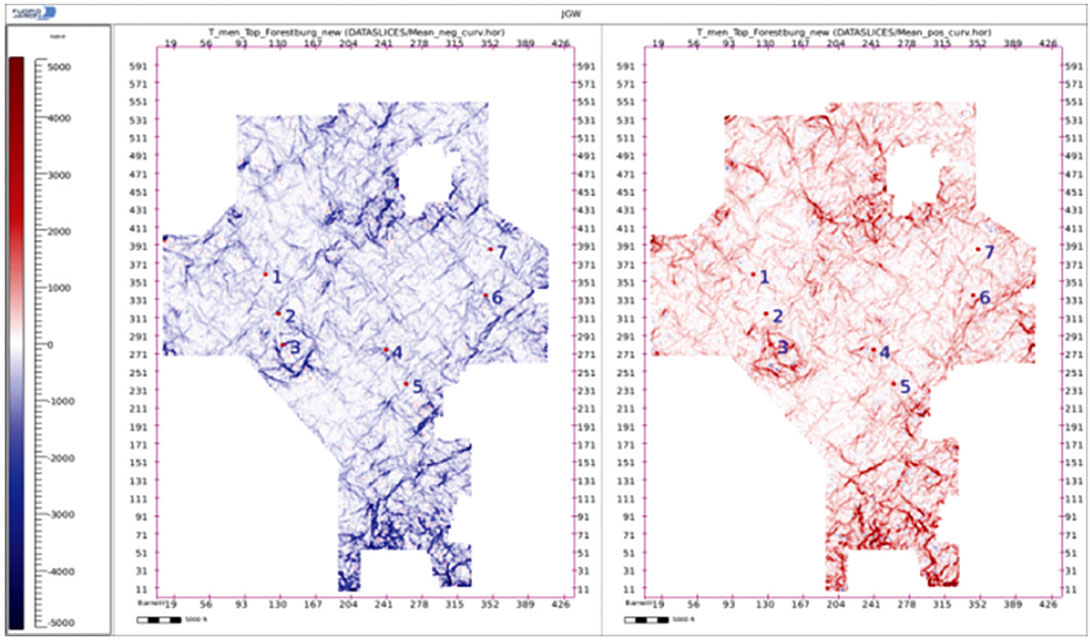
Major natural fractures in the eastern portion of the survey area were identified from a seismic structural attribute study (Figure 5). Approximately 116 square miles of AVO-compatible PSTMprocessed 3-D seismic data were inverted to extract the Barnett shale rock properties. The goal was to fully characterize structural and stratigraphic complexities in the sequence of interest, to identify intervals with favourable characteristics for drilling horizontal wells, possible fracture barriers, and potential hazards such as water conduits.
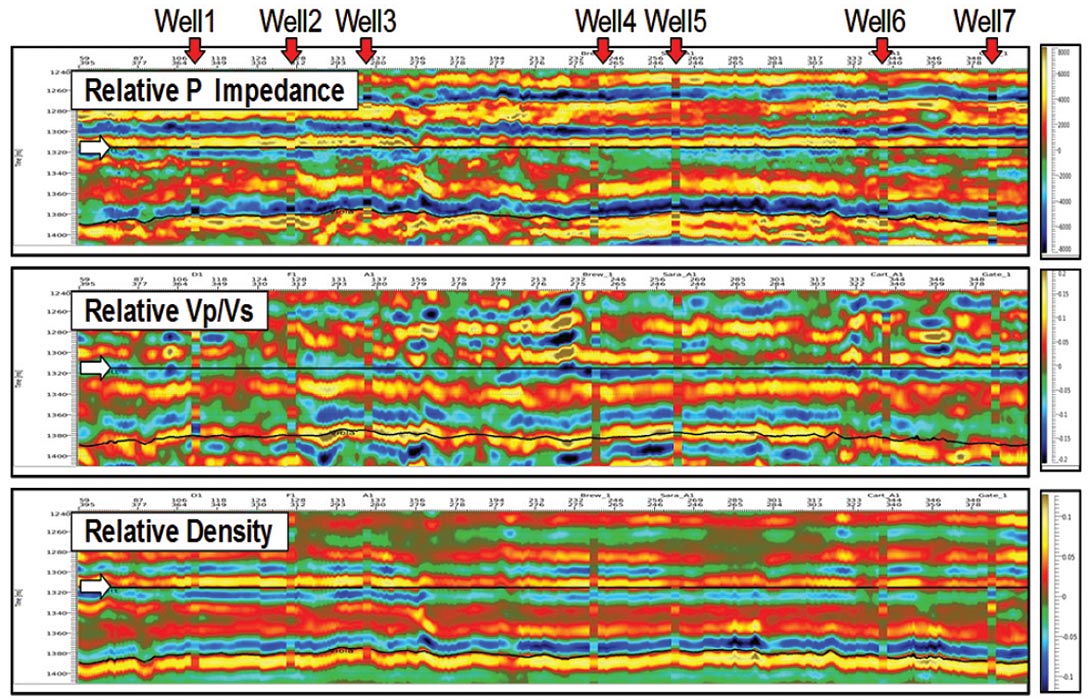
When an exploration or development project is undertaken, the data from various geoscience disciplines need to be integrated to develop a common subsurface description. Inversion of seismic data for elastic properties has become a standard part of the workflow for quantitative reservoir characterization. The simultaneous AVO/AVA inversion process transforms seismic data from interface to layer properties representing the elastic parameters of the rocks (Pendrel et al, 2000). The results of inversion facilitate a more reliable interpretation due to reduced tuning and interference effects and the increased bandwidth compared to the seismic. The key properties natively derivable from AVO/AVA inversions are P-impedance, S-impedance or Vp/Vs and Density. The latter usually requires input angles exceeding 50 degrees unless other independent information is available. Since the far angle was reasonably large (50 deg.), the density was obtained directly from the inversion. In doing this it was stabilized within the inversion process by softly constraining it to the Gardner relation. An example of P-impedance derived from inversion is shown in Figure 6. The S Impedance and Density were used to compute other reservoir properties of more immediate interest and using relations observed in the logs. Various types of crossplots were used to investigate the relationship between mechanical/elastic characteristics such as brittleness, petrophysical properties, lithology and porosity. The results served as attributes to build a template for the interpretation of the field data from inversion.
We quantified the Barnett Shale’s brittleness factor in a way that averages both Young’s Modulus and Poisson’s Ratio. Averaging these two disparate properties was made possible by first indexing them on a scale of 1-100. Young’s Modulus was calculated from:
YM = 2*Is2*(1+ PR)/RHOB
where ‘YM’ is Young’s Modulus, ‘Is’ and ‘PR’ are respectively, the Shear impedance and Poisson’s Ratio, and ‘RHOB’ is the inverted density.
Poisson’s ratio ‘PR’ was computed by the Vp/Vs ratio using the relation:
PR = [(Vp/Vs)2-2]/[2(Vp/Vs)2-2]
The brittleness index was calculated using the following formula which contains embedded indexing:
BRIT = {[(YM-1)/7]+[(PR-0.4)/(-0.25)]}*50
Here, we have followed the method of Rickman et al, 2008.
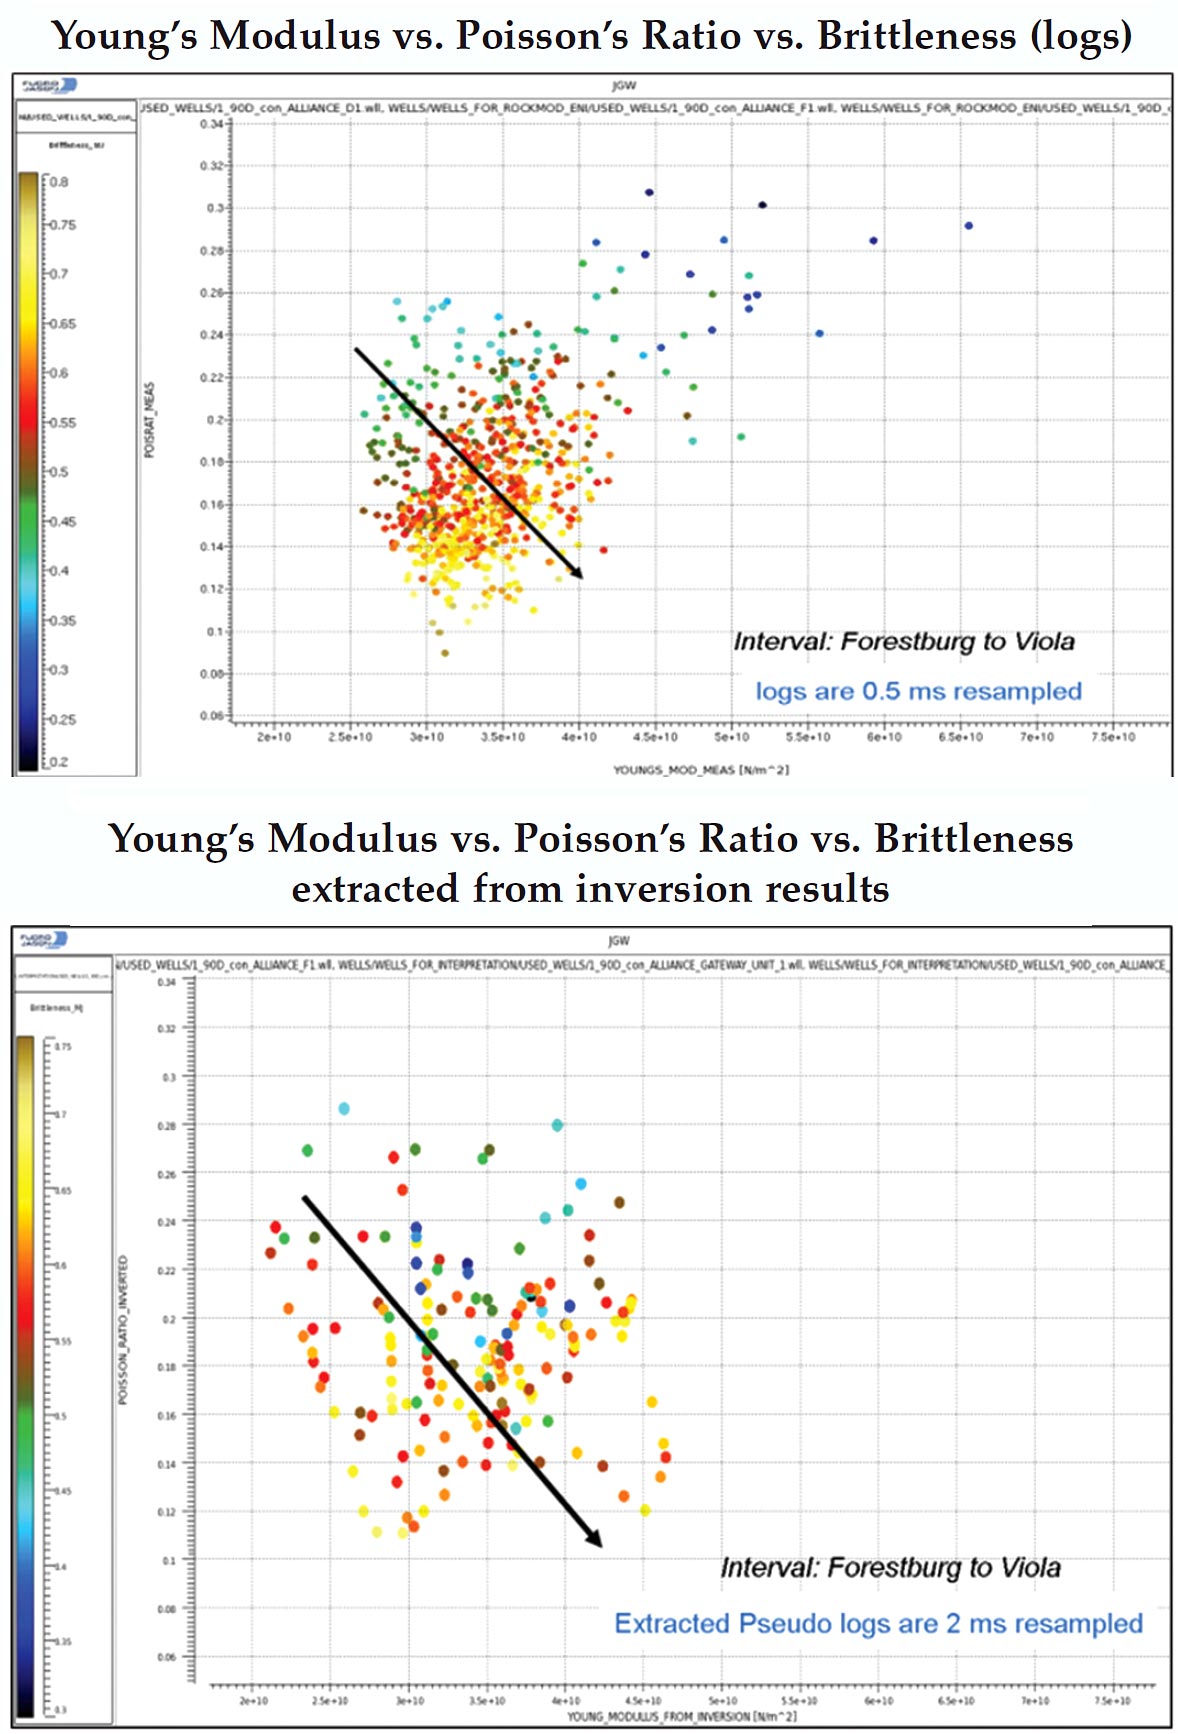
In Figure 7 (upper), the observed relation in the logs between the Young’s modulus, Poisson’s ratio and brittleness is shown. Figure 7 (lower) shows the same relation as in the upper panel but derived entirely from the seismic through the inversion process.
Different facies can be recognized within the Barnett. For example, ductile shale is not productive as it tends to “heal any natural or hydraulic fractures” (Rickman et al, 2008). On the other hand the most brittle silty shale, characterized by a higher quartz fraction, is more likely to be naturally fractured and will be more prone to create and sustain induced hydraulic fractures.
Interpretation
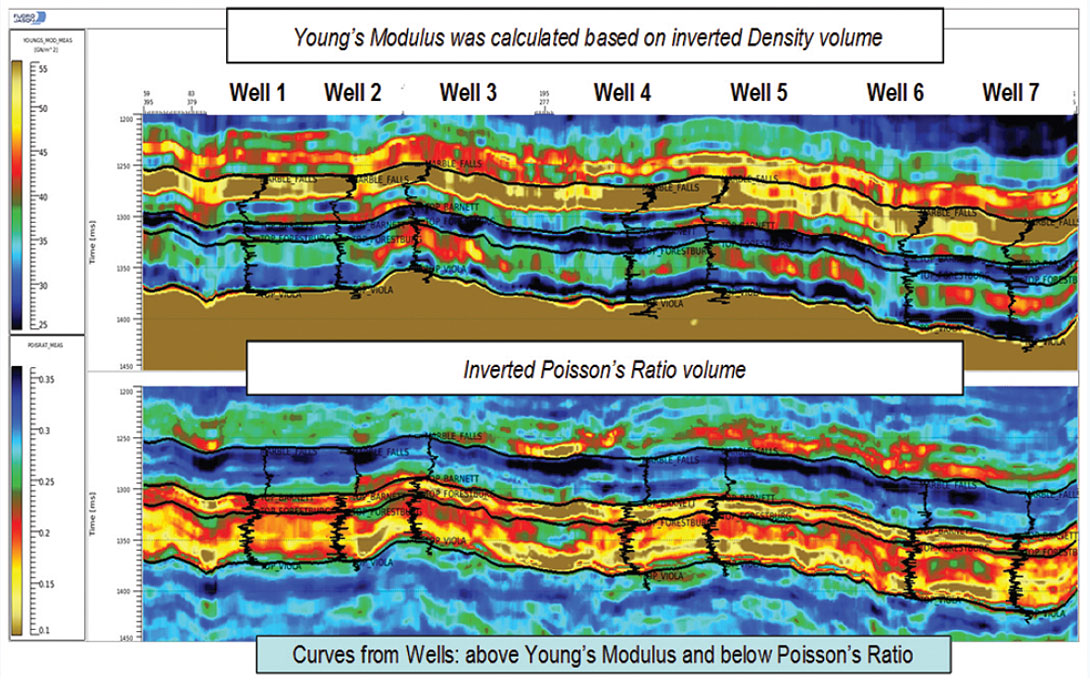
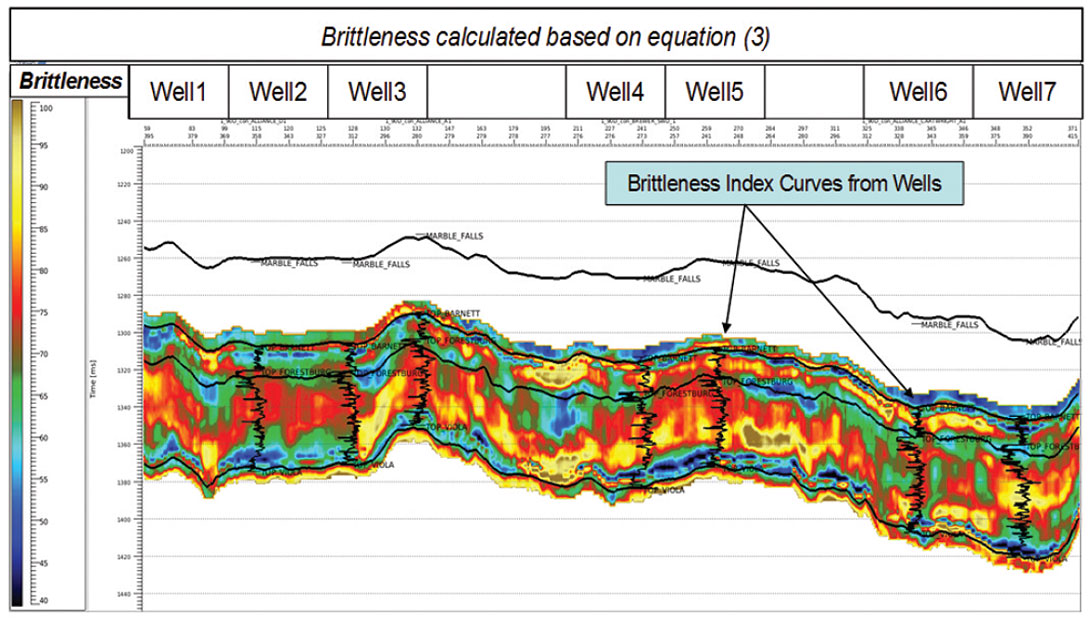
As described above, a set of property cubes were calculated based on the deterministic inversion results. Poisson’s Ratio and Young’s Modulus volumes were computed using equations 1 and 2 (Figure 8). A brittleness seismic-derived volume was then generated using equation 3 (Figure 9). Brittleness was also found to be correlated to the quartz mineral volume (Figure 3).
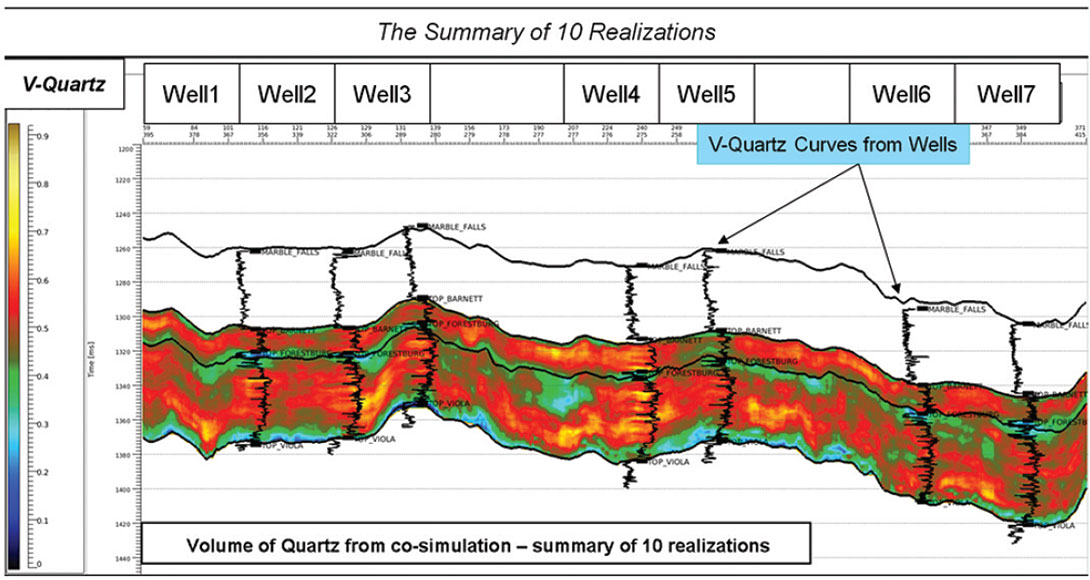
Geostatistical co-simulation was used to create a quartz mineral occurrence volume, using the elastic parameters from inversion (P Impedance, S-Impedance and Density)
The process involved co-simulating Vquartz using the observed correlation with the reservoir properties from inversion. The final result was a volume of quartz obtained from the mean of 10 realizations (Figure 10).
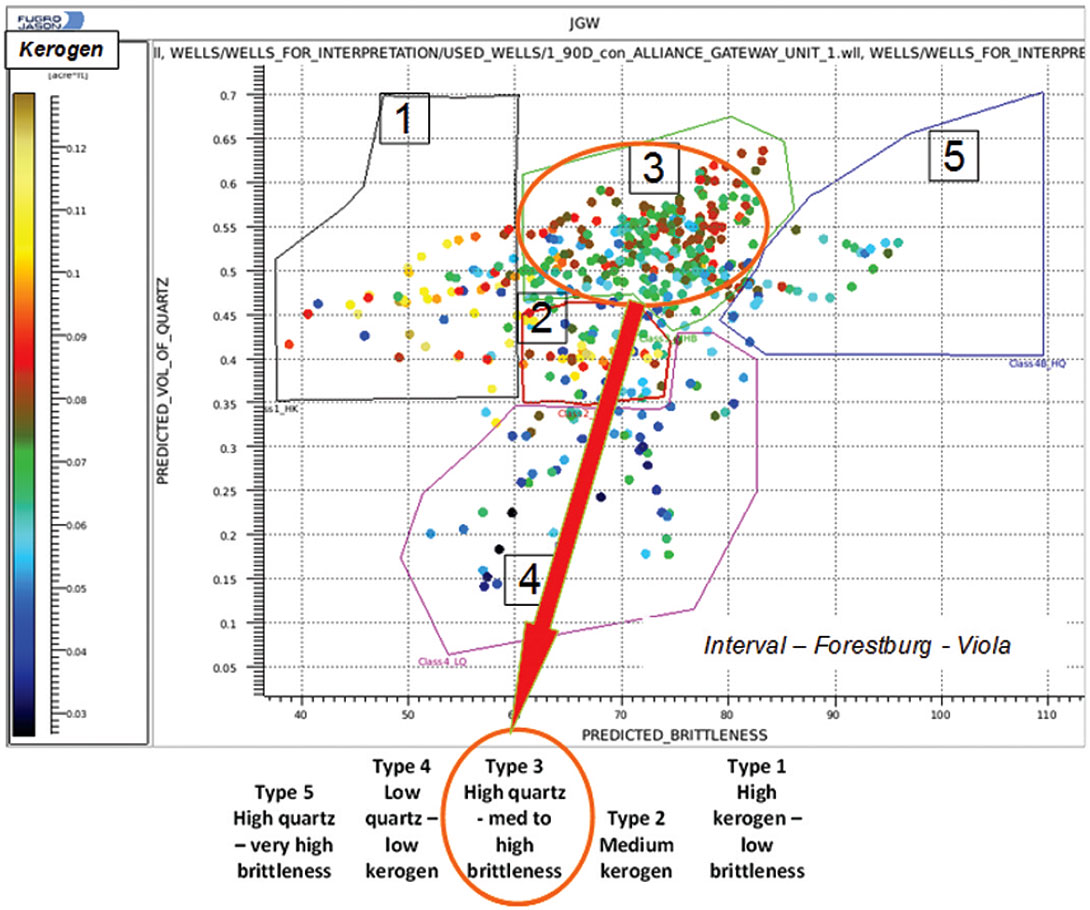
The set of generated property volumes was analyzed and interpreted as shown in the crossplot in Figure 11. A set of lithological/ geomechanical facies were defined based on brittleness, quartz occurrence and kerogen presence. The following facies were identified: 1) high kerogen-low brittleness, 2) medium kerogen, 3) medium to high brittleness-high quartz, 4) low quartz-low kerogen 5) high quartz-very high brittleness. The predicted reservoir is in the type 3 high quartz zone with medium to high brittleness (Figure 11). The very high kerogen zone (type 1) is not favoured because it has poor fracability. Type 5 with very high quartz content was not considered to be suitable because of its low kerogen content.
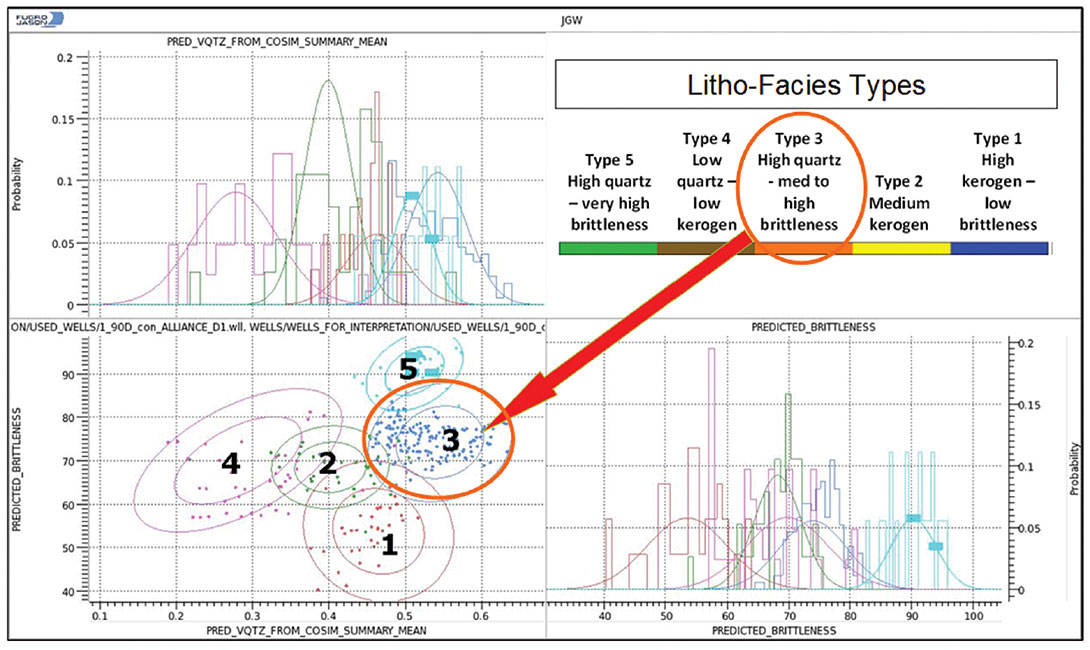
A joint Probability Density Function (PDF) was then created for each lithotype to facilitate a Bayesian probability analysis (Figure 12). The set of PDFs for the lithotypes determines the relative proportions of each lithology. They are inputs to a Bayesian formalism which generates lithology probability volumes from the inverted elastic property volumes. The final result, the most likely facies model, consisted of five distinct lithology probability volumes indicating the estimated occurrence for each of the five defined facies (Figure 13).
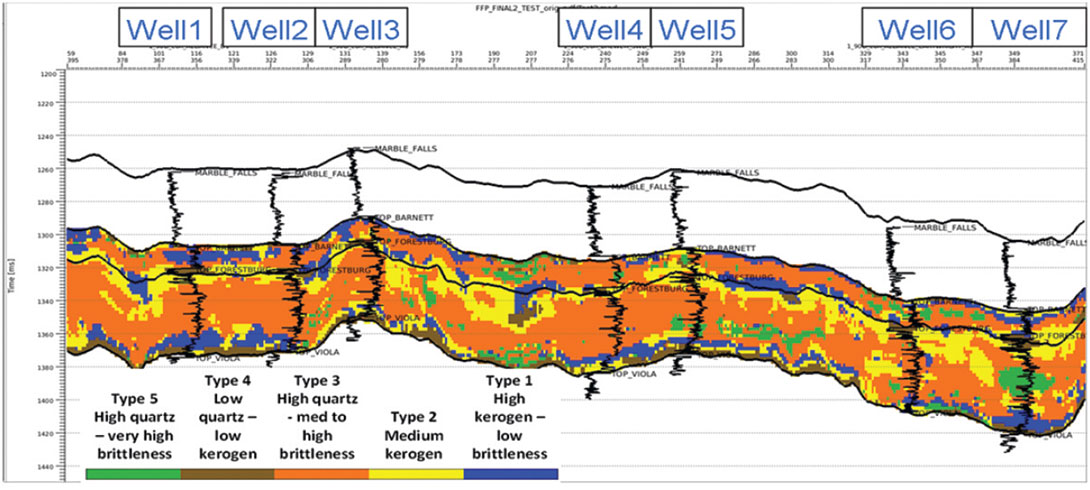
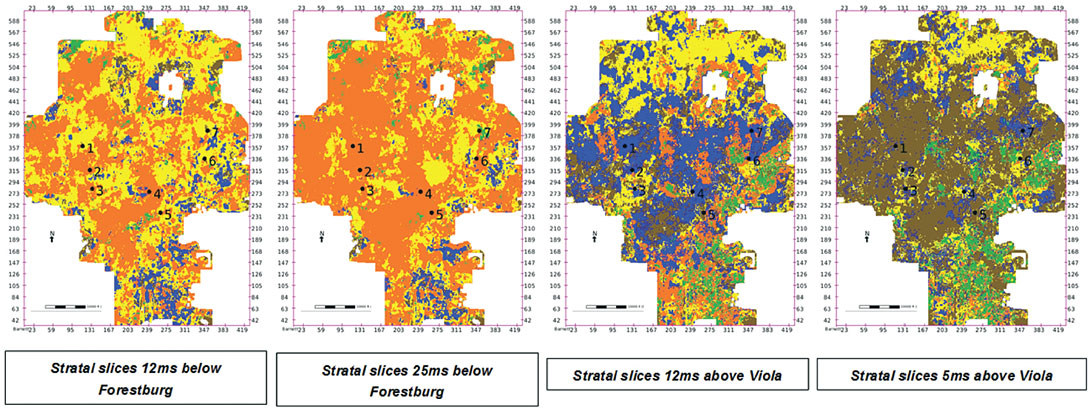
Stratigraphic facies slices where computed through the lower Barnett interval, from the Top Forestburg to Top Viola horizons (Figure 14). The type 3 (high quartzmedium to high brittleness) litho-facies is coloured in orange and represents the zone of greatest exploration potential as the kerogen content is high. Further, the sweetest spots are the areas where the Viola is overlain by the type 1 litho-facies (high kerogen-low brittleness). These rocks are very ductile shales. The ductile shale acts as a seal for the reservoir and can isolate it from the water-bearing Ellenburger formation below.
Results validation
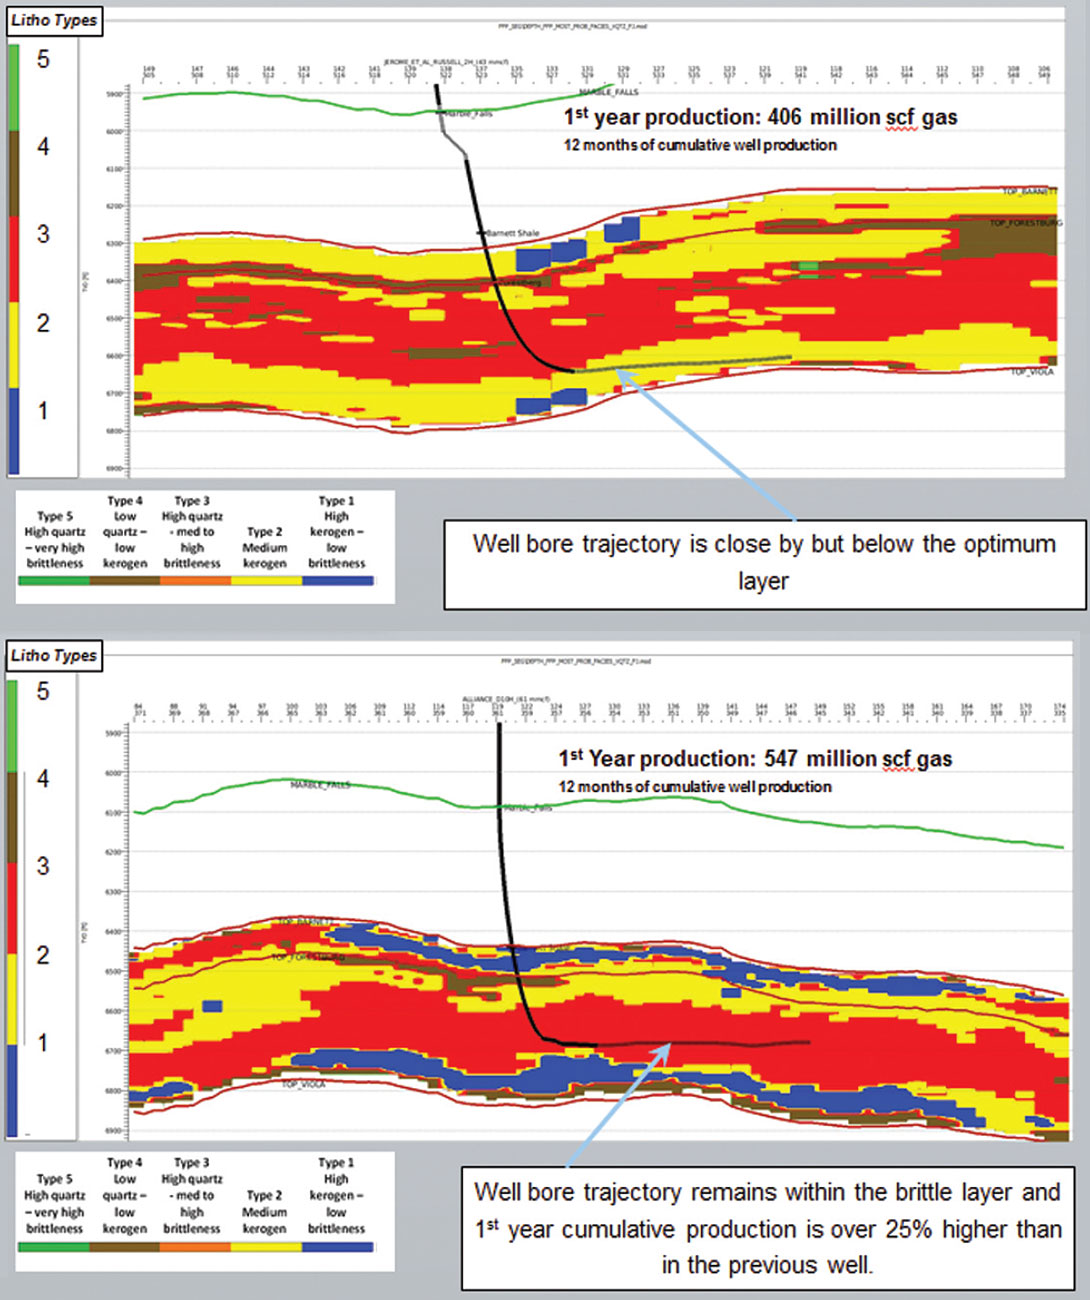
Finally, a 3D model of the five litho-facies was constructed in depth. The data were transformed from time to depth using a reliable interval velocity model calibrated to sonic logs. Then, the facies models were reviewed to see if they could explain the production data from existing horizontal wells. The good production/ frac ratios (obtained from Texas Railroad Commission reports) came from wells where their horizontal paths were well within a layer of litho-facies type 3 and commonly underlain by a litho-facies of type 1 (clay rich ductile shale) as demonstrated in Figure 15. Poor production-to-frac ratios came from wells with laterals either too shallow or too deep.
Conclusions
Reservoir characterization is one of a trilogy of new technologies that can be applied to unconventional shale plays to optimize recoverable reserves and minimize costs. In this paper we discussed a workflow suitable for unconventional shale reservoirs which has proved to result in drilling successes. The Barnett Shale is a complex formation from both a structural and stratigraphic point of view. The integration of well data and seismic inversion sub-products, mainly lithological, geomechanical and structural parameters, can be used to create a 3-D model allowing a better delineation and management of subsurface heterogeneities for drilling and production. This workflow offers huge economic potential for future unconventional reservoirs.

Related Reading


Join the Conversation
Interested in starting, or contributing to a conversation about an article or issue of the RECORDER? Join our CSEG LinkedIn Group.
Share This Article