Summary
Inversion of Amplitude versus Offset (AVO) results can be used to derive elastic rock properties, which can in turn be used for quick determination of lithology and fluid content of reservoirs. In this paper, this approach is illustrated using case histories from a Western Canadian gas-field development, exploration in the Judd Basin in the Faroes-Shetlands area and a combined gas-field development and exploration prospect in Mainland China.
Introduction
Inversion of AVO results may be used to derive parameters proportional to rigidity, μ, and Lamé’s modulus, λ (Goodway et al, 1997). Rigidity, also known as “shear rigidity” or “shear modulus”, is defined as the resistance to a strain that produces a shape change without changing the total volume. It is useful for distinguishing sand quality because it is generally unaffected by reservoir fluids. On the other hand, Lamé’s modulus is closely related to incompressibility, and contains a higher proportion of information about a rock’s fluid content. Incompressibility, also known as the “bulk modulus”, is the resistance to a change in volume caused by a change in pressure, and is the inverse of compressibility.
Method
Both rigidity and Lamé’s modulii can be obtained from prestack seismic data using the method of Goodway et al (1997). More specifically, the actual rock properties that can be derived are λρ and μρ. Currently, the density parameter, ρ, is difficult to derive from the AVO equations using typical seismic data (see, for example, Debski and Tarantola, 1995).
The concepts of incompressibility and rigidity, as expressed by λρ and μρ respectively, help in the understanding of why AVO responses occur because they are fundamental, and hence simple, concepts. For example, the difference between the AVO responses typically observed in sandstones and carbonate rocks can be explained, as follows: Rocks and fluids do not compress very easily. However, gas does compress easily, hence, the presence of gas in a fragile, grain-supported rock, like some sandstones, causes a significant decrease in its incompressibility. Gas in the rock does not affect its rigidity, so the result is a significant AVO response, which depends on the contrast between incompressibility and rigidity. By comparison, the AVO response gas-charged carbonate rocks, like limestone, has usually been observed to be much less significant than that seen for sands and particularly gas-sands. This is because gas in the pores of these rocks is rarely significantly compressed, since almost all the compressive energy of the seismic wave is transmitted through the incompressible, rigid carbonate matrix. Using the concepts of incompressibility and rigidity is useful to assist in understanding the difference in the AVO responses observed in these two different lithology types.
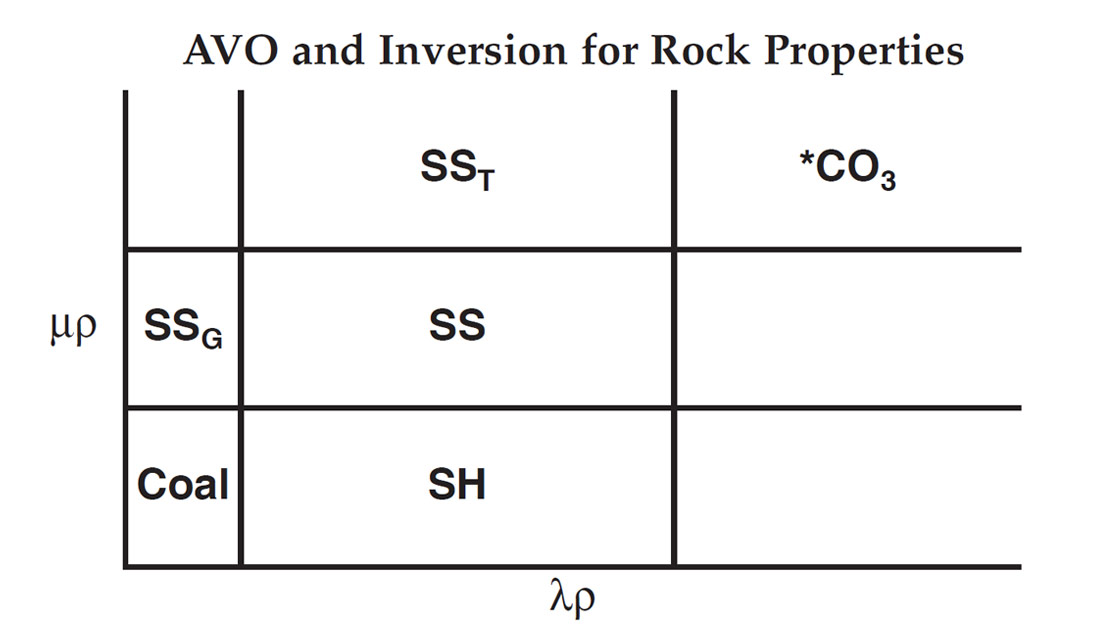
Different types of lithologies tend to separate along orthogonal boundaries in a cross-plot of μρ versus λρ. As a result, these two parameters may be considered independent and can be interpreted separately. In combination, they provide additional information on the nature and content of the rocks and fluids from which they arise. This is a significant improvement over previous techniques for identifying gas accumulations, including cross-plots of S-wave velocity versus P-wave velocity or Poisson’s ratio versus P-wave velocity, where both parameters must be interpreted at the same time. In particular, rock property sections of “Lambda-Rho” (λρ) and “Mu-Rho” (μρ) are interpreted by identifying zones of interest using one of them, and then the other is used to high-grade the original interpretation. For example, zones of low incompressibility (λρ) suggest the presence of gas or coal. Thus, using the additional information available from the rigidity (μρ), gas sands can be more clearly distinguished from coals, because sand has high rigidity and coal has low rigidity (Figure 1). This methodology is demonstrated in the following examples.

Examples
Figure 3 shows sections of λρ and μρ in a fluvial-clastic section over a carbonate unconformity in the Western Canadian Basin (Chen et al, 1998). Two proven gas sands are seen as low λρ (incompressibility) zones, while the carbonate unconformity is clearly seen as a change from low to high values of λρ. Combining the interpretation of the λρ section with interpretation of the μρ section increases the confidence that these anomalies are associated with sands. The relatively high values of μρ indicate that these are likely clean gas-sands, as proven by drilling.
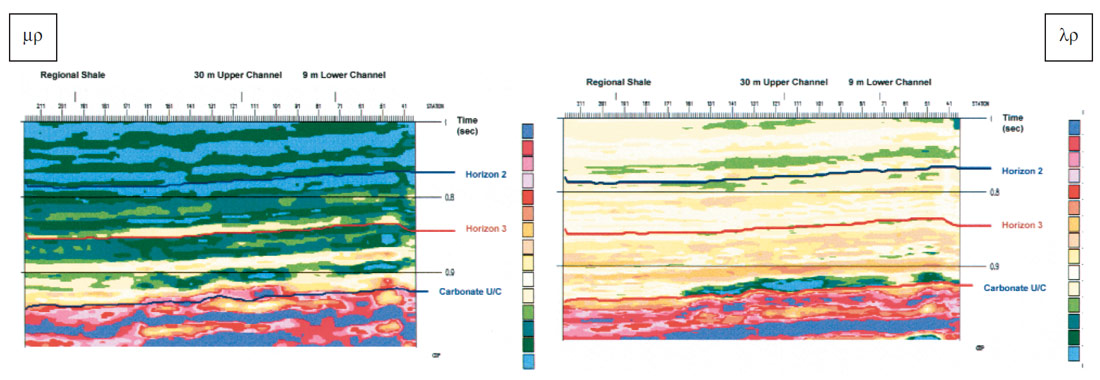
Figure 4 shows λρ and μρ marine seismic sections from the Judd Basin, Faroes-Shetlands. This is a pure exploration play NW of the Foinaven discovery. An important part of the remaining prospectivity in the Faroes-Shetlands region can be expected to reside in stratigraphic closures within the Palaeogene succession (Morgan, 1997). The method of inversion for rock properties allows some estimation of the stratigraphy with the limited well control available in this area.
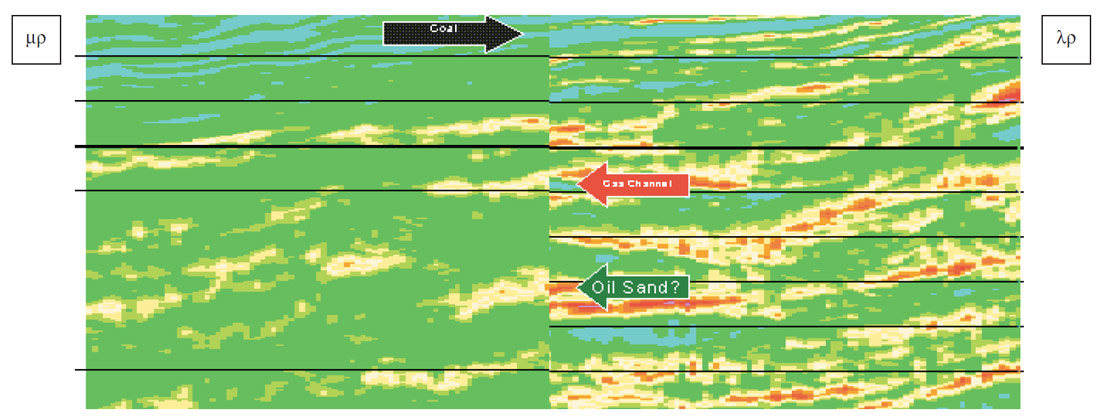
Coals are interpreted in the shallow section from the low values of both λρ and μρ, confirming the expectation of coals interbedded with volcanics from the Faroes. A gas-filled, leveed, sand-channel is interpreted in the middle of the section indicating that it is likely that hydrocarbons have migrated into this area. There are several other zones of high μρ both above and below the interpreted gas-filled channel indicating possible sand bodies, however these are also associated with higher values of λρ. As a result, since there is a strong indication of hydrocarbon migration in the interpreted gas-filled channel, it can be surmised that these potential sands may be oil-filled, and therefore worth testing.
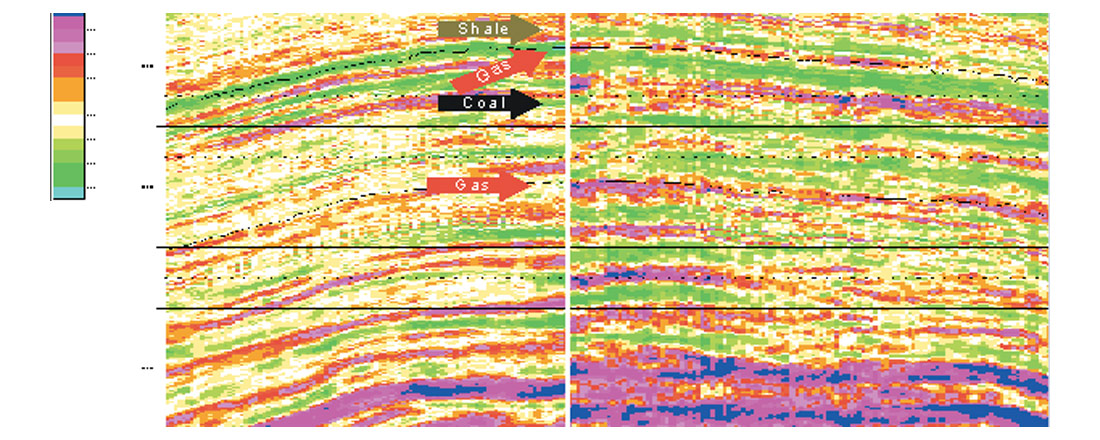
Figure 5 shows an example combining an existing field development with deeper exploration in a gas field in Mainland China. This section consists of lacustrine and channel environments, and is known to contain shale, coal, tight sands and gas sands. Here, the interpretation of λρ alone is insufficient to indicate the presence of the gas sands, because both coal and gas-sands have low values of λρ. However, large areas of low values of λρ indicate the potential for extensive gas sands. Furthermore, higher values of μρ indicate the possibility of sands, but cannot distinguish their fluid content. Indeed, the combination of λρ with μρ indicates the presence of gas sands at known drilled locations, while there are several zones of low λρ associated with high μρ deeper in the section corresponding to potential exploration targets.
Conclusions
Rock properties can be derived from inversion of AVO stacks. These sections greatly reduce the ambiguity for determination of lithology and fluid content. This pays off in faster interpretation, high graded prospects and better reservoir characterization.

Acknowledgements
The authors would like to acknowledge Veritas, PanCanadian and Mr. Wang and Mr. Deng for permission to publish these data, and Mr. Wang Sr., Mr. Wang, Mr. Deng and their staff for assistance in the interpretation of the data from China, Bill Goodway, Nanxun Dai, Taiwen Chen, Diane Lynnes, Kim Head, Hart Janssen and Paul Parsoneau for their assistance in the interpretation and generation of these data and Helmut Jakubowicz for his detailed review and suggestions.


Join the Conversation
Interested in starting, or contributing to a conversation about an article or issue of the RECORDER? Join our CSEG LinkedIn Group.
Share This Article