Summary
Given the prediction that most of Alberta oil production in the 21st Century will come from existing heavy oil fields, there is a growing demand for the synergistic integration of geology, geophysics, and reservoir engineering in order to optimize production from these fields. Effective reservoir characterization and production will require teamwork between geoscience and engineering. This is especially true in the development of heavy oil fields where there are dozens (possibly hundreds) of wells to be combined with 3-D seismic data sets. In this paper, we examine case history examples from a number of Canadian oil fields. We focus on the combined use of engineering and geoscience, while reviewing past results and forecasting future directions.
Introduction
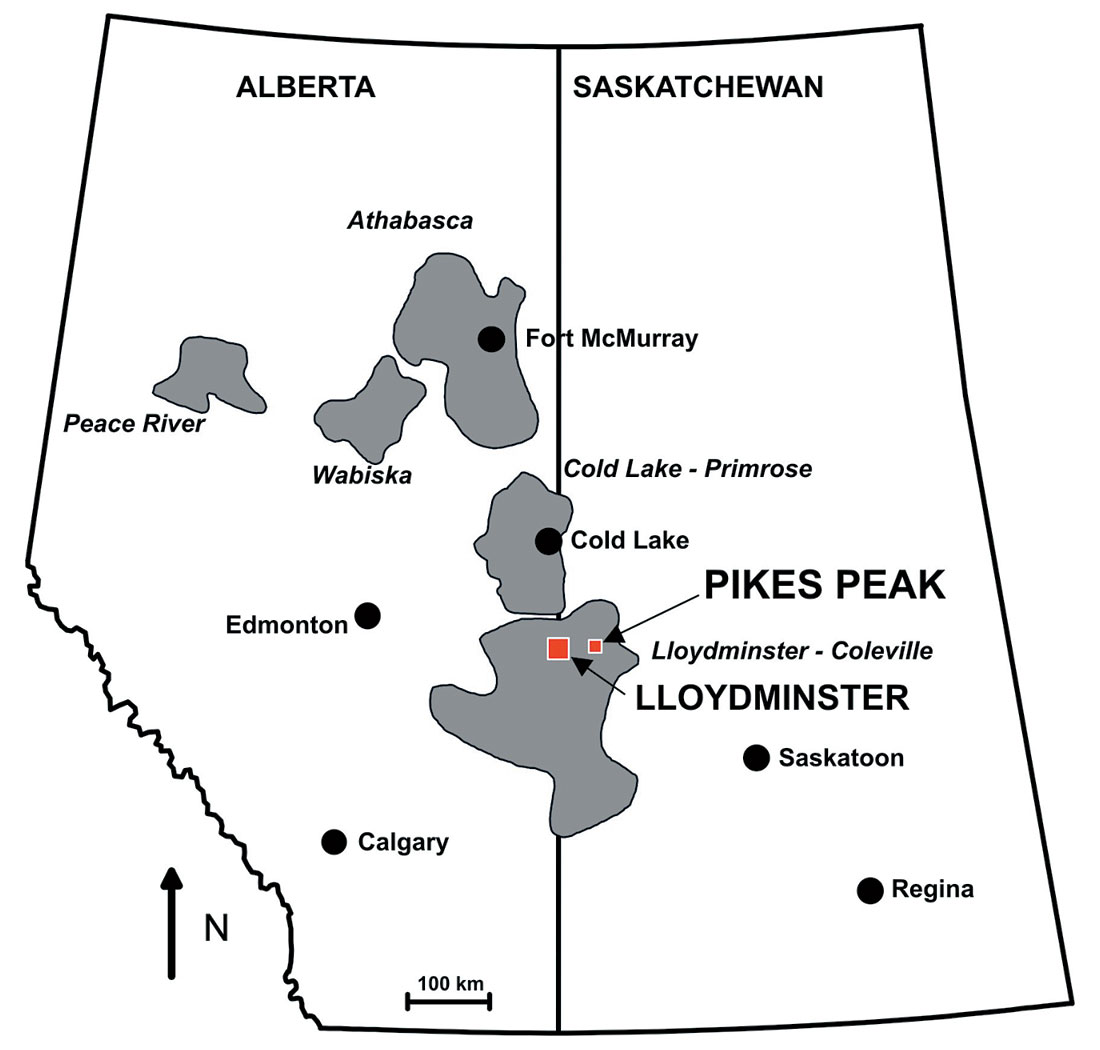
Heavy-oil production represents the majority of long-term petroleum production in Western Canada. The vast reserves in the Athabasca, Wabasca, Cold Lake and Lloydminster areas will undoubtedly be exploited during the coming decades. Figure 1 shows the approximate locations of these fields in Alberta and Saskatchewan. We shall focus primarily on how geophysics will fit into the reservoir development strategy of these oil fields.
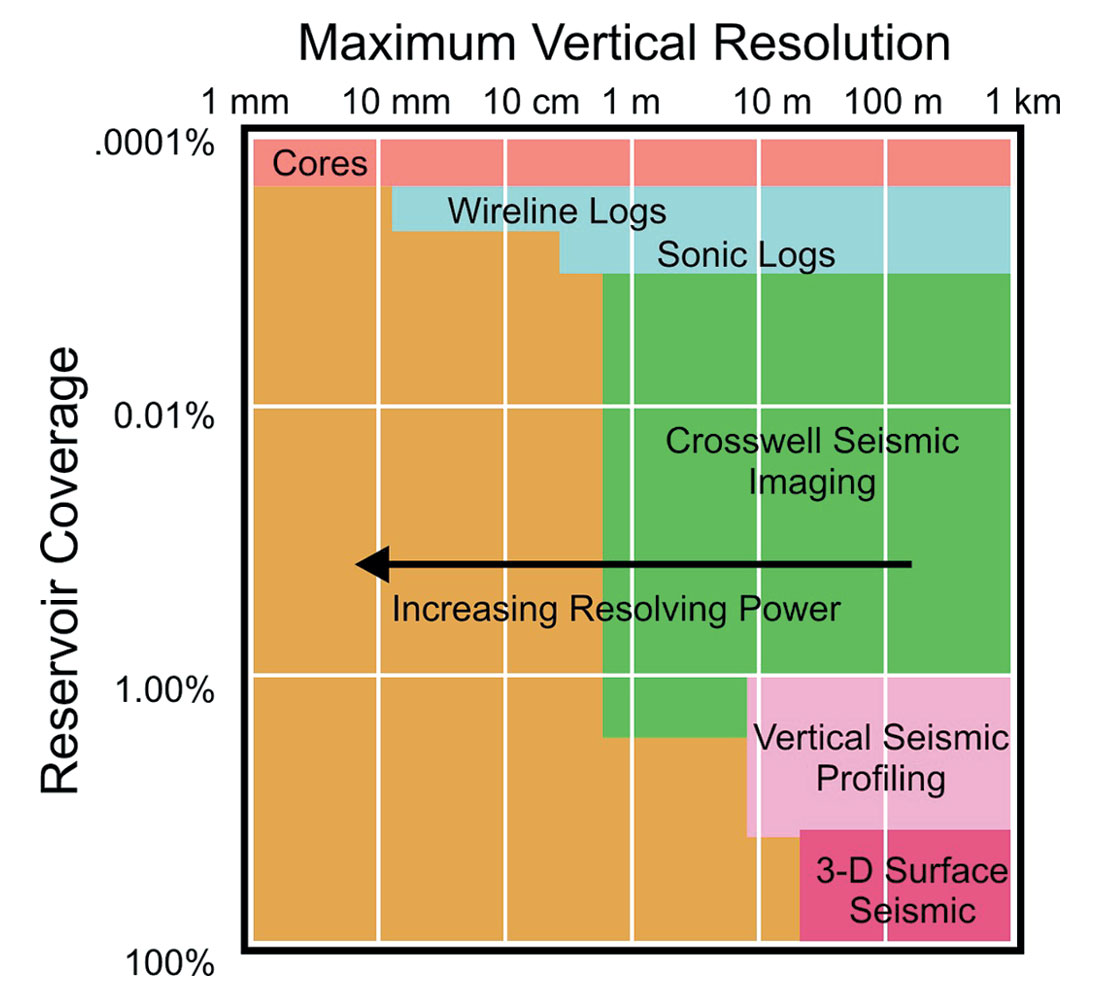
Reservoir characterization attempts to describe the physical properties of oil reservoirs through the use of many different data types. Several sources of geological and geophysical data measure the reservoir volumes at different scales. It is our purpose to integrate these data sets. This goal is illustrated by Figure 2, provided by Harris (2002). The primary tool for probing the entire reservoir is 3-D reflection seismic surveying. While 3-D seismic data cover the entire reservoir volume, the wavelengths are typically 10-100m because most seismic frequencies for surface data are in the 5-100 Hz range. Well logs and core measurements usually are made on the scale of 0.1-1.0 m. Although the scale of resolution is quite fine, the volume of investigation is small, confined to within a few metres of the borehole. To fill in the “missing wavelengths” between borehole data and surface seismic data, we can acquire borehole seismic data. Such data, gathered by using seismic sources and receivers to fill the wavelength gap, would include vertical seismic profiling and cross-borehole seismic surveys. The key is to characterize the reservoir’s physical properties by integrating the various data sets with different wavelengths.
Methodology
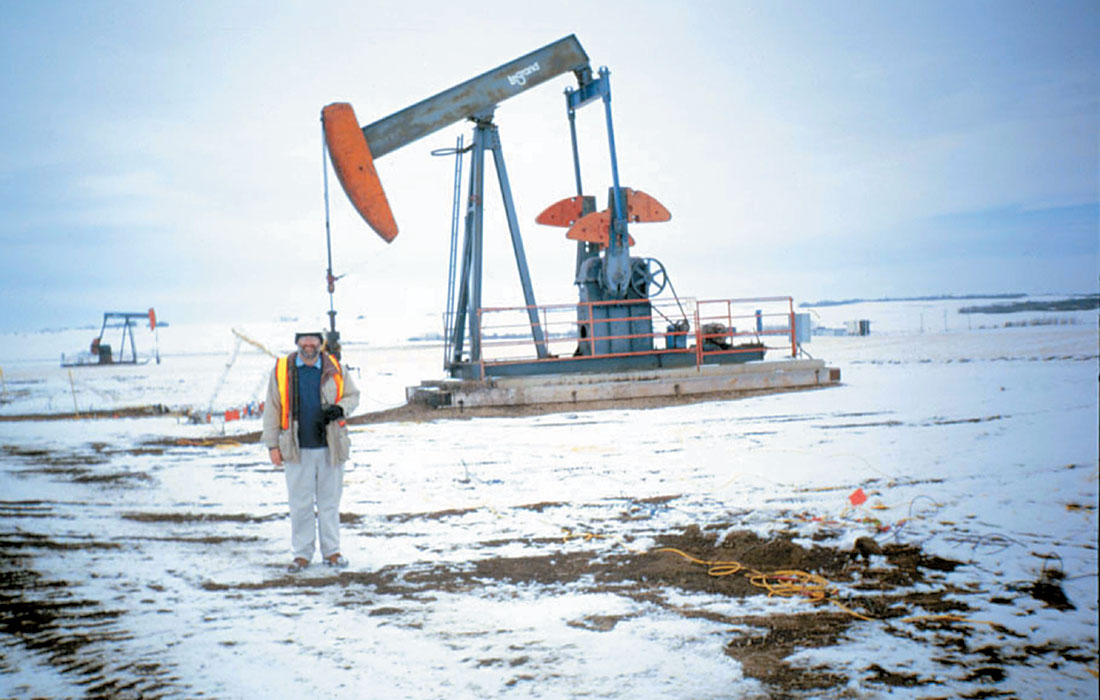
Generally, we try to resolve the changes in the reservoir as a function of the production processes. Hence, we repeat the seismic survey, keeping the acquisition and processing parameters as constant as possible so that changes in the seismic response will reflect reservoir changes (no pun intended) during the production process. Seismic surveys must generally be acquired over producing fields during the production processes. Figure 3 is a photo of Larry Lines participating in a multicomponent seismic survey at Husky Energy’s Pikes Peak field. Here the goal was to map steam injection fronts during the production of heavy oil from the Waseca Formation. The time-lapse seismic method becomes an enhanced oil recovery tool in which production processes such as infill drilling and steam injection can be adjusted according to reservoir changes.
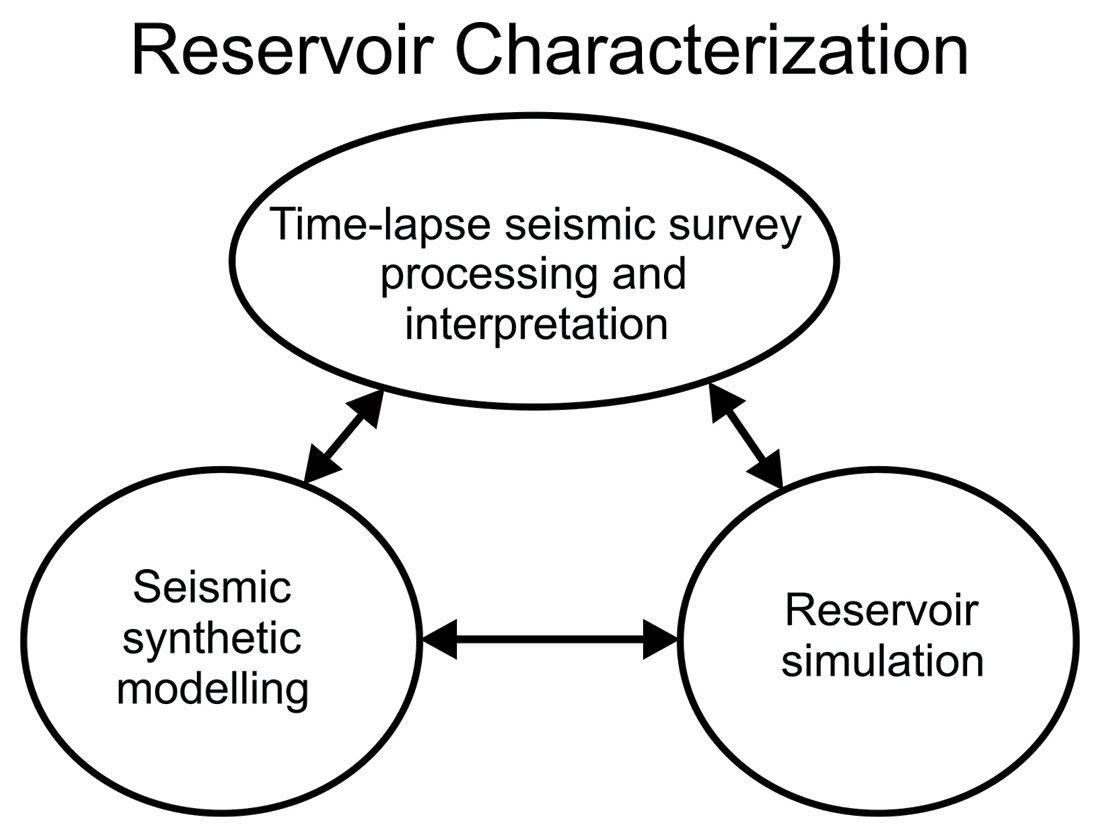
The role of geophysics and reservoir simulation in reservoir characterization is illustrated in Figure 4. Much of our geophysical work involves the acquisition, processing and interpretation of seismic data. Generally, the seismic surveys are repeated so that we may see the changes in the reservoir. The repetition of seismic surveys results in “4-D” or time-lapse seismology, where we examine differences in the seismic data over time. Hopefully, these differences exhibit reservoir changes. Eventually we wish to produce a seismic model whose response (the synthetic seismogram) matches the time-lapse seismic data. These models of seismic velocity and density can then be converted into earth models of porosity, permeability and temperature change. Ultimately, we would hope to link together the seismic data, the seismic model and the reservoir model.
Results and Conclusions
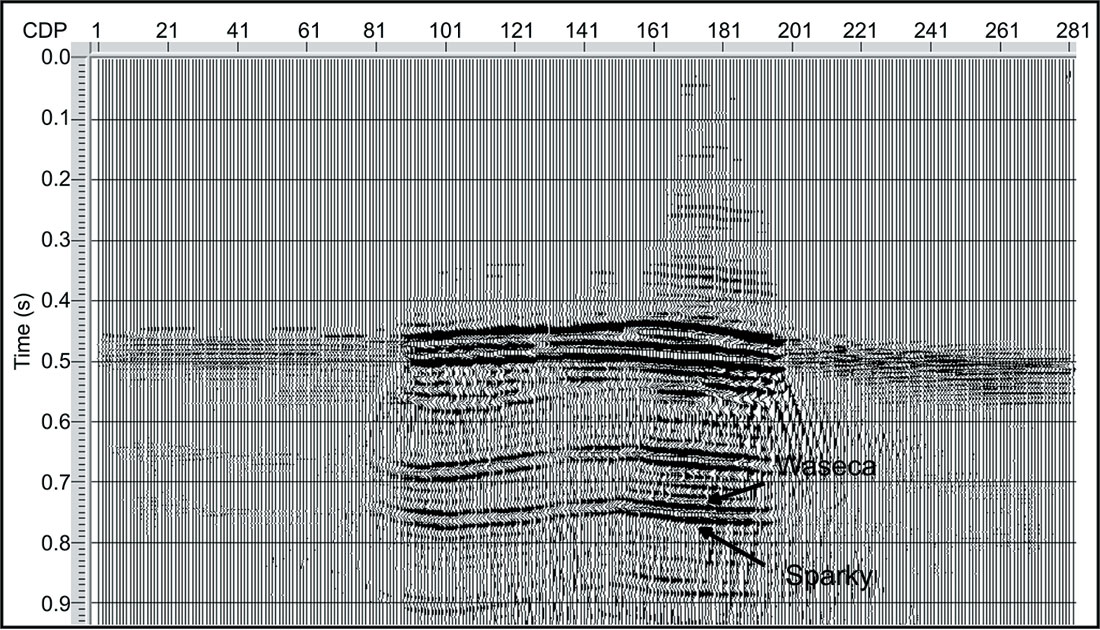
As illustrated by Figures 5 and 6, we see encouraging results in the area of heavy oil field reservoir characterization. Figure 5 shows a seismic reflectivity difference section from Watson et al. (2002). This difference section from the Pikes Peak field near Lloydminster, Saskatchewan was obtained by differencing seismic surveys completed in 1991 and 2000 in order to show the effects of steam injection into the Waseca heavy oil sands. A large difference is seen in the circled zone of interest.

Figure 6 shows the differencing of synthetic seismograms for 1991 and 2000 seismic models, as presented by Zou et al. (2003). The encouraging agreement between the model responses and the real data indicates that our seismic model is probably realistic. Following a successful modelling of the seismic data, Zou et al. (2003) then developed a reservoir steam flow model. This modelling is described in detail by Zou et al. in this issue of the RECORDER. In essence, this is the goal of the reservoir characterization procedure shown in Figure 4.
Our research in heavy oil fields has involved the use of seismic monitoring over fields that involve both hot and cold flow production. In both cases, we see a growing need for extensive use of multicomponent time-lapse seismology. In the case of monitoring steam injection, interesting applications were summarized by Watson (2004). Watson’s thesis compared several methods of seismic monitoring, including reflectivity differencing, impedance differencing, and the computation of Vp/Vs ratios from multicomponent data. A case is made for the extensive use of multicomponent methods for mapping sand content and steam fronts.
In cold production of heavy oil, seismic monitoring can be used for mapping both wormholes and foamy oil production. Mayo (1996) was among the first to show the seismic anomalies created by foamy oil and wormholes during cold production. In recent years similar applications have been described by Lines et al. (2003), Chen et al. (2004), and Zou et al. (2004) in this new and challenging area of applied seismology. Tremblay et al. (1999) and Sawatzky et al. (2002) have described the physics of cold production footprints and have laid the groundwork of reservoir characterization in cold production problems. Although much remains to be done in the integration of petrophysical and geophysical methods to map subsurface changes, the initial findings of Chen et al. (2004) suggest that multicomponent seismology holds considerable promise.
Some intriguing examples of the effects of cold production on seismic responses, in which reservoir production is related to seismic anomalies, are shown by Zou, Bentley et al. (2004 and this issue).
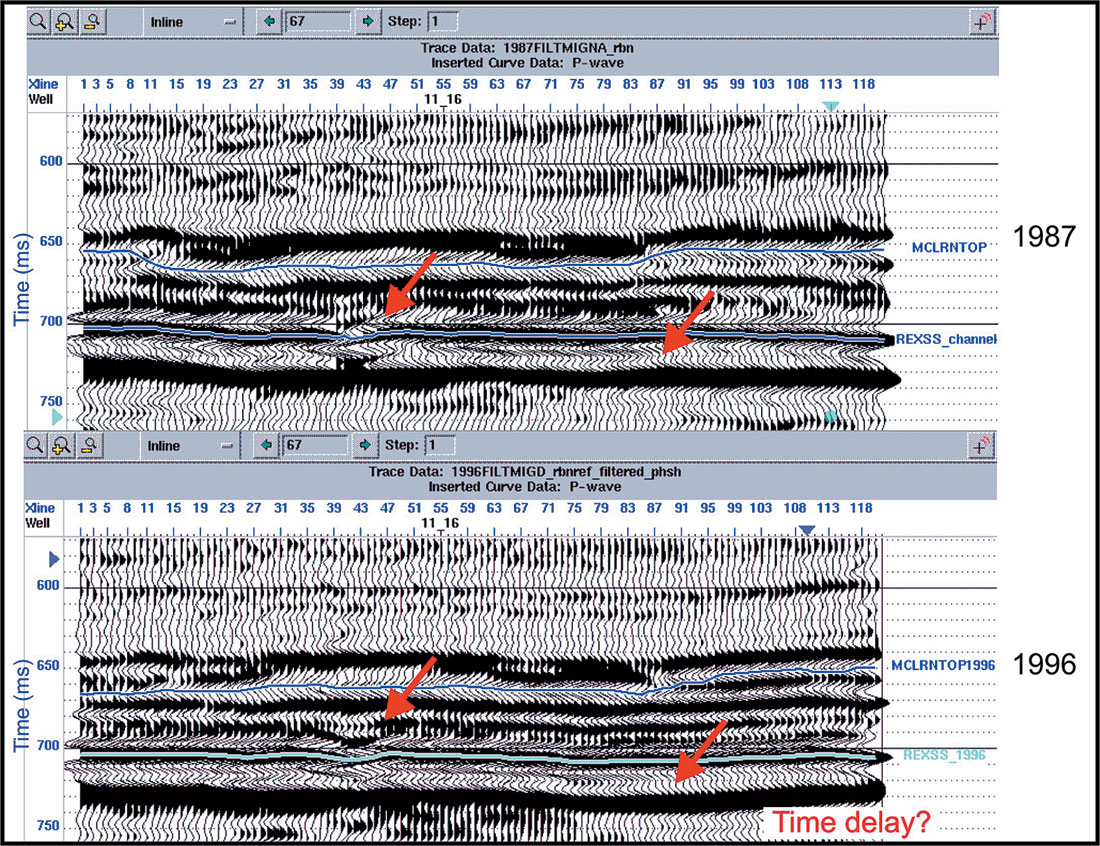
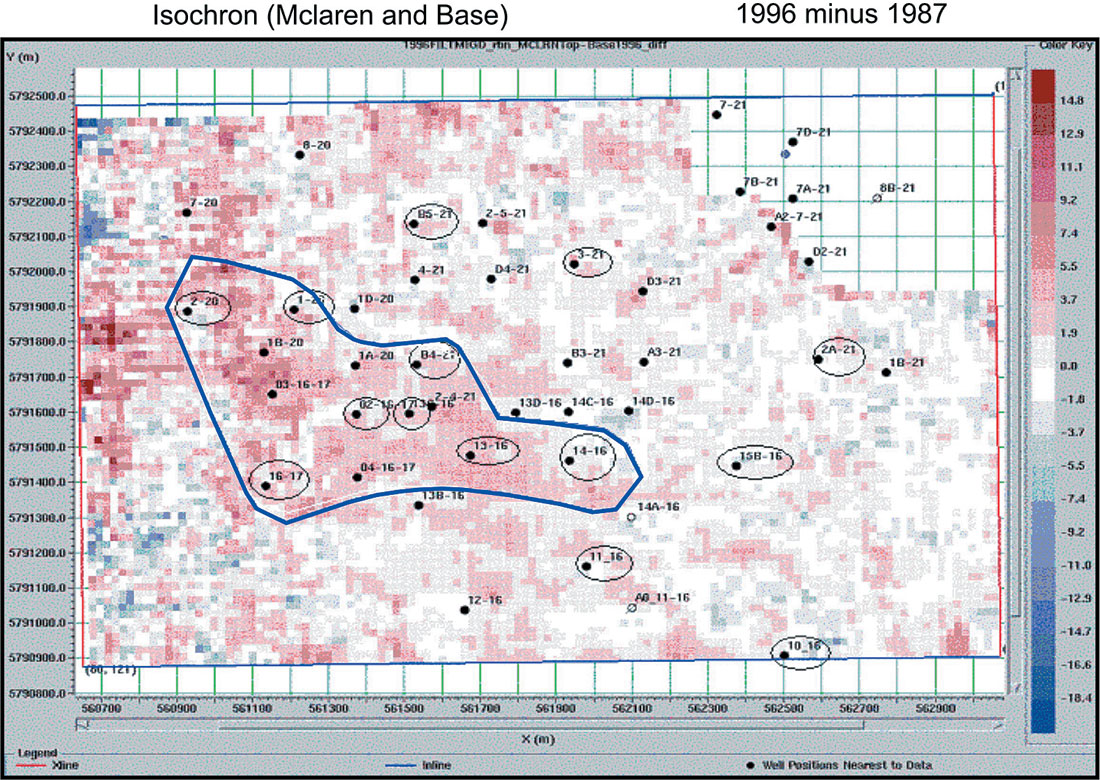
Figure 7 shows a subtle contrast between seismic sections recorded in 1987 and 1996 over an Upper Mannville sand channel for a field in Eastern Alberta. There appears to be a time delay in the later survey as a result of the cold production process. This delay is confirmed by isochron maps for the interval between the Top of the Maclaren reflector and the Rex SS, as indicated on Figure 7. If the isochron maps are differenced for the two vintages of data, we note travel time delays for the wells under production, as shown in Figure 8. The time delay can be attributed to the presence of foamy oil or wormholes created by the cold production process. Both of these effects will tend to decrease the P-wave velocity, as shown by Chen et al. (2004).
In both hot and cold production, Zou et al. (2004) show that we need to integrate geophysics and reservoir simulation models for a complete description of the reservoir. Zou’s work maps out the future for integration of geoscience and reservoir engineering in reservoir characterization.
Reservoir characterization is an evolving science. There is a constant need for integration and “closing the loop” between geoscience and reservoir engineering. Developments that have occurred in recent years include the following:
- Integration of borehole and seismic information in the development of reservoir simulation models.
- Increased use of AVO (amplitude variation with offset) methods.
- Optimized use of multicomponent seismology. • Development of reservoir simulation models from geophysical and geological data.
Conclusions
An exciting feature of reservoir characterization is that we are continuously able to prove or disprove our models due to the dynamic flow of information from production. Also, there should be a constant feedback between the seismic modelling and processing and the reservoir simulation. Given the vast heavy oil reserves in Western Canada, there will be a great need for heavy oil reservoir characterization for many years to come.

Acknowledgements
The authors thank the Coordination of University Research for Synergy and Effectiveness (COURSE), and the Consortium for Heavy Oil Research by University Scientists (CHORUS). We acknowledge the contributions to our research made by the Alberta Research Council with special thanks to Dr. Ron Sawatzky for his valuable suggestions and discussions. Finally, we thank Dr. Helen Isaac, who encouraged us to publish this paper in the CSEG RECORDER and helped prepare the manuscript.


Join the Conversation
Interested in starting, or contributing to a conversation about an article or issue of the RECORDER? Join our CSEG LinkedIn Group.
Share This Article