“Drill, baby, drill!” It’s an often quoted line, made famous by former US Vice-Presidential candidate, Sarah Palin. For those of us who work in the field of engineering geophysics, the mantra should be “drill sparingly, baby, drill sparingly”. While there is no substitute for direct sampling of the ground, the goal of a good engineering geophysics survey should be to provide enough indirect evidence to reduce the need to drill boreholes or excavate test pits, and in so doing minimize environmental impacts.
Construction engineering involves the designing, planning, construction, and management of physical infrastructure, which may include roads, bridges, buildings, dams and utilities. All of these types of facilities have a physical footprint that requires some type of modification of the ground, whether that involves the insertion of anchors, ground compaction or excavation. They are also subject to potential geohazards including, seismic, landslide and flooding hazards.
Most construction engineering projects generally require information on subsurface ground conditions to maximum depths of only 50 metres (m) or so below the ground surface. This zone can encompass soil, groundwater, unconsolidated sediments, weathered rock, and competent bedrock. It can also contain products of our own invention, including utilities, buried waste, and contaminants. Typical parameters of interest to designers and engineers are the thickness and extent of layers, the physical properties of layers and any variability within them, and any structures within the ground. Having an understanding of what lies beneath before breaking ground can save significant costs to a construction project.
Geophysical methods have been a part of the construction engineering toolbox for decades (e.g., seismic methods for foundation design; Peck et al., 1974) and, although adoption of the technology over this time has been slow, their use on major infrastructure projects has now become routine. New developments in instrumentation and methodology have enabled geophysical data to be acquired over increasingly larger areas, at greater density, and in more dimensions (including time). With these advancements, it has become possible to obtain non-invasive, spatially continuous measurements of the subsurface, which can be used to interpolate between and extrapolate from boreholes, geological exposures, and excavations.
Here, we summarize just a few examples of the application of various geophysical methods to construction engineering projects. Our intention is to show a broad array of engineering geophysical methods and applications using clear examples. These examples include geophysical assessments for foundation design, mapping overburden and soil thicknesses for site grading and volumetric calculations of expected construction fill and spoil, characterizing geology beneath waterways for optimizing pipeline crossings, and mapping potentially hazardous abandoned mine workings.
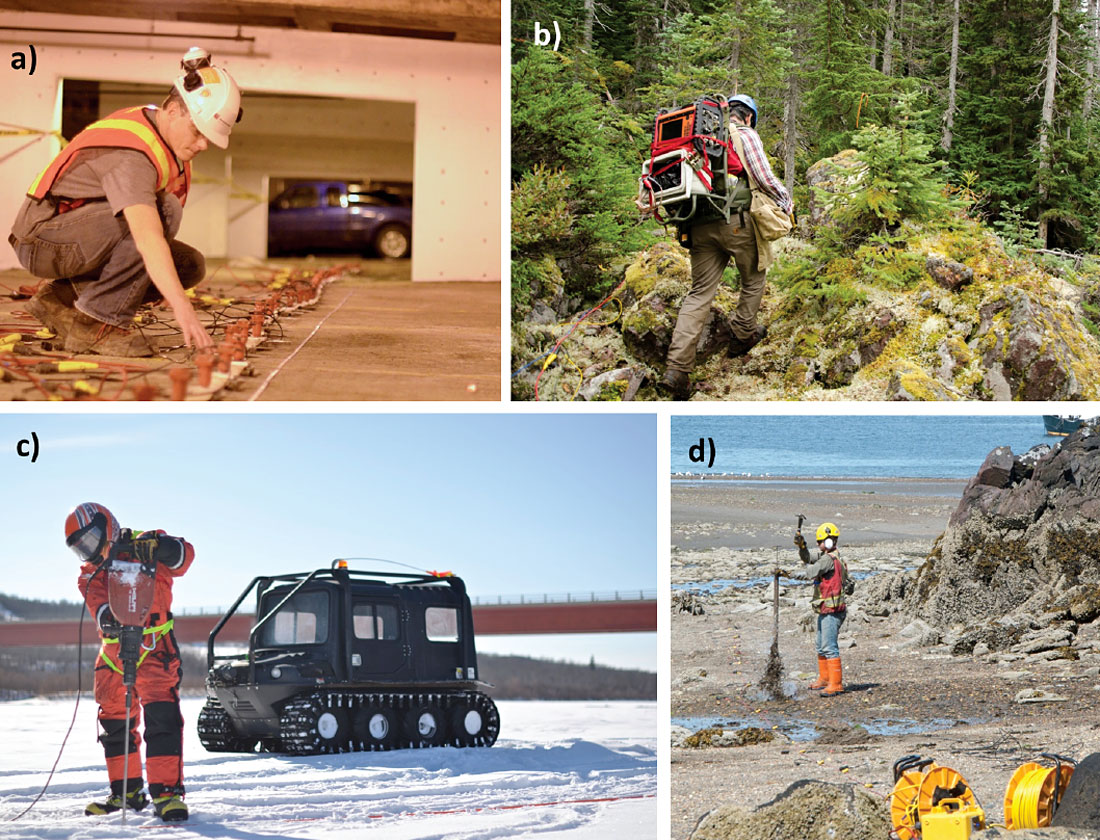
One of the biggest challenges in our line of work has been to adapt geophysical survey methods to an increasingly diverse range of environments. A typical engineering geophysics survey may take place anywhere from a parking garage, to a frozen river, to remote mountainous or coastal locations (Figure 1). In meeting these challenges, equipment has had to become lighter and more durable, and new technology and surveying methods have been developed to facilitate obtaining geophysical information in areas that may not have been accessible previously, or would have required significant environmental disturbance. To demonstrate these advances, we also show examples of how new and innovative approaches have been incorporated into engineering projects.
Seismic Surveys for Geotechnical Site Characterization
Geotechnical site characterization is a term used to describe the process of understanding soil, bedrock, and groundwater conditions at a proposed construction site. For major infrastructure projects like dams, bridges, and plant sites, it is an essential practice for determining the feasibility of a site and for establishing the most cost-effective design of the infrastructure. Geotechnical site characterization normally includes the drilling of geotechnical boreholes and the excavation of test pits to sample subsurface soil, rock, and water properties. From these data, a site model can be produced that establishes the likely thicknesses and extents of subsurface layers and their physical properties.
On uncomplicated sites with layer-cake geology, a reliable geotechnical site model can be produced from a few sparse boreholes. With increasing geological complexity, a greater density of boreholes is required to properly characterize the site, resulting in increased environmental impacts. Geophysical methods have thus become attractive for site characterization projects because they can fill in the gaps between boreholes without disturbing the ground and at a much lower cost than for an expanded geotechnical drilling program. Moreover, geophysical surveys can be conducted prior to a drilling program, with the goal of optimizing locations for subsequent boreholes.
Seismic methods are most commonly utilized for geotechnical site assessments because seismic velocity measurements can be used to infer soil and rock strength. Seismic refraction and multichannel analysis of surface wave (MASW) techniques are complementary and can provide independent measurements of compressional (P-wave) and shear (S-wave) velocities using the same survey design. For both methods, data collection is achieved using a linear array of geophones and a seismic source. While the seismic refraction method involves measuring the travel-times of the first-arriving P-waves, the MASW method is based on analysing the frequency-dispersion characteristics of the Rayleigh waves, which can be generated by the same seismic source (see Park et al. (1999) for a detailed explanation of the method). Tomographic inversion software packages (e.g, Rayfract or SurfSeis) are then used to produce 2D models of P-wave and S-wave velocities.
Reliable measurements of P-wave and S-wave velocities can also be obtained by completing downhole seismic surveys within boreholes. These measurements provide valuable ground truth to seismic velocity models determined from seismic refraction and MASW surveys. Moreover, they can be completed within existing boreholes purposed for geotechnical sampling, allowing for direct correlation with lithology logs. For geotechnical boreholes that extend over depths shallower than about 30 m, a standard downhole seismic surveying approach involves advancing a 3-component geophone within the borehole, and measuring the arrival time of P-wave and S-wave energy generated at the ground surface. Care must be taken to ensure that the borehole is completed to allow downhole seismic data to be measured accurately, by either leaving the borehole open or installing PVC casing using a grout that mimics the properties of the formation.
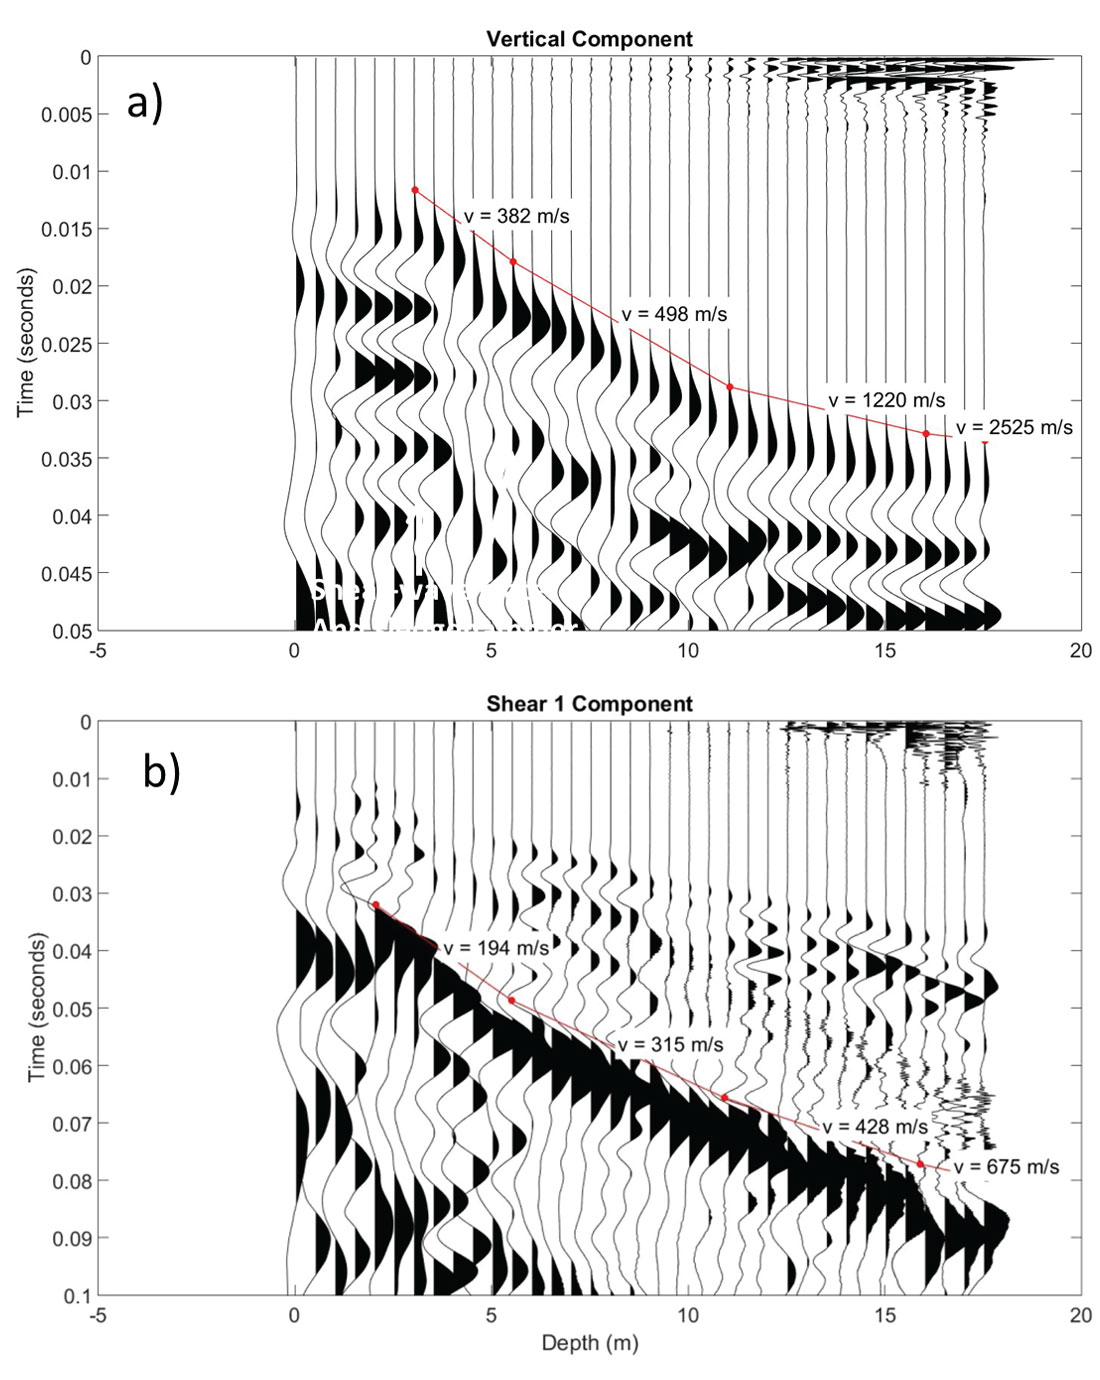
Figure 2 displays typical P-wave and S-wave downhole seismic records, measured from the proposed site of a natural gas pipeline compressor station (both logs were measured within the same borehole). Analysis of these data is fairly rudimentary and involves simple slope fitting. While downhole seismic testing of this type has lower vertical resolution than crosshole approaches that measure travel times between holes, the analysis is straightforward, less prone to error, and the field surveys do not require a second borehole to be drilled at significant additional expense. Furthermore, for most infrastructure projects, engineers typically only require an estimate of average soil and/or bedrock velocities.
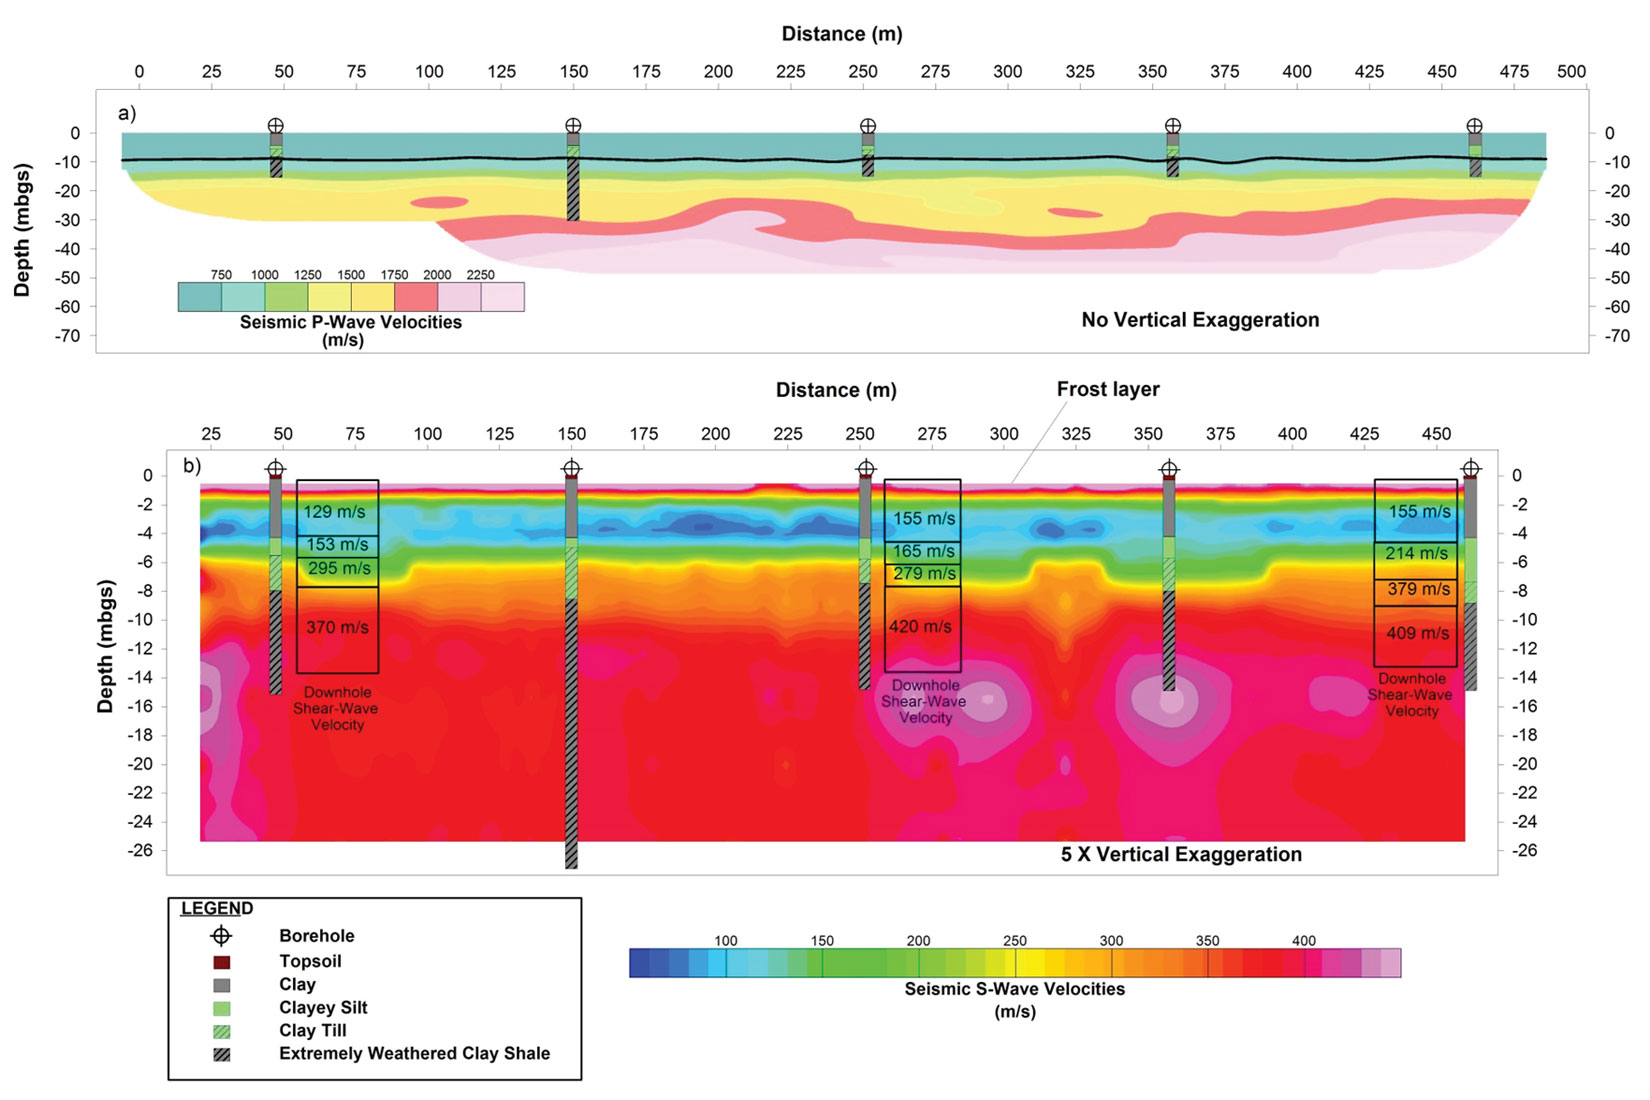
An example of surface and downhole seismic testing methods used in combination for site characterization is shown in Figure 3. In order to provide design recommendations for new processing plant infrastructure for a potash mine, an integrated geotechnical and geophysical assessment was completed. Seismic refraction and MASW data were acquired simultaneously along two 500 m long profiles that traversed the footprint of the proposed plant site. To sample the low-frequency Rayleigh waves and to measure first breaks accurately, the surface seismic data were recorded using geophones with a natural frequency of 4.5 Hz. For a first-order understanding of bedrock elevation and soil properties, geotechnical boreholes were drilled at intervals of approximately 100 m.
The resulting P-wave and S-wave velocity cross-sections are shown in Figure 3. Based on correlation with borehole lithology logs and confirmatory downhole seismic tests, the top of extremely weathered clay shale bedrock is effectively flat and exhibits no incised channels that would impact foundation designs. In addition, the velocity cross-sections and downhole seismic data show that the shallow shale bedrock has relatively low strength, with P-wave and S-wave velocities of less than 2000 m/s and 500 m/s, respectively. The seismic data can also be used to determine estimates for soil and bedrock elastic moduli that would otherwise be derived from lab testing of borehole samples. In particular, Poisson’s ratio can be calculated directly from the P-wave and S-wave velocity measurements, which can then be compared with laboratory derived estimates.
By having a robust understanding of the bedrock elevation profile and the strength of the bedrock, engineers can proceed with designing foundations and the ground modifications required for the site-specific infrastructure. For example, in this setting large, heavy storage tanks would require removal of top soil, compaction of ground and the use of piles to eliminate the risk of structural failure by differential settlement. In contrast, infrastructure with lighter loads may only require slab foundations. Without the geophysical data, the project engineers would likely have to consider an expanded drilling program in order to achieve the level of confidence required to proceed to the design phase.
Non-Seismic Surveys for Geotechnical Site Characterization
In addition to more traditional seismic methods, other geophysical techniques can be used to evaluate site conditions prior to designing physical infrastructure. On many proposed construction sites, seismic methods may not be suitable or cost effective. For example, in areas of rough terrain with poor seismic soil coupling (e.g., wetlands or boggy areas), acquiring seismic data can be impractical. On such sites, alternative methods like electrical resistivity tomography (ERT) can provide valuable information on bedrock depths and overburden properties.
The ERT method involves injecting electrical current into the ground through a pair of electrodes and measuring the resulting potential differences via another pair of electrodes. By varying the locations and spacing between electrodes, measurements can be obtained for different spatial locations and depths. Recent developments in the form of multicore cables and multichannel acquisition ERT systems now make it possible to rapidly acquire thousands of measurements along arrays of electrodes to depths of greater than 200 m. Inversion algorithms can then be used to solve for a 2-D (or 3-D) electrical resistivity model of the subsurface that best fits the measured data.
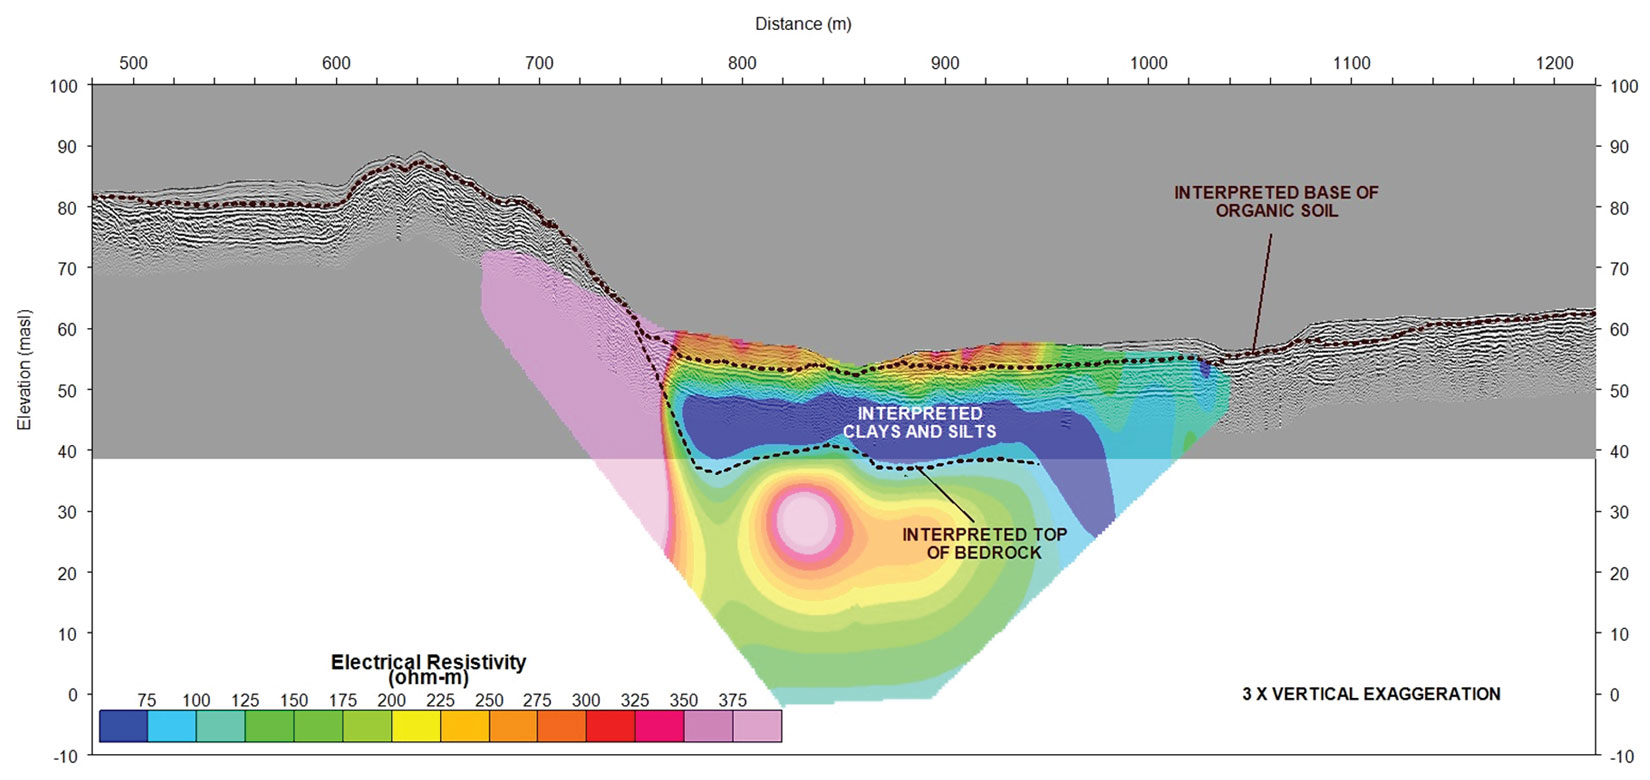
Figure 4 shows an example of using ERT for bedrock and soil mapping for characterization of an approximately 20 hectare site in northwestern British Columbia. The remote location, complex geology, and rugged terrain made it extremely challenging to obtain the required subsurface information at the Site through remote sensing or intrusive drilling techniques. Because the site was also covered in large part by environmentally sensitive bogs and peatlands for which seismic geophone coupling was predicted to be poor, it was deemed impractical to use seismic methods as the primary geophysical investigation technique. For these reasons, a combination of seismic and ERT profiles were acquired in advance of an intrusive drilling program. In most places, the gneiss and schist metamorphic bedrock could be distinguished on the basis of relatively high electrical resistivity relative to the overlaying low resistivity clay and silt overburden. Furthermore, the resistivity cross-sections could also be used to differentiate between the relatively resistive organic soils overlaying the clays and silts (Figure 4). By integrating the interpreted ERT data with results from a few sparse seismic lines and lithology logs from a subsequent borehole drilling program, bedrock elevation could be more accurately determined across the site.
In addition to establishing bedrock elevation, further information was desired on the approximate volume of construction fill and spoil that would result from proposed ground level modifications at this site for site grading. A detailed understanding of the spatial variability and thickness of peat (organic soil) was also required to obtain accurate estimates of spoil volumes and to evaluate changes in hydrology associated with their removal.
Provided the pore water is not overly saline, ground-penetrating radar (GPR) is an excellent tool for mapping organic soil. This is because water saturated peat has such a high water content (and consequently high dielectric contrast) relative to the underlying mineral soil, and this boundary is usually clearly distinguished as a high-amplitude reflection on GPR reflectivity sections (e.g., as shown in the gray scale background image in Figure 4). In addition, recent developments in GPR rough terrain antenna systems and their integration with GPS units now make it possible to acquire kilometres of GPR data over densely vegetated, mountainous terrain, without the need to clear line paths, as may have been required for less robust earlier versions of the technology (Figure 5a).

Approximately 200 line km of GPR data were acquired at the site, along lines with an approximate spacing of 20 m. From the processed GPR cross-sections, the organic soil/mineral soil horizon was picked (e.g., Figure 4) and converted to depth, based on an estimated average velocity for the water saturated peat. A portion of the resulting interpolated organic soil thickness map is shown in Figure 5b and shows the significant variability over the site, from areas with little to no organic soil, to thicknesses of nearly 10 m. From the thickness map, an accurate estimate of organic soil volume can be determined, and hydrologically significant peatland areas can be identified.
Geophysical Surveys for Trenchless Pipeline Water Crossings
Because pipelines carrying hydrocarbons can cover extensive distances through variable terrain, they typically cross numerous environmentally sensitive water bodies, including rivers, streams and creeks. As such, careful engineering is required to ensure that pipelines don’t rupture close to water nor are they degraded by erosion. This is usually achieved by placing the pipeline at sufficient depth beneath the water body to prevent erosion (e.g., by horizontal directional drilling (HDD) or microbore tunnelling), or by constructing an aerial crossing to route the pipeline above the river. In either case, pipeline engineers need a good understanding of subsurface conditions, including bedrock elevation, bedrock lithology, weak layers within overburden that may lead to slope failure, and, critically, the locations and depths of coarse-grained deposits like gravels and cobbles that would impact the effectiveness of an HDD or microboring method.
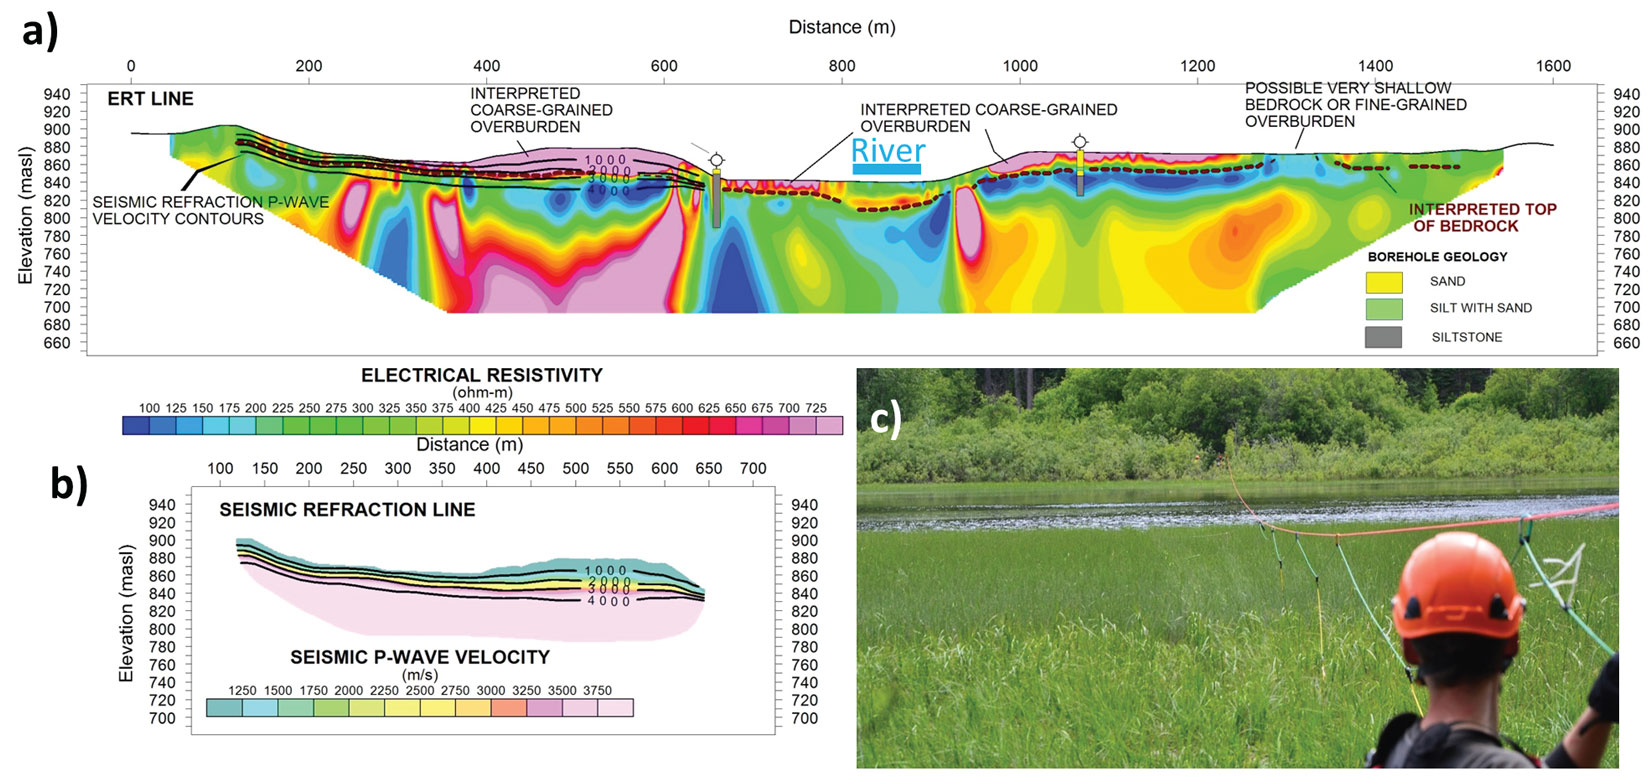
Unlike other engineering applications, the use of geophysics for trenchless pipeline crossings has become standard (e.g., Bauman and Nahas, 2007). Typically, geotechnical boreholes will be drilled on either side of the water body, and ERT or seismic refraction methods profiles will be used to extrapolate lithological boundaries beneath the proposed crossing alignment. These methods are highly complementary because ERT cross-sections will yield information on lithological changes within overburden, including the thickness and extent of clays and silts versus sands and gravels, whereas seismic refraction can be used to unambiguously delineate depth to competent bedrock. Although it is relatively straightforward to acquire these datasets on either side of a water body, it has been difficult to obtain the requisite information from beneath the water body itself. In some cases waterborne ERT or GPR methods can be used to fill in this data gap but, without a continuous model across the water body, it can be difficult to establish lithological or structural changes beneath the crossing. This can be especially problematic where the water course follows a major tectonic feature like a fault, and consequently there are abrupt changes in lithology from one side of the water body to the other.
To overcome this issue, we have adopted an approach that involves stringing an ERT cable across the water body and dangling electrode leads from cable takeouts into the water (e.g., Figure 6c). The water provides excellent electrical coupling, eliminating the need to insert electrodes into soil. It is a relatively simple idea but requires careful planning and coordination to do so safely and avoid damaging the ERT cable. Even though it is usually impractical to acquire continuous seismic refraction data across the water, a good line of seismic refraction data on one side of the water body is usually enough to ‘calibrate’ the ERT cross-section, and allow bedrock elevation to be interpreted with confidence along the ERT profile. This is demonstrated on the left side of Figure 6a, where a relatively low resistivity layer correlates with P-wave velocities of greater than 3000 m/s and siltstone bedrock logged in a nearby borehole.
Geophysical Surveys to Detect Buried Infrastructure
Many construction projects take place on brownfield sites, where previous industrial or commercial activities have taken place. As part of a thorough site assessment, it is important to establish potential liabilities including areas of contamination or buried infrastructure that could pose a hazard during or post construction. Near surface geophysical methods are commonly employed to map areas of contamination (e.g., electromagnetic (EM) and ERT surveys to map saline plumes), detect buried utilities or tanks (e.g., EM and GPR) or detect tunnels or other voids. Numerous geophysical methods can be used for void detection, but their efficacy is dependent on the size of the void, whether it is air or water filled, and the properties of the surrounding lithology. Commonly employed methods for void detection include microgravity, GPR, MASW or ERT surveys.
An example of the use of ERT for tunnel detection is shown in Figure 7. This example comes from a proposed construction site in Alberta, slated for development of a sewerage pumping station. Historical coal mining operations in the area had resulted in an extensive tunnel network of unmapped abandoned mine shafts and stopes (Figure 7a). Because of concerns over future ground settlement or sinkhole development, a geophysical survey was commissioned to map any voids under the footprint of the Site.
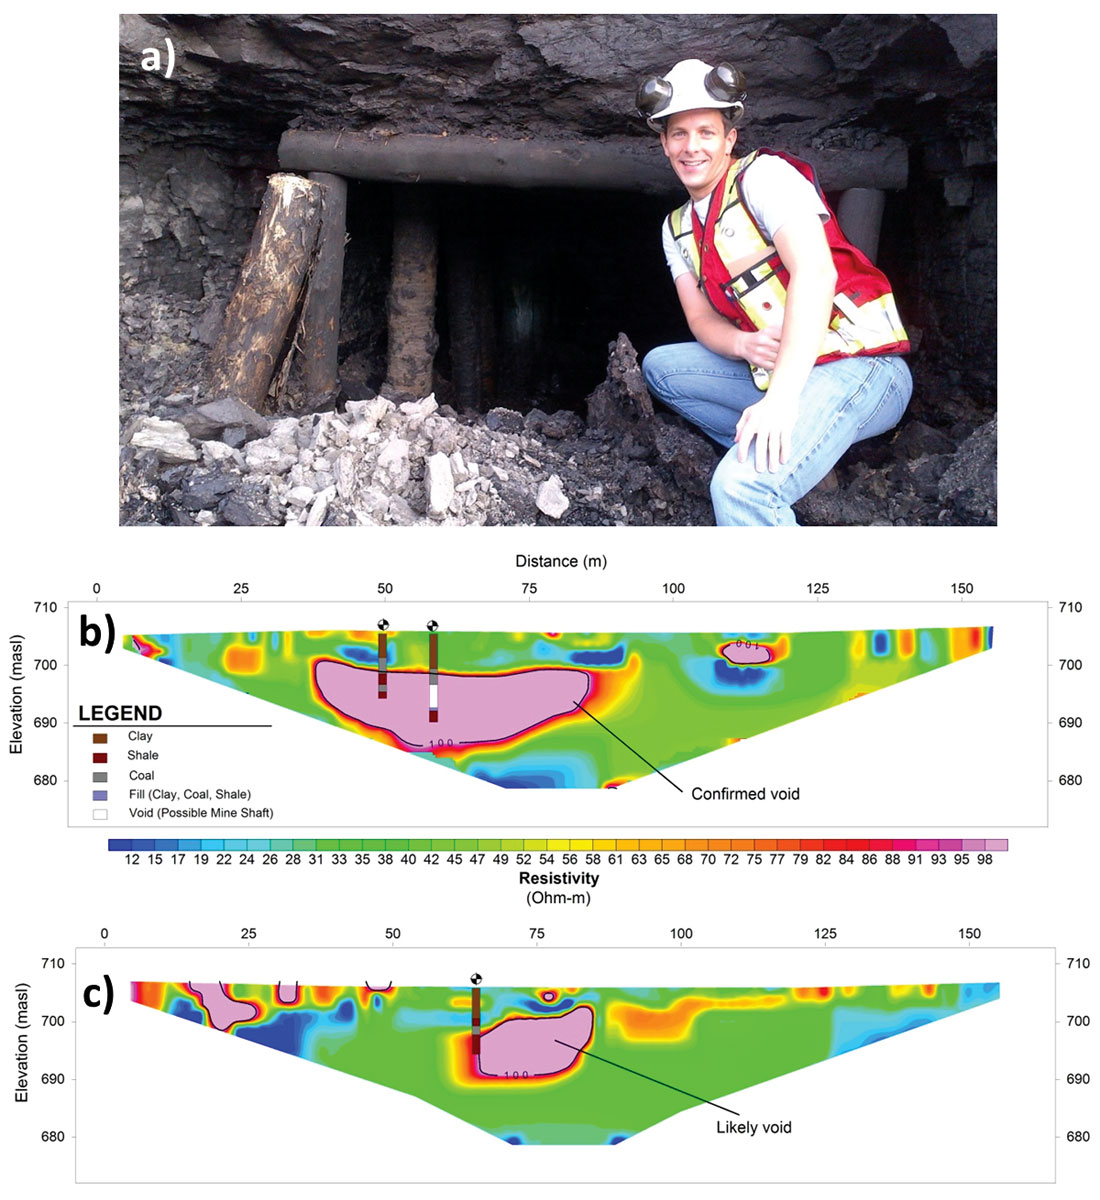
Geotechnical boreholes had encountered voids at some locations (Figure 7b), which provided valuable ground truth and established that the voids of concern were restricted to an interval of clay, shale and coal seams. Five 160-m-long ERT profiles were acquired across the site and were oriented to intersect with existing boreholes. Several high-resistivity anomalies were identified as potential voids, including one beneath the proposed location of the pumping station. Based on these results, a follow-up drilling program was proposed to target the voids mapped using ERT.
Summary
For deliberate reasons, all of the examples we have presented required some level of ground truth, from geological exposures, excavations, or boreholes. In our experience engineers will rightfully question any geophysical interpretation without confirmatory sampling. We have also provided a variety of examples to demonstrate that there is no one size fits all approach to engineering geophysics. There are numerous other construction engineering geophysical applications that, for the sake of brevity, we have not been able to include. These include geophysical surveys for construction aggregate mapping, seismic hazard evaluation, dam and levee assessments, permafrost mapping, UXO detection, and locating buried utilities.
Finally, we wish to stress that, for pragmatic reasons, designers and engineers do not require overly detailed geophysical models of the subsurface with painstakingly constructed estimates of model uncertainties. One of the most important skills for a geophysicist to learn is how to communicate effectively with an engineer. More often than not, simple answers are required to straightforward questions. Is bedrock deep or shallow? Is the bedrock highly weathered or competent rock? Is the soil soft or dense? Where are fine-grained and coarse-grained sediments? Where are the best places to drill/excavate and sample the ground? While nothing in life is certain (except construction project overruns), cost-effective geophysical surveys that are designed to provide clear answers and manage expectations will add value to most construction engineering projects.

Acknowledgements
We wish to thank our numerous confidential clients for allowing us to show some examples of our work. We also thank the many Advisian, WorleyParsons, and client staff who have assisted us on these projects.


Join the Conversation
Interested in starting, or contributing to a conversation about an article or issue of the RECORDER? Join our CSEG LinkedIn Group.
Share This Article