The net value of seismic is measured in various ways, but is usually reduced to a calculation of what additional economic benefit we expect to gain from the seismic information, weighed against the cost of the seismic information itself. The costs of the seismic are typically assumed to be quite small, and our focus in measuring the value of the seismic thus often ignores the supposedly insignificant cost side of the problem. That human resource of time is also often also ignored. We forget to ask, “how long will it take to obtain the seismic information?” And of course there are many kinds of seismic information we can aim to produce. We could shoot or buy several different kinds of seismic data. We could process the seismic data in a variety of ways, some of which cost more and take longer to produce. What processing should we invest in? How long will it take? How can these choices affect our business outcomes? Let us take a few moments and think about the cost of seismic and the time it takes to process the seismic data to fit our purposes. Hopefully by following this line of thinking, we will lay out some general guidelines that could be of illustrative use when discussing seismic processing projects.
Decision analysis and reliability as the geophysicists’ responsibility
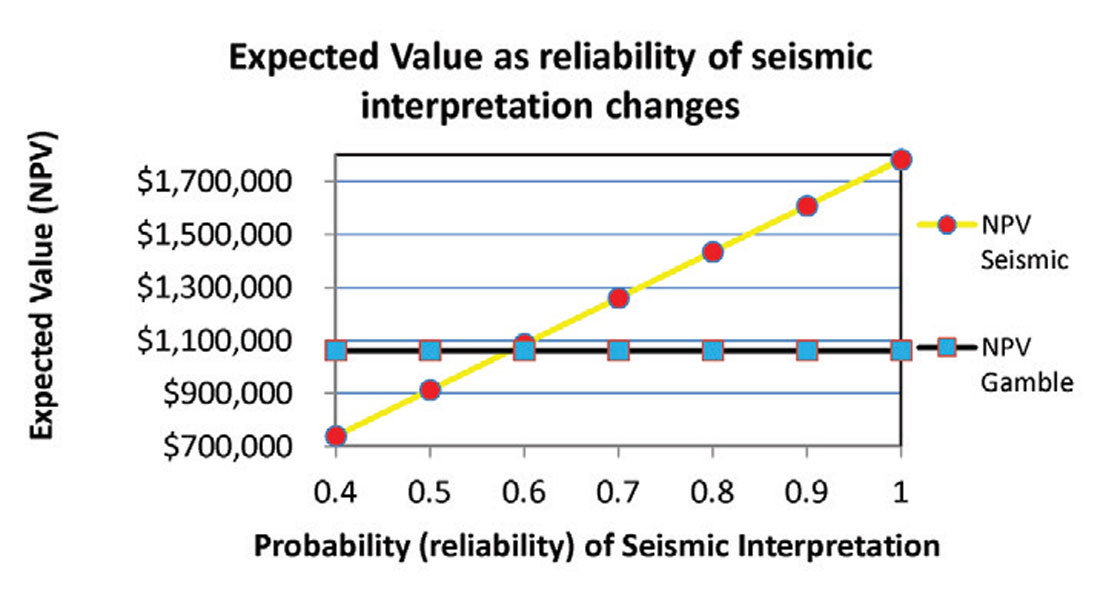
The formal science of decision making is called Decision Analysis, and was discussed for seismic data in Hunt (2013). The outcome of a decision analysis exercise for seismic information was shown to depend upon many things, including: the difference in net present value of the outcomes, the ultimate distribution of the outcomes, and the reliability of the seismic data. The first two of these controlling variables are area dependent, and are key determiners of economic success for a company. Successful teams choose areas in which the economic outcomes can be highly beneficial, and occur commonly within the area, or over a great scale. As obvious as that is, finding an advantage in the first two factors is a key and sometimes tricky element of positioning that not everyone succeeds at. Once an area has been chosen, and the work begins, the last variable, the seismic reliability comes to the forefront. The greater the reliability of the seismic, the more favourable the economics of its use becomes. Figure 1, from Hunt (2013), shows how the expected net present value changes in a resource play example as seismic reliability changed. At very high seismic reliability, the net present value increases dramatically, while for lower values of reliability there is some cross-over point where using the seismic results in lower net present values. On the business line, this question of reliability is often the only variable geophysicists can affect. Reliability thus becomes the Raison d’être for many working geophysicists.
Reliability has many meanings
If improving seismic reliability is the thing that geophysicists are most directly responsible for, then let us talk about reliability in greater detail. Reliability means many things. Ultimately, reliability has to do with how accurately the seismic can predict a geologic outcome. It can be measured with statistics. So we might think that reliability is only concerned with certainty, or signal to noise, or resolution. Of course all of these things are elements of reliability, but reliability is also as much determined by another concept, that of relevance. Even high signal to noise, perfectly sampled and resolved PP stacked seismic data will have little reliability in discriminating some sands from shales, or some porous reefs from some argillaceous basinal shales if their acoustic impedance and thickness are the same. These geologic outcomes, as different as they are in so many ways, are non-unique to the acoustic image of seismic data no matter how good its signal to noise ratio is. We can spend 10,000 hours and 10,000,000 dollars with that kind of seismic data and not help our science or our business. If our techniques are non-unique, they are not relevant, and if they are not relevant they are not reliable. It follows that one of the crucial things that geophysicists must do is determine the most relevant seismic properties to invest in. In the VIG Doodletrain course, the decision analysis term reliability is broken up into two terms: relevancy-meaning how well and uniquely a property addresses the geologic and economic outcome being sought, and reliability- meaning the accuracy of the data for that property.
Decision analysis reliability = relevancy and reliability (accuracy)
Relevancy insurance: specialization and integration
For as many times in the VIG columns of 2013 and 2014 as someone said we need to be integrated, they could also have said that we need to be specialized experts. In order to address relevance, we must be able to put a foot into both worlds: we will often have to be both good integrated team-mates, and good physicists. Ken Matson at the first of the 2014 University of Alberta talk series seminars pointed out that some problems actually require that we know our physics, and know it deeply and well. Ken was referring to a specific problem in modeling, but he was also right in general. We do need to understand our physics to know what might be the most relevant property to invest in or how to process the data for better reliability (accuracy). Even if we cannot be specialized in every aspect of geophysics, we had better know someone who is an expert and we had better know enough to reach out to that person and articulate the problem at hand. On the other hand, all those VIG columnists were not wrong in suggesting we need to be integrated. We do need to work with our colleagues in engineering or geology to understand the play parameters so that we can think about what really is relevant and how we can apply ourselves to address it. Integration is not really a magic word; it is as simple as actually working with our peers and sharing the question of relevance and data with them. In order to manage the problem of relevance, we have to reach into the multi-disciplinary world and we have to know enough about our own discipline. To those who say we cannot be both broad and deep, the advice here is that we have to be broad enough and deep enough. We have to reach out like butter to cover the whole toast, and we had better be deep enough to make it taste good.
Reliability and processing for accurate properties: the benefits
There are many things that we can do with seismic data, but the aims of the work are to achieve economically beneficial knowledge. Choosing relevant properties and processing them to maximum reliability are how we achieve those benefits. This relationship is causal as evidenced by the application of decision analysis. This causal relationship justifies the simple approach that we take in this note, which is to directly consider the benefits of the work to come from increases in reliability and relevance. It is reasonable to wonder if this argument has been demonstrated by case study. The VIG Doodletrain course illustrated several examples of this reliability/relevance-economic relationship. One example of relevance, reliability and economic benefit has played out in recent Canadian literature: that of the Viking play, interpolation, pre-stack imaging, and amplitude versus offset (AVO) analysis that was first published in Hunt et al (2008). This work followed the argument that:
- If interpolation improved the kinematics of pre-stack migration, then
- It must enable the production of more reliable pre-stack image gathers, and then
- AVO analysis on such gathers would yield more reliable elastic properties
The reliability of the gathers and AVO results to predict Viking gas sand reservoir quality was discussed in several papers including Hunt et al (2008 and 2010). The economic benefits of the work were first estimated in Hunt et al (2012b), which was part of the 2011/2012 CSEG Distinguished Lecture Tour. Those benefits were estimated by comparing wells drilled without seismic versus wells drilled with less reliable seismic processing (no interpolation) and less relevant techniques (stack amplitudes) versus wells drilled with the more relevant and reliable interpolation-imaging-AVO method. The differences in value were estimated in the millions of dollars per well using the natural gas price deck of the time. Reliability and relevance caused economic benefit.
The key properties that we might process for
Hunt et al (2012a), proposed the notion that there are only a few fundamental seismic properties that can be produced from seismic data, along with many measures of those properties which could be called their attributes. Our concern now is primarily with those few key seismic properties. This discussion does not benefit from an exhaustive exploration of all of the properties that could be produced. Our illustration is best made as simple as it can be while also making a reasonable representation of the common major properties. This illustration will be land-centric and tuned to the Canadian Deep Basin in particular. For the sake of illustrative simplicity, we also lump the properties to key processing milestones. Our key properties are:
- Stack. This heading refers to a time migrated and stacked image. In our example, the data is 5D interpolated and pre-stack migrated under an AVO compliant processing flow. Reprocessing projects may be initiated with the goal of producing higher reliability of the stack or of the AVO compliant gathers produced at this stage in the processing.
- Curvature and Coherence. This heading represents any and all of the myriad of the volumetric structural attributes that are readily available today. These measures, somewhere between being a property and an attribute, are commonly estimated from the migrated stack (#1).
- Diffraction Imaging. This represents a twist on migration where the kinematics of faults, fractures, and edges are used to image these features from the wavefield as opposed to the rest of the more continuous reflectors. See Edie and Negut (2014).
- AVO. This represents AVO analysis and AVO inversion of compressional seismic data, together with all of the many elastic properties that may result from such work.
- Azimuthal. This represents azimuthal AVO and azimuthal velocity analysis of compressional 3D seismic data.
- 3C. This represents a full three component 3D seismic processing project, together with the major properties that can be currently estimated from it.
A general project
In Table 1, we lay out the time, cost, reliability, and relevance of a 3D compressional seismic processing project. The example is loosely based on a recent deep basin project of the author’s. The prices and time-lines have been modified to protect the confidentiality of the work that it is based upon. Modification was made through discussion with several other processing company representatives who shall not be named in this note. The modifications, simplifications, and generalizations made here are necessary for several reasons: the first being that we do not want this illustration to be viable as a negotiating tool, to negotiate for prices or timelines in current projects. The second key reason for the generalization and simplification here is that a more detailed example would not serve our purposes any better. Prices vary enormously based on volume of work, the difficulty of that work, the shot density of the 3D survey (which we purposefully do not define) and other factors. So, be warned prices and times can vary by more than a factor of two from this example. A more detailed illustration would not likely yield an improvement due to these variances, so we have kept the picture simple. Despite this apology, the data in Table 1 is illustrative of a typical, current, deep basin reprocessing project.
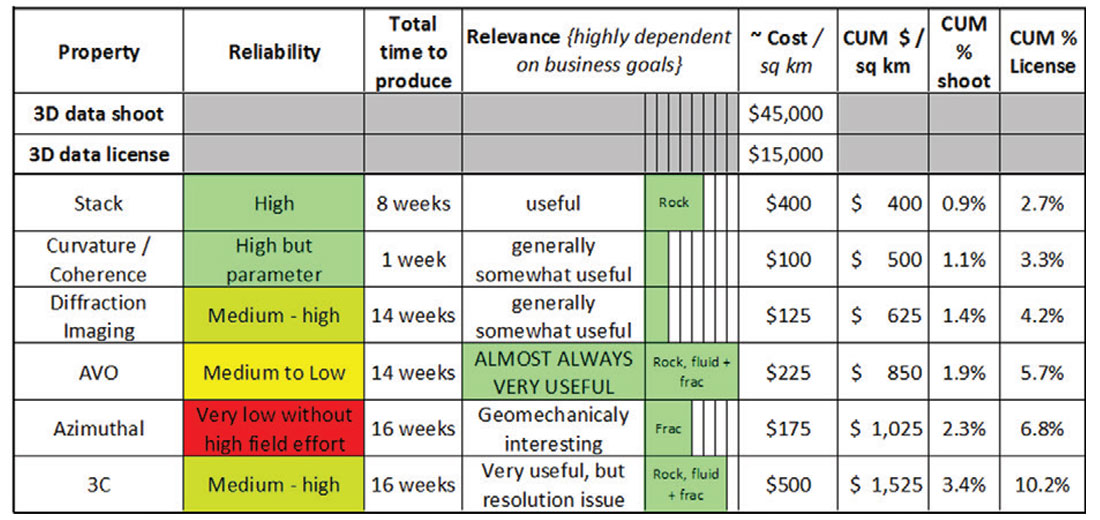
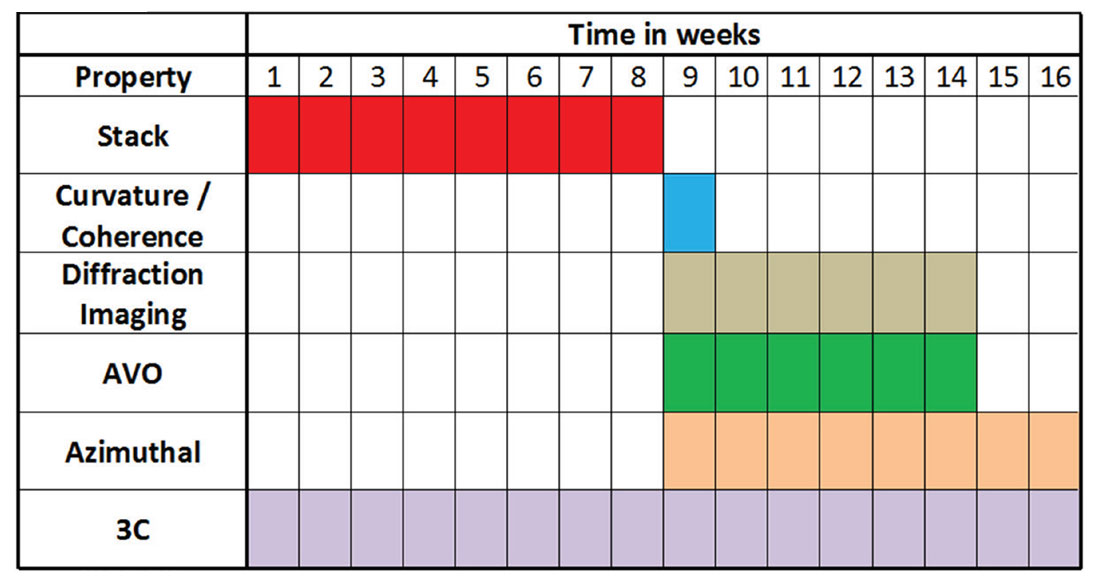
Table 2 is a Gantt chart illustration of the same data as outline in Table 1. An actual seismic reprocessing project would have a much more detailed Gantt chart. This table is a reduction to our key properties and is probably as detailed as a geophysicist would typically need to take in to a business discussion. Note how all of the properties except the 3C work follow the AVO compliant migrated stack.
Discussion
It would not be of great surprise if Table 1 and Table 2 creates some discussion or even controversy. We might argue about whether any of the prices or times is way out or not. Of course such things may vary; these prices and times are valid for the purposes being presented and we suggest no one take them personally.
You can do it, too.
Send in your own chart to illustrate time, cost, reliability and relevance.
The measures of reliability and relevance given qualitatively in Table 1 are more likely to generate controversy. We have suggested that AVO has somewhat concerning reliability and that the azimuthal methods have very poor reliability. We stand by that assessment. Most deep basin 3D surveys are poorly sampled in offset and azimuth, making azimuthal studies, even with 5D interpolation, highly problematic. AVO analysis on these 3D surveys also have very poor near offsets, making AVO at least somewhat inaccurate. We do not suggest that AVO or azimuthal methods should not be attempted because of their poorer reliability relative to (say) the stack, but we do want to be clear that these properties are less reliable. Even if it seems pessimistic with respect to these properties, being honest is important to the validity and credibility of our economic arguments. This honesty is also crucial in regards to directing us towards investing in processes or acquisition that may yield better reliability.
The economic reason to invest in some of the less reliable properties is at times embedded in their crucial relevance. AVO may be somewhat less reliable than stack data, but it is almost always of unequivocal relevance and importance. Properties obtained from AVO analysis, if reliable enough, are capable of overcoming most of the classic non-uniqueness problems of compressional seismic data. Properties from AVO analysis are also crucial in assessing resource play reservoirs, their quality, and to some degree, their fracability. Azimuthal methods may be worth investing in despite their reliability problems because of their potential to provide insights into bedding, fracturing, and stress.
A key to understanding Table 1 is in identifying what the technical and economic controls are on the project at hand. If strain, faults, or fractures are deemed to be relevant in a project, then curvature, diffraction imaging, and possibly azimuthal studies become crucially important. While curvature/coherence and diffraction imaging are not given broad relevance, they are very relevant to certain things such as strain, fracturing, faulting, and other structural concerns.
Cost of processing
The cost side of processing is very low. The “CUM % shoot” in Table 1 is the percentage of the cumulative processing costs as compared to the cost to shoot, and the “CUM % License” is the percentage of the cumulative processing costs as compared to the cost to license the 3D data. Processing costs are low even compared to the cost to license data where they typically represent less than 10% of the licensing costs. The low cost side is another reason, together with relevance, to take a chance on the reliability of some of the properties.
What about acquisition for reliability and relevance?
This article does not consider the benefits of superior acquisition. Similar arguments could be made that acquisition can be designed such that it yields more relevant properties. Shooting a three component 3D seismic program could be an example of this. 4D seismic is another example that is relevant to production monitoring, and should therefore be considered when monitoring questions are relevant. Greater reliability of any seismic program can be achieved through more optimal field parameters. We suggest that it is better to acquire the original seismic data such that it is well suited to produce relevant and reliable properties than to depend solely on processing. The greatest reliability and relevance will be achieved with a suitable acquisition type and geometry for the economic problem, followed by the most suitable processing.
Summary
This short note presents a simple illustration of the costs, required time, reliability and relevance of a project to process key seismic properties. Reliability and relevance are argued to be causally related to benefit, making this illustration one of cost-benefit. While the example presented was indeed simple, it may provide a useful framework to discuss the nature and cost-benefit of prospective projects within a business setting or within a decision analysis exercise.


Join the Conversation
Interested in starting, or contributing to a conversation about an article or issue of the RECORDER? Join our CSEG LinkedIn Group.
Share This Article