In unconventional reservoirs, the occurrence of marls is a significant risk to production and a major challenge to be able to locate and quantify them. As the marl thickness is often below the seismic resolution, an advanced characterization technique is needed. The HitCube inversion is an efficient stochastic inversion to predict rock properties based on the comparison between the real seismic data and synthetic seismic data modeled with a large set of 1D Earth models (pseudowells) derived from real wells. The HitCube inversion resulted in a 3D prediction of the marl distribution in the Horn River basin and its relative amount.
Introduction
The Otter Park Formation of the Horn River Basin, northeastern British Columbia, Canada, is an unconventional reservoir that holds a significant amount of self-sourced gas trapped in a tight shale lithofacies. The shale succession presents slow lateral variations in terms of thickness and rock properties (Gal and Jones, 2003) and some wells have encountered marly laminated mudstone deposits encased in the shales. These marl deposits constitute lean non-reservoir zones which reduce anticipated reserves and therefore need to be mapped. An additional complicating factor is that the individual thicknesses of the marl units are below seismic resolution, i.e no individual seismic event can be uniquely attributed to the presence of marl.
However, the elastic properties of the marls are sufficiently different from the encasing shales to cause measurable effects in the composite seismic reflection response. This is the key to their identification using the HitCube rock property prediction workflow. The HitCube is a geologically-driven stochastic inversion method that works well in areas with limited well control. The method takes into account non-unique solutions and outputs rock property probability volumes with associated uncertainties.
Regional geology and stratigraphy
The Horn River Basin is located seaward of a barrier-reef system of Devonian age and corresponds to a marine depositional environment (Oldale and Munday, 1994). The region has been affected only by minor tectonic events. The stratigraphic column is mostly a succession of limestone and shale formations with varying mineral content. Muskwa, Otter Park and Evie Lake formations were deposited in the early/mid Devonian. They are made up of shales that are rich in organic content. While uplifted later from the late Cretaceous to Tertiary, these shales have been buried deep enough to generate large amounts of gas and oil. Much of the hydrocarbons migrated to conventional reservoirs but a large amount has also been trapped in low permeability shales.
Method and application
The Otter Park seismic characterization study was performed on a portion of a 3D seismic survey of approximately 363km2. Six wells with logs (sonic, shear sonic, density, porosity, volume of shale, volume of quartz and volume of calcite) were available but only three wells were located inside the area with seismic data. One other well was near enough to be projected onto the seismic survey. All six wells were used in the statistical analysis and to create the stochastic input parameters for the HitCube modeling.
Data analysis
The objective is to locate and quantify the marl deposits, so as a first step the different lithologies present in the Otter Park formation must be identified within the wells. To do so, we used a multi-dimensional cluster analysis. The advantage is that the assignment of lithologies along the well track is now based on the properties found in multiple well logs -instead of one or two- leading to a more accurate lithology assignment. This analysis resulted in four classes identified as marl, clay, shale and best quality shale. The shale units are defined by a higher quartz content, with the best quality shale showing a higher porosity – a favorable reservoir quality – than the other shale type. The clay type is defined by a high clay content. The marls are defined as low on clay and high in calcite and both clay and marls have low porosity. Relative to the shales, the marl exhibits high p-wave velocity and density, which is the basis for it discrimination in seismic data. Based on the lithologs created in the previous step and the regional geology, the Otter Park formation is subdivided into two units, the upper Otter Park ABC and the lower Otter Park DE. The essential difference between the units is that all four lithologies are found in Otter Park ABC, while Otter Park DE principally comprises clay.
The final steps in the data analysis were to determine the best wavelet for the synthetic seismic computation and find the matching scalar between seismic data and synthetic models.
Sensitivity analysis
To obtain a feel for the sensitivity of the seismic response to changes in lithology or thickness, a series of forward modeling experiments were done. For example, wedge models were made in which the relative thickness of marl layers was decreased while the relative thickness of the other three lithologies were increased such that the total thickness of the Otter Park formation remained constant. Synthetic seismic traces were then computed for the range of marl thicknesses. The sensitivity analysis suggested that the marl content variation produces a measurable effect on the seismic response given the S/N ratio of the seismic data. This is important as the marl layers are thin compared to seismic resolution.
Pseudo wells modeling
Stochastic well modeling is the first step in a typical HitCube inversion workflow. The aim is to construct a database of probable earth models that captures all relevant geologic and seismic variations in the target interval (Ayeni et al, 2007). Pseudo wells are stratigraphic columns with attached well logs, but without geographical location. They are generated by a stochastic simulator that is controlled by statistical parameters extracted from real well data, a rock physics model and geologic knowledge. For each pseudo well, a synthetic seismic trace is computed using the well logs that were created with the stratigraphic column.
The Otter Park ABC shale quality appears to be worsening towards the top of the formation. This trend is included in the modeled pseudo wells. In addition, the presence of the marls directly influences the position of the seismic loops; the first positive loop originates from the marl lithology (when present) or from the Muskwa/Otter Park contrast if the marl is not present. Thus the simulation has been divided into two cases: pseudo well generation with a low (or no) marl content and pseudo well generation with significant marl content. The stochastic variation of rock properties was also incorporated into the simulation. The sonic, shear sonic and density values for all the lithologies present in the Otter Park formation in the pseudo wells were varied using a normal distribution around their mean values derived from the actual well logs. Additionally, the total thickness of the Otter Park formation was varied.
The generated pseudo wells were QC-ed by extracting attributes in order to verify that they are geologically “reasonable” (e.g., the marl content in all wells should remain below 35%).
HitCube inversion
The simulated pseudo wells do not have a geographic location. The inversion step in a HitCube aims to assign pseudo wells to spatial positions such that rock properties can be computed from the tied models (Ayeni et al, 2008). In this case the HitCube inversion workflow was used to compute acoustic impedance and lithology distributions.
The HitCube inversion process is divided into two steps:
- The actual seismic traces in the volume are correlated with synthetic seismic from modeled pseudo wells.
- The property traces from matching models with correlation above a user-defined threshold are stacked to build the output probability volumes.
The matching procedure is the first step of the HitCube workflow. The synthetics from all models are computed and then matched with each trace of the seismic survey at the defined interval of interest. Cross-correlation or similarity can be used as a matching operator. The matching is done over an interval defined as a time window relative to a reference horizon, here the top Otter Park horizon. A small time shift, “delta”, is allowed between synthetic and real trace to find the best match. When the algorithm determines that for a given model the optimal time shift is outside the allowed search window, this model is discarded for the subsequent rock property calculations at that location. The best search window is the smallest window allowed to find the actual match considering variations in AI profiles (hence reflection signatures) and that the reference is the interpreted horizon in the seismic and the geological marker in the models, as well as seismic noise. The output of this first phase is a similarity and time shift pair for each model for each trace of the data. The similarity is stored into the “ScoreCube” and the time shift into the “DeltaCube”. In these volumes the third, “vertical”, axis corresponds to a model index.
Different logs have been simulated for each pseudo well. As the pseudo wells are now spatially distributed, the log properties can thus be predicted in the full survey. The ScoreCube enables us to select the models of which the synthetics exhibit the best similarities with the real seismic. First a matching threshold is used to discard models that do not sufficiently match the seismic data. A “maximum number of stacked traces” N parameter can be set to explicitly discard all models except the N best fitting ones. This feature enables the constraining of the fold of the stacking operator to a constant value, but also to use a smaller cut-off value as and when needed. The selected models provide the dataset that will be stacked to compute the output targets. The stacking is a weighted sum of the targets. This can be a simple mean or can it be done using a weight increasing linearly from 0 to 1 between the cut-off score and 1 or using the score value as weight.
The HitCube can output mean, probability and standard deviation volumes for any log that was simulated. In this case outputs were computed for acoustic impedance and lithologs. Special attention had to be paid to the lithology prediction as the inputs – the simulated lithologs – are discrete logs with values 1 to 4, representing the different lithologies. First, for each lithology, a separate probability volume was computed from the models that passed the HitCube scoring criteria. Next, the four volumes were combined into a lithology prediction volume by selecting at each sample position the lithology with the highest probability. This volume defines the facies distribution. Similarly, a confidence volume was computed by taking the difference between probabilities of the two best scoring lithologies, i.e with the two highest probabilities. The confidence at each sample position thus ranges between 0 and 1 .The confidence is higher if a clear difference exists between the two most likely lithologies, meaning one lithology is highly probable where the others all have negligible probabilities.
Results and interpretation
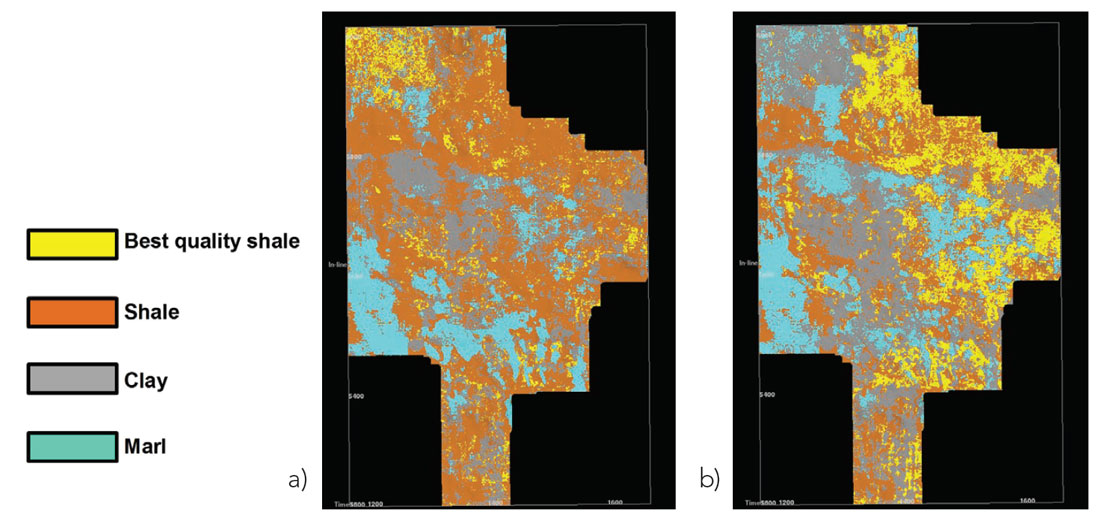
Probability volumes can be generated for each quantity available in the pseudo wells. Acoustic Impedance and Facies cubes have been computed and can be analyzed. For example, Figure 1 displays the most frequent facies within different time gates defined regarding the Top Otter Park horizon. It shows the distribution variation with depth.
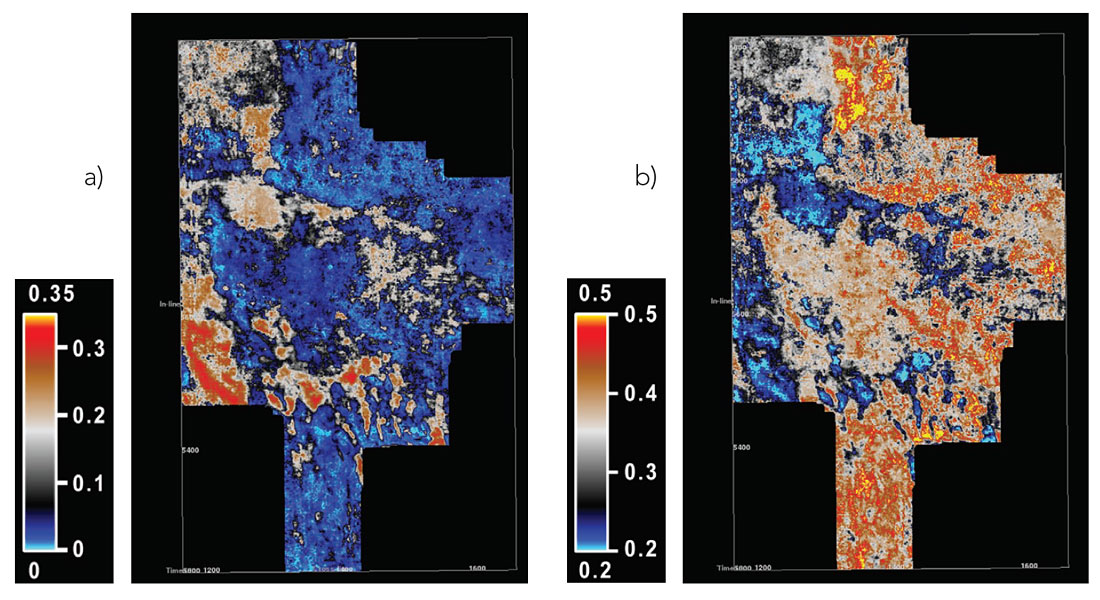
Apart from predicted property volumes, several grids were also created. For example, Figure 2 shows the relative amount of each lithology in the Otter Park formation over the entire survey area.
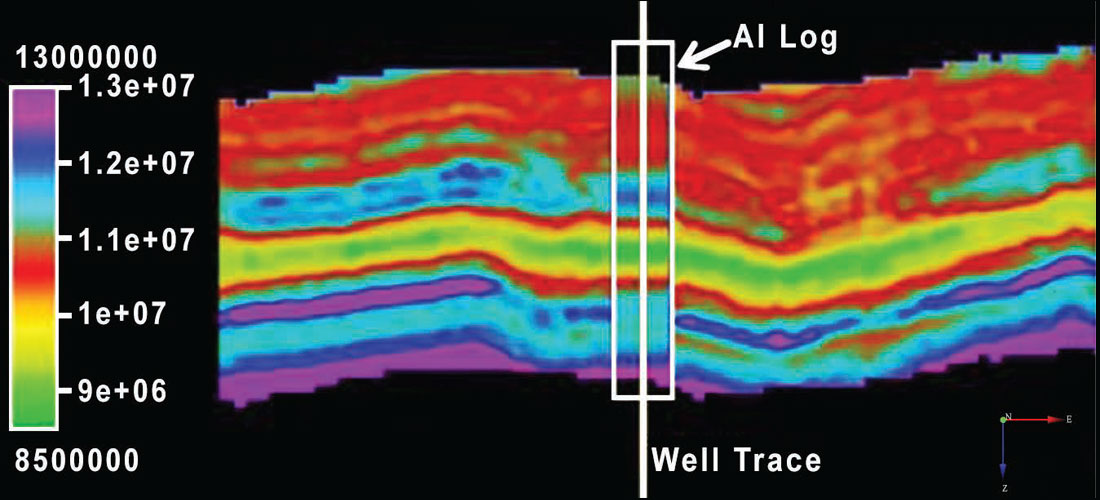
The uncertainty of the inversion to acoustic impedance is presented in the form of standard deviation volumes. The results are QC-ed at the real well locations by visual comparison with the real logs (see Figure 3).
Geological Interpretation
The facies distribution volume can be used to improve the understanding of the depositional history and to allow the defining of a depositional model. While this was not the main focus of this work and article, we will provide a limited overview.
It appeared that Marls in the upper target interval are mainly restricted to the southern (proximal) part of the study area. In the deeper parts of the target interval, marls are recognized mainly further northwards (distal). This suggests possible marl flows from the southeast to northwest direction. Geomorphologic patterns corroborating this view were also highlighted using seismic attributes such as the minimum amplitude. Combining the facies cube and the seismic attributes, it is feasible to create a more accurate model of mud flow deposition and also its direction. The predicted facies distribution displayed at different layers within the Otter Park formation shows a consistent depositional trend.
Conclusions
The HitCube inversion method successfully predicted acoustic impedance and facies along with their respective probability in the target reservoir interval. The thickness of the predicted lithofacies layers was below seismic resolution. However, forward modeling showed that changes in lithofacies thickness have a measurable effect on the seismic signature. The HitCube method can (stochastically) invert these subtle variations in the seismic measurement to Earth Modeals and 3D lithofacies and rock property distributions. Depositional patterns observed in the predicted lithology volume confirmed expected trends from other observations. It is possible to use the study results to define areas with lower risk of marl presence to mitigate production risks. Also shales and best quality shales were predicted. These results may be used to predict good quality reservoir areas – an important element in optimizing the development of this reservoir.

Acknowledgements
The authors would like to thank Nexen Energy ULC for providing the data, and we express our gratitude to Olympic Seismic and Arcis Corporation for permission to publish the seismic data.


Join the Conversation
Interested in starting, or contributing to a conversation about an article or issue of the RECORDER? Join our CSEG LinkedIn Group.
Share This Article