Introduction
Traditional notions of stack fold can lead us astray in 3-D seismic design. The consequence of fold variation appears to be more complicated than a simple relationship for signal to noise based solely on the square root of the number of traces in a common midpoint gather. This is particularly evident when we include analysis of coherent noise. Practical examples show that wide patch, low fold three dimensional acquisition can provide visibly better images, and superior noise attenuation compared to two dimensional seismic with 10 times the fold. Wide patch 3-D recording techniques can also provide cost and image performance advantages over narrow patch, narrow line interval 3-D surveys. These improvements are attributed, in part, to the effectiveness of the 3-D stack as a mechanism for attenuating shot generated backscattered noise. Synthetic model studies show that attenuation of backscattered noise visibly improves as recording patch aperture is increased. Model studies and data examples also show that pre-stack migration provides very effective backscattered noise attenuation on wide aperture 3-D data.
Why is 3-D fold better than 2-D fold?
The perception that 3-D fold is better than 2-D fold, for noise suppression, is part of the geophysical folklore but has not been investigated thoroughly. I have observed numerous instances and agree that it is generally true, but I have heard only a few compelling explanations as to the cause.
Two of those suggestions are:
- The increased weighting of far offsets in wide patch land 3-D acquisition helps attenuate multiples and omits much of the inside near offset noise.
- 3-D migration is more effective at imaging and noise attenuation than 2-D migration.
These two explanations have merit, but they are not the only reasons for the superior performance of low fold 3-D.Wide patch 3-D acquisition creates a very different weighting of offset distribution compared to 2-D. While 2-D data has a uniform distribution of offsets, 3-D wide patch data typically has an increasing number of traces as offset increases. This type of offset distribution in 3-D can help attenuate multiples by emphasizing those ranges of traces which exhibit the largest post NMO temporal separation between primary and multiple. Attempts to bias 2-D offset distributions, to mimic 3-D, generally provide disappointing results compared to the power of 3-D data. Offset biasing during 2-D processing is not a general practice in our industry (apart from inside trace mute), so offset weighting is not likely to be the key candidate to explain S/N differences between 2D and 3-D. Also signal to noise ratio of 3-D stack data is usually better than 2-D stack data of equal fold, before the post stack migration step, indicating that migration is not the sole reason for 3-D fold being more effective than 2-D fold in noise attenuation.
The observations that stack data quality and acquisition cost both increase with higher CDP fold, and that low fold 3-D out performs high fold 2-D, suggest that an understanding of the noise attenuation mechanism in 3-D stack could lead to lower cost, higher performance 3-D.
Shot generated backscattered energy (along with direct arrival waves, multiples, and true random noise.) is likely to be a significant source of poor signal to noise on land data. (See Regone, 1990) Our intuition says attenuation of both random and direct arrival noise via fold should be similar in 2-D and 3-D; however, shot generated coherent noise has the potential to be suppressed differently, if the 3-D acquisition geometry is markedly different from the 2-D geometry. One major difference between 2-D and 3-D acquisition is the ability of wide patch 3-D to sample the entire emerging reflected wavefront from each shot. It is this inherent multi-azimuth, wide aperture component of 3-D that I believe contributes to the strong noise rejection performance of low fold wide patch 3-D.
In "Coherent noise in marine seismic data" (GEOPHYSICS, 1983), Lamer et. al. used modeling to simulate 3-D scattering for 2-D acquisition. They concluded that 2-D CDP stack actually accentuates, rather than attenuates, backscattered noise. I follow their experiment and extend the analysis to include 3-D acquisition scenarios, as well as prestack migration tests to evaluate the backscattered noise attenuation performance of current acquisition and processing capability. Comparisons of 2-D and 3-D field data examples, as well as 3-D decimation tests with various patch dimensions also verify that the wide aperture characteristic of 3-D is a key parameter for effective noise attenuation.
Backscattered noise attenuation via wide patch 3-D
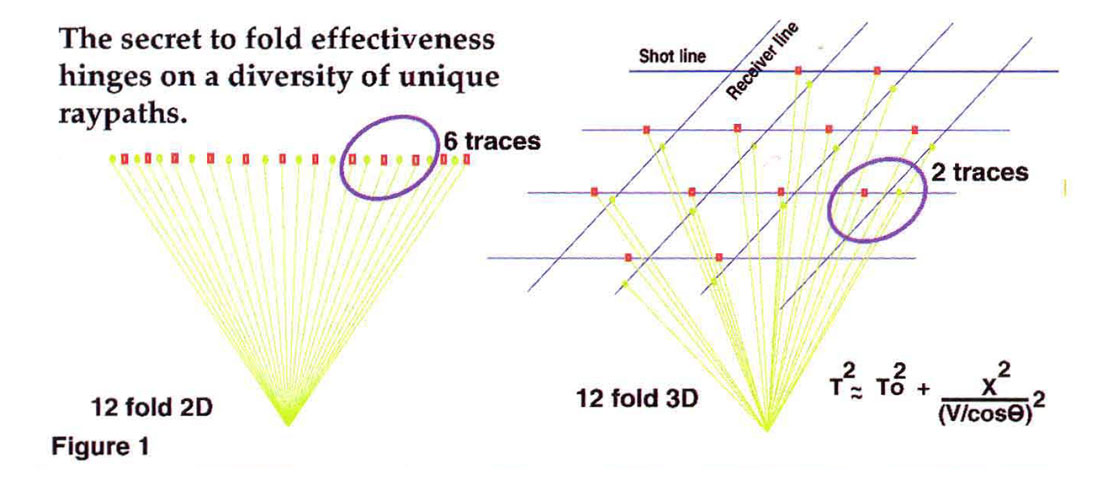
The CDP based NMO-Stack process attenuates random noise with a factor equal to the "root N" of fold (number of traces in a common midpoint gather), while coherent noise (such as direct arrivals or multiple energy) is filtered via stack array velocity discrimination (Anstey, THE LEADING EDGE, 1986). Shot generated waves, reflecting from near surface heterogeneities, is also a form of coherent noise. For scattering features which are not directly on the line, the effective length of the 2-D stack array is too short to attenuate the backscattered energy, and it is preserved in the stack (Figure 1, left). The wide patch 3-D CDP stack array does have sufficient aperture in all azimuths to form an effective filter length longer than the wavelengths of the backscattered noise; however the number of spatial sample points in the array is typically very small, and the distance between elements very large, constituting a poorly performing, highly leaky array. In a low fold 3-D survey, the large distance between surface recording elements within a single CDP means that the recorded backscattered wavefield will be severely aliased, to the point of appearing incoherent. Backscattered waves will mimic random events within the 3-D CDP (Figure 1, right).The filter performance of the 3-D CDP stack array will be degraded to simple "root N" attenuation of the backscattered noise; however this is still markedly better than the performance of the 2-D stack array, which is an all pass filter for most scattered energy.
3-D fold compared with 2-D fold
Amoco recently acquired a low fold Alberta foothills 3-D together with an vs. 3-D comparison without vintage variations which inject uncontrolled variables.
Figure 2, top left is a 2-D 60-fold DMO stack, and Figure 2, top right is the poststack time migration. Figure 2, bottom left is a 3-D 6-fold stack and Figure 2, bottom right the 3-D prestack time migration. The position of the displayed sections are shown on the small map insert, and it should be noted that they do not represent exactly the same subsurface section, with the 2-D data shot along predominant dip, and the 3-D section extracted along the inline bin grid. This angle difference, in addition to the lack of DMO on the 3-D stack, do restrict any comments on absolute differences in structural image, however, general comments on S/N differences are entirely valid.
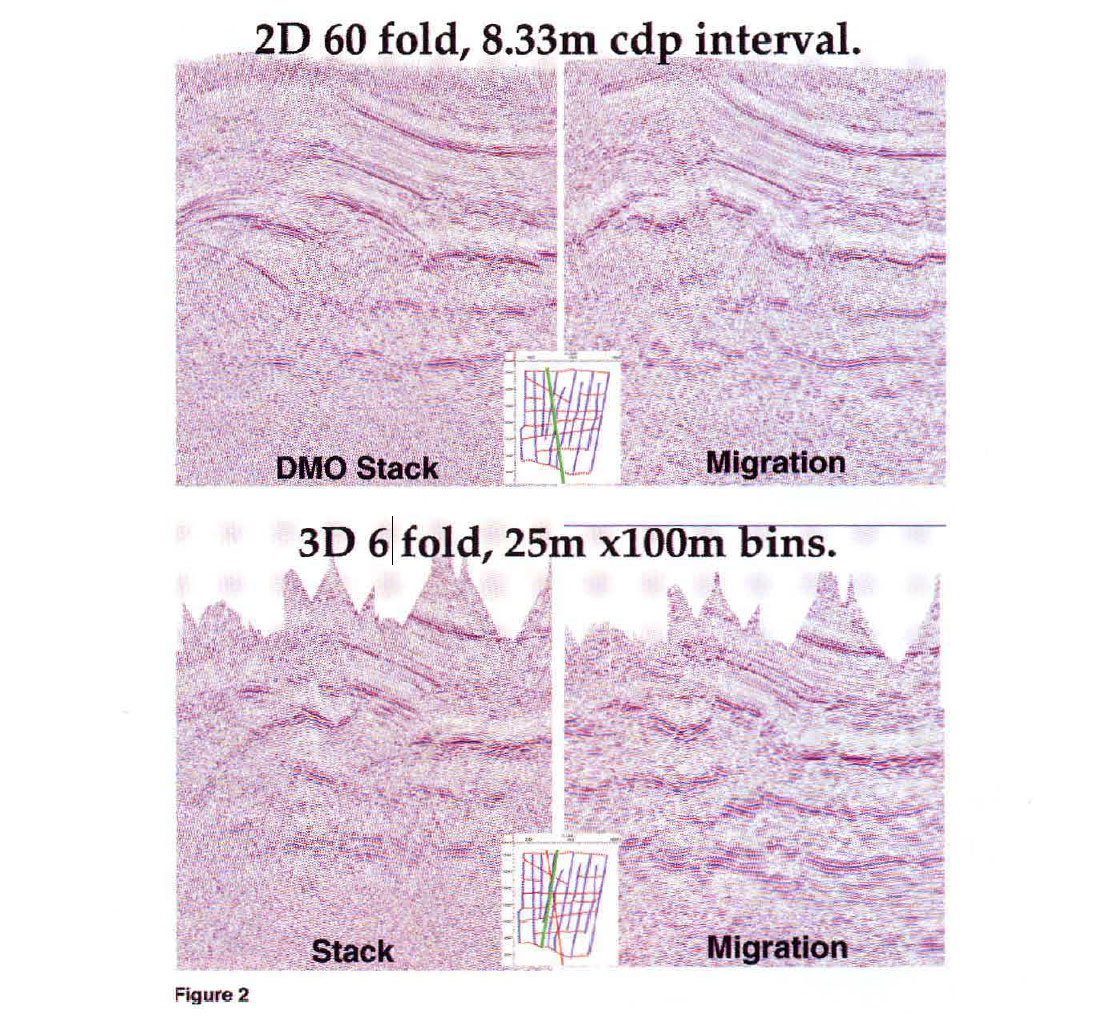
The 2-D (DMO Migration) section (top) is better for the shallowest horizons, as the wide shot and receiver line spacing on the 3-D creates deep mute zones in the shallow section. The prestack time migrated 3-D data (bottom) is superior over the zone of interest (time spanning middle 1/3 of the sections). Surprisingly the 6 fold 3-D stack compares very favorably with the 60 fold 2-D stack over the zone of interest, particularly on the deep horizons. With 10 times the fold and 3 times the spatial sampling (i.e., 30 times the acquisition effort) the 2-D does not exhibit significantly better SIN at the stack stage. In this case 6 fold of 3-D is worth about as much as 60 fold of 2-D for the purpose of SIN improvement at both stack and migration stages.
Patch dimension, decimation tests
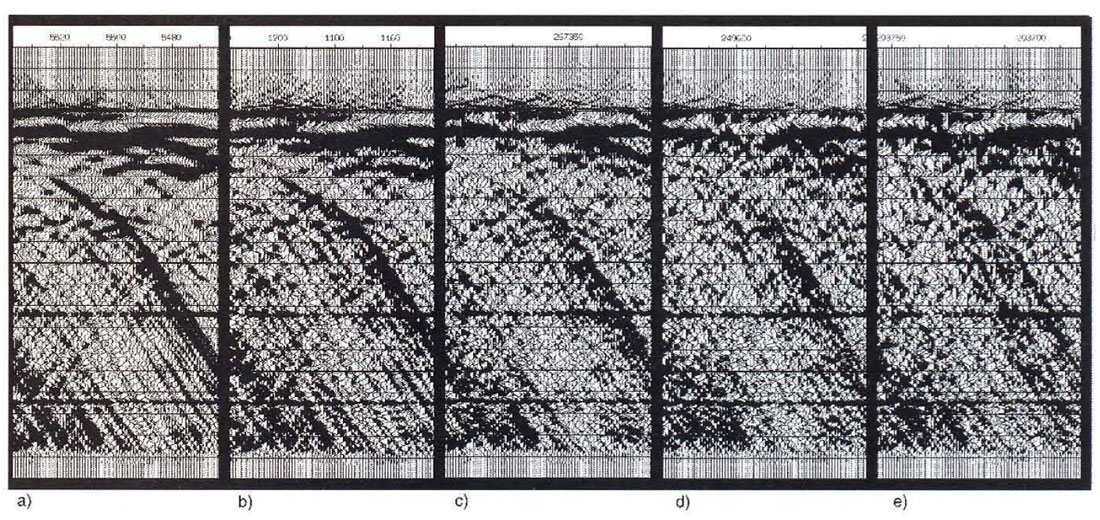
If the use of multi-azimuth recording contributes to improved fold performance, then the next logical question to ask is: what 3-D recording patch dimensions are best? To illustrate the effectiveness of multi-azimuth data, I have tested three acquisition schemes by decimating an oversampled 3-D dataset from the Canadian foothills (Figure 3.) The 3-D data was shot with ten receiver lines live for each shot, which allows the exact reconstruction of various recording patch dimensions, allowing examination of image and noise attenuation performance with varied acquisition parameters for the live channel layout.
The three schemes chosen are:
- Narrow azimuth, "skinny" ten line patch, with azimuths oriented along strike;
- Narrow azimuth, four line patch, with azimuths oriented along the dip direction,'
- Wide azimuth, four line patch, with azimuth contribution from all directions.
The data is structurally complex, so prestack depth migration was chosen as an evaluation method. Similar wide patch decimation tests, ("Sparse 3-D: What's in a name?" CSEG Recorder September 1997) on other 3-D datasets, indicated that image quality was most directly linked to variations in surface effort (as quantified by fold). We also discovered that previously assumed key processing steps, such as velocity analysis, and statics estimation are remarkably robust down to very low levels of surface effort. (On wide patch, Alberta datasets) . To save time, and focus on the aspect of prestack imaging performance, each of these tests were run using a single velocity function, derived from a VSP and tuned u sing the full fold dataset. The statics were also derived from the full fold dataset and applied to each decimation prior to prestack depth imaging. Re-processing each decimation, from scratch (with independently derived statics and velocities) would no doubt cause additional differences on the final images. Extrapolating from earlier work, I would expect those additional differences to be marginally small.
The three dip image sections and depth slices from the output depth migration cube, shown in Figure 3 (bottom), illustrate the differences quite clearly.
The image from the narrow patch strike orientation (Figure 3, left) is very poor in many respects. The output image is noisy and the anticline plunge is barely visible on the depth slice. The deeper reflections are barely visible on the dip image section. Only the true strike oriented features are imaged with any degree of resolution u sing this strike oriented patch.
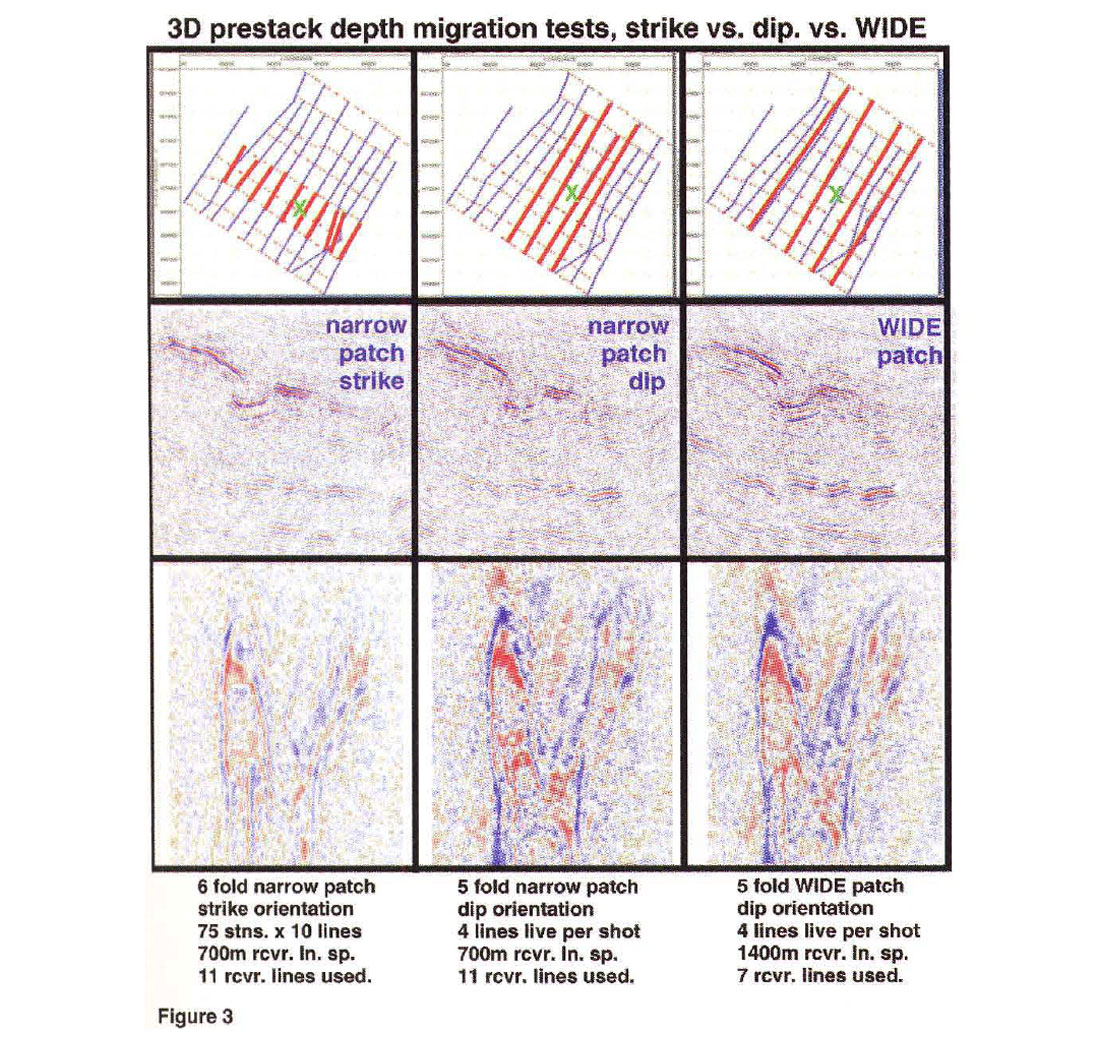
The image from the narrow patch dip decimation (Figure 3, center) is much improved over the image from the strike patch, but is still noisier and lower quality than the image from the wide patch decimation (Figure 3, right) The deeper horizons on the narrow patch dip decimation are still quite weak compared to the wide patch, and the depth slice is less crisp, and noisier,
The wide patch image is remarkably the best, with good delineation of the closure of the plunge on both syncline and anticline features, as well as the V shaped intersection, and the subtle saddle point in the middle of the syncline. The data is also less noisy and displays improved definition of the deeper horizons compared with the two narrow patch decimations (at the same fold level!).
Model studies of backscatter attenuation via wide patch 3-D
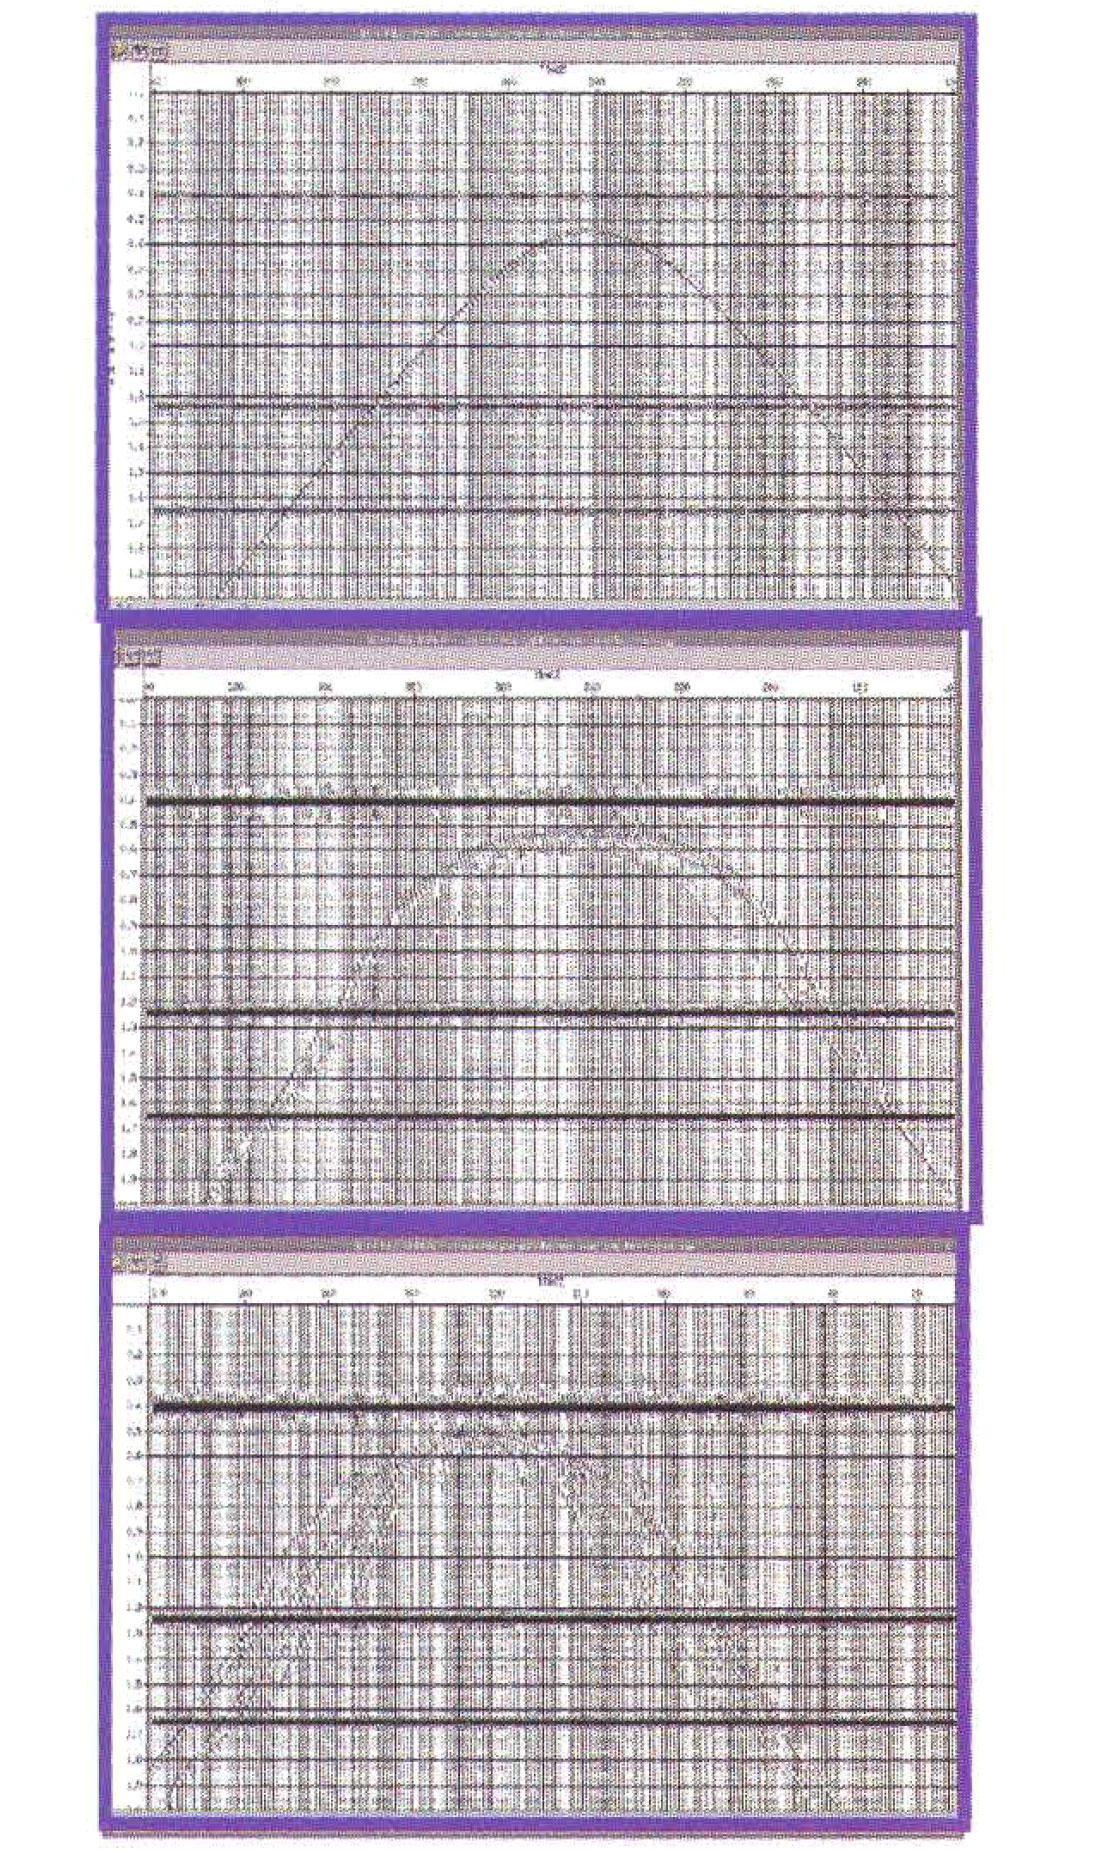
Both 2-D and 3-D synthetic model records, with three flat subsurface layers, were generated using recording parameters listed in Figure 4. These models included Single bounce energy from a 3-D field of 564 scattering points, (with alternating reflection coefficients) using raytracing in constant velocity media. A pair of 2-D lines, and three separate 3-D datasets were generated over the same field of scattering points as illustrated in Figure 4. (Average interval velocities = 2200, 2900, and 4000 mZs, Depths=450m, 1800m and 3300m) The top half of Figure 4 shows the areal orientation of the recording patches and line spacings in plan view. The bottom half of Figure 4 shows an uncorrected common midpoint gather, along with a pair of normal move out corrected high fold 2-D, and several low fold 3-D gathers, each with the energy from a single near surface scattering point. The 2D NMO corrected gathers in Figure 4 illustrate the complex shape of the offline point scatterer after velocity correction. Although this scattered event is not flat, (displaying complicated residual moveout), it illustrates just how ineffective high fold 2-D really is.
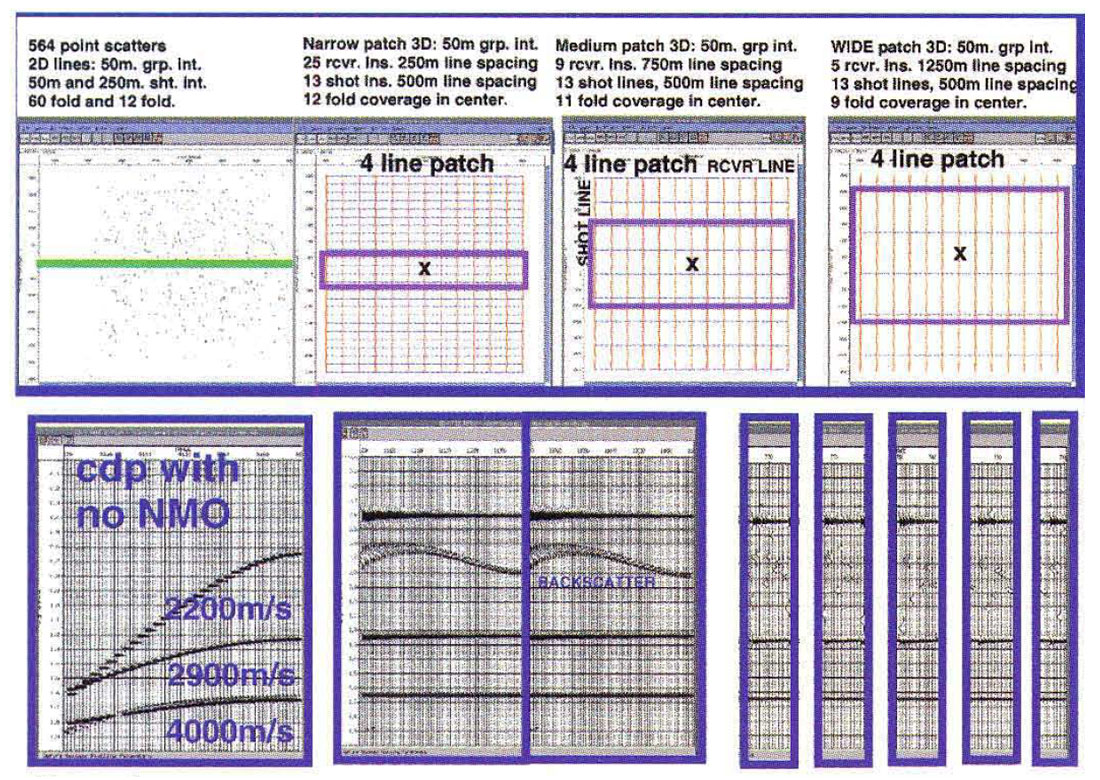
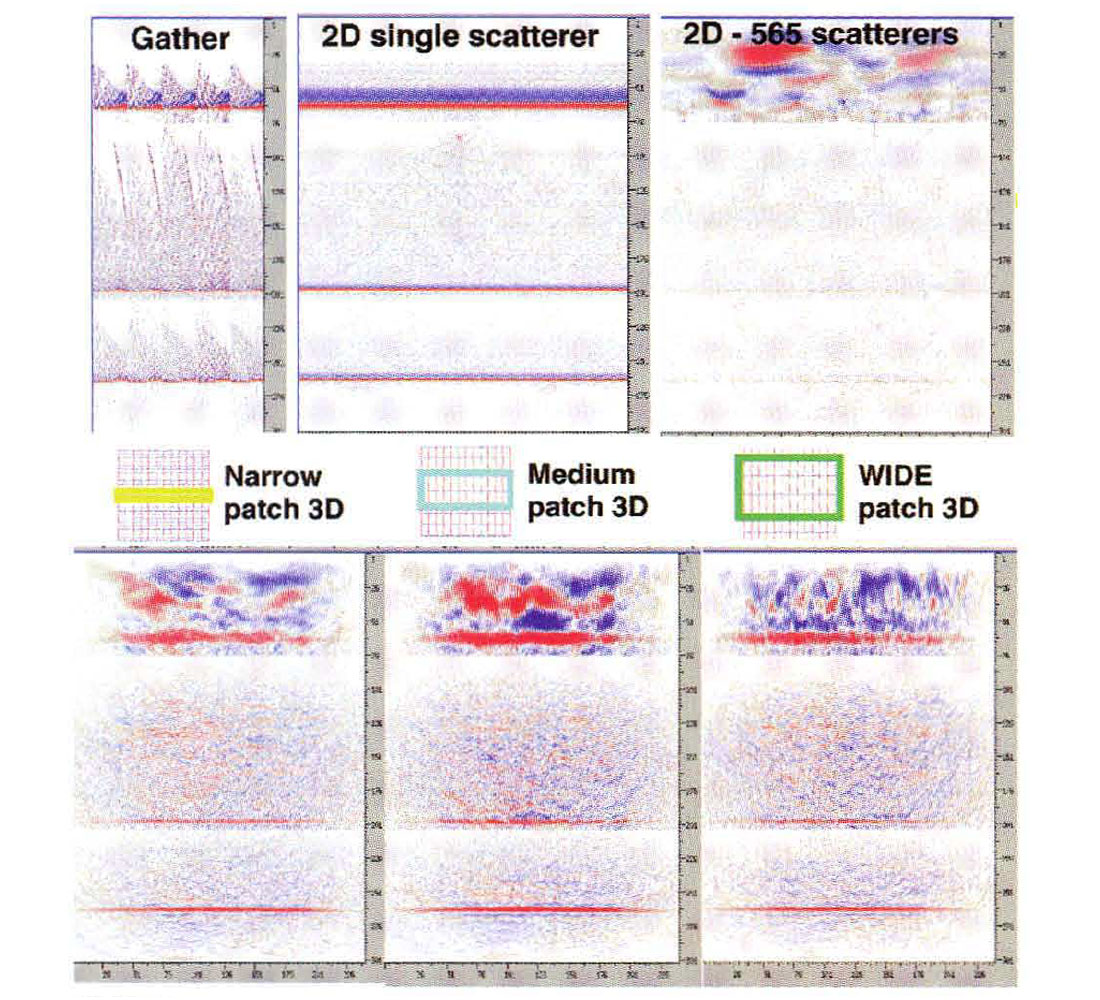
The time position of the backscatter event is nearly identical across any group of five or six adjacent traces in each 60 fold 2-D gather, so that much of the energy constructively sums during stack. In contrast, the low fold, multi-azimuth 3-D gathers show much stronger variety in the position of the NMO corrected backscatter energy. This occurs because the apparent velocity of the backscattered event varies with the cosine of the angle between; the source to receiver azimuth and the scattering point (See Figure 1.) The backscatter energy is so under sampled, it appears to be random in each gather. Adjacent 3-D gathers show the data is not random but actually organized in typical diffraction hyperbolas, but within a single gather, the noise will likely not sum constructively during stack, consequently yielding some signal to noise benefit. This point is illustrated further using examples of stacks for a single scattering point. The top of Figure 5 shows a zero offset, single fold, near trace plot, with the energy from the single offline scattering point clearly visible as a hyperbolic diffraction pattern. The section in the middle of Figure 5 shows the scattered energy remaining after stacking with 60 fold 2-D acquisition. The energy blurs at the apex, but becomes more coherent on the tails of the diffraction, when the apparent velocity of the offline scatterer is closer to the subsurface stacking velocity. For multiple scatterers, this phenomenon may give rise to the familiar cross-hatch pattern on stack seismic sections. The section at the bottom of Figure 5 is the result of 12 fold 3-D acquisition geometry. The energy is much more dispersed over the whole backscatter diffraction curve, suggesting that the multi-azimuth nature of 3-D seismic may contribute to attenuation of backscattered noise.
The stacks for the five simulated acquisition geometries, including the energy of 565 surface scattering points, (shown in Figure 6) illustrate the advantage of 3-D azimuth variation for attenuation of backscattered events. The marked difference in character between the 2-D and 3-D appears as strong linear coherent noise trains on 2-D and as; choppy, less coherent, lower amplitude noise trains on 3-D. The effect of the wide azimuth induced mis-stacking of backscattered noise is apparent on the 3-D data, with the widest recording patch (and lowest fold) yielding the best attenuation of noise.
Pre-stack depth migration was also tested on the five model geometries to verify the prediction of Lamer et. ai. that prestack 3-D migration would attenuate the backscattered noise via imaging. The results matched the predictions, with 3-D prestack migration (Figure 7, bottom) providing significantly better attenuation of the noise compared to 2-D prestack migration (Figure 7, top). While 2-D migration effectively filters the diffraction tails of the scattered noise, the image of the scatter field is erroneously positioned in the subsurface vertical plane of the 2-D (Figure 7, top center), rather than in the horizontal plane of the surface, as in the 3-D prestack migration. When all 565 scatter points are included in the 2-D migration, the scatter image points, which should be in the surface plane, "fold" down into the subsurface image plane, and swamp the three horizontal reflectors (Figure 7, top right). The 3-D migration program correctly moves the energy to the surface plane in all three 3-D geometry cases. This resulted in a much clearer image on 3D migrated datasets compared to 2-D migrated datasets.
Stomping out the footprint
The residual backscatter noise is more visible, and easier to analyze on the depth slices of each horizon (Figure 8, top left). The nine depth slices display a combination of acquisition footprint and imaging footprint, caused by the residual backscatter noise left behind after migration, and an overprint acquisition-migration footprint caused by the interaction of the recording geometry and the imaging process itself. Even considering both these effects together, the wide patch image compares quite favorably to the more expensive medium, and narrow, patch alternatives.
The effects of imaging footprint vs. backscatter footprint are more effectively separated by viewing the same model data, with only one scattering point included (Figure 8, top right) . Here the acquisition migration image footprints for the largely uncontaminated flat horizons are clearly visible. As expected the finer line spacing of the narrow patch geometry produces a very fine mesh of footprint on the horizons. (They should appear solid red if no errors existed.) The coarser wide patch geometry creates a broad grated footprint on the horizons. Despite the spatial frequency differences in the patterns, they are equally visible on the 450m and 1800m horizons for both patch sizes, and contain nearly identical peak to trough amplitude variations. The pattern is more visible on the wide patch 3300m slice, than on the narrow patch equivalent horizon. It is interesting to note that this result is not seen on the depth slice with multiple scatters (Figure 8, top left) or on the rea l data examples (Figure 3), suggesting that other mechanisms for footprint masking might occur. The shallowest slice, (Figure 8, top right) taken through the plane of scatterers is also interesting, and illustrates how residual errors after imaging the scattering point are affected by patch geometry. The narrow patch model images the scatter point as a cigar shaped feature, while the wide patch depth slice contains a star shaped image. Predictably the slices through these points exhibit some residual shape which mimics the recording geometry.
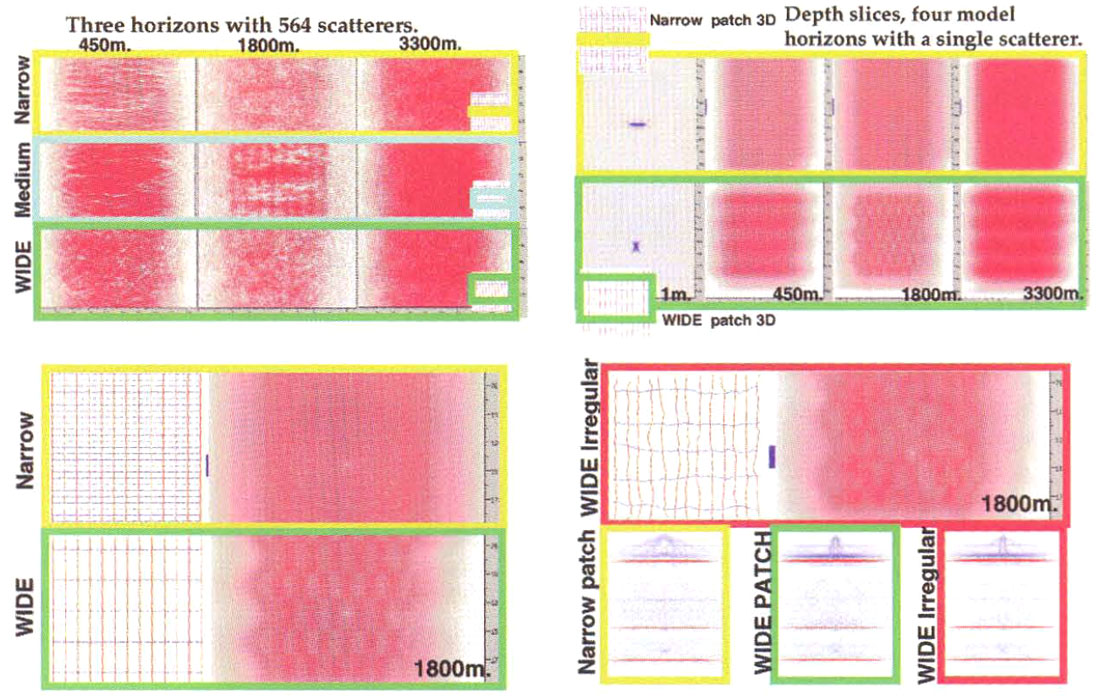
The deeper slices (Figure 8, top right) also contain residual noise from imperfect imaging of the single scattered point. This is most clearly seen on the narrow patch slices as a series of concentric circles. The narrow patch appears to attenuate the backscatter diffraction noise more poorly than the wide patch geometry, although it is difficult to see against the strong migration induced imaging footprint. As previously noted, this migration imaging footprint is not seen to the same extent on the depth slices of the foothills dataset (Figure 3). Much of the acquisition-imaging footprint can be alleviated by inducing irregularity into shot and receiver station placements (Figure 8, bottom). Irregularity of station positions is common in land 3-D acquisition, as slope chaining along topography will cause foreshortening of station intervals, and emphasis on using existing cut-line in forested areas will perturb an otherwise regular line spacing and direction (evident on the shot receiver line maps in Figures 2 and 3). The depth slice through the 1800m horizon using irregular station placement shows the benefit of pseudo-random perturbation for masking the imaging-acquisition footprint. The three sections (Figure 8, bottom right) also show that irregular station placement has better imaging of the surface scatter point, with the halo surrounding the surface scatter point image appearing smaller than either of the regular station interval images.
Data example of backscatter attenuation via 3-D migration
3-D prestack time migration has proved to be very useful in attenuating backscattered noise on a recent 3-D dataset from Northern Alberta. Typically backscattered noise is difficult to recognize on seismic data, appearing as general background "fuzz" on shot records, and linear noise trains on stacks. The 3-D dataset shown in Figure 9. contains some very strong noise events, originally thought to be direct arrival noise. Detailed investigation of the shot records indicated that the noise originates as horizontally traveling refraction energy which reflects from particular meander sections of a steeply incised river channel.
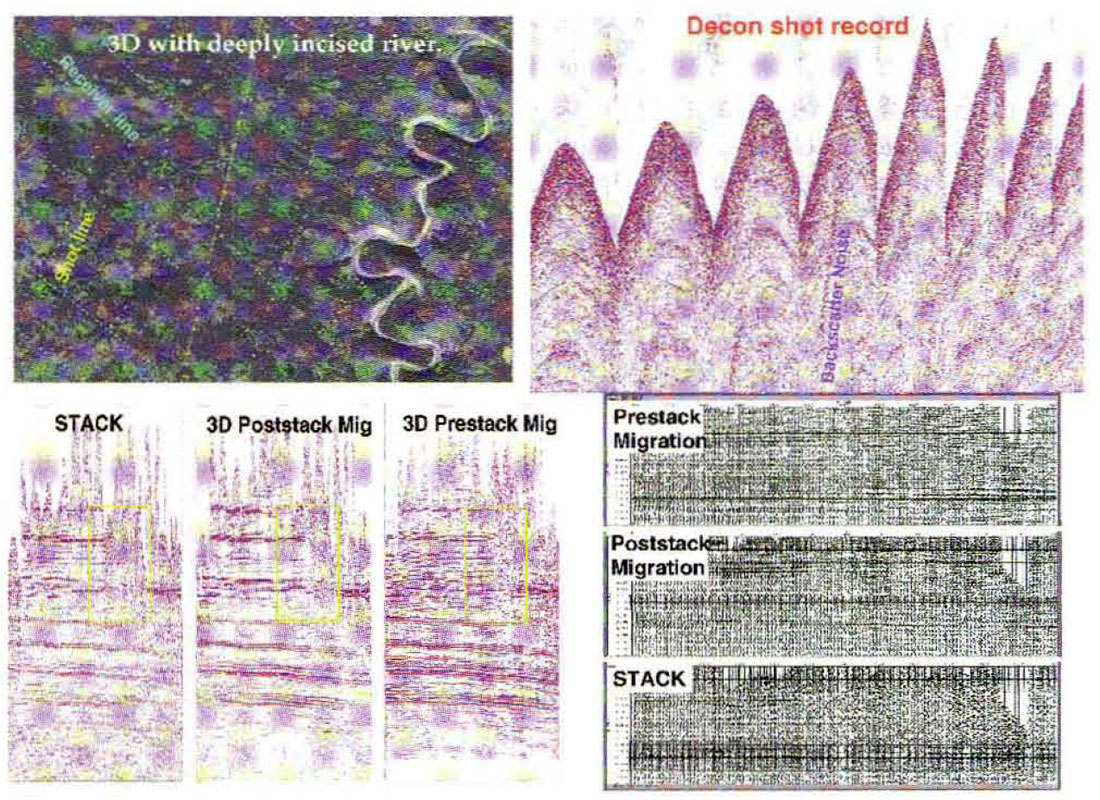
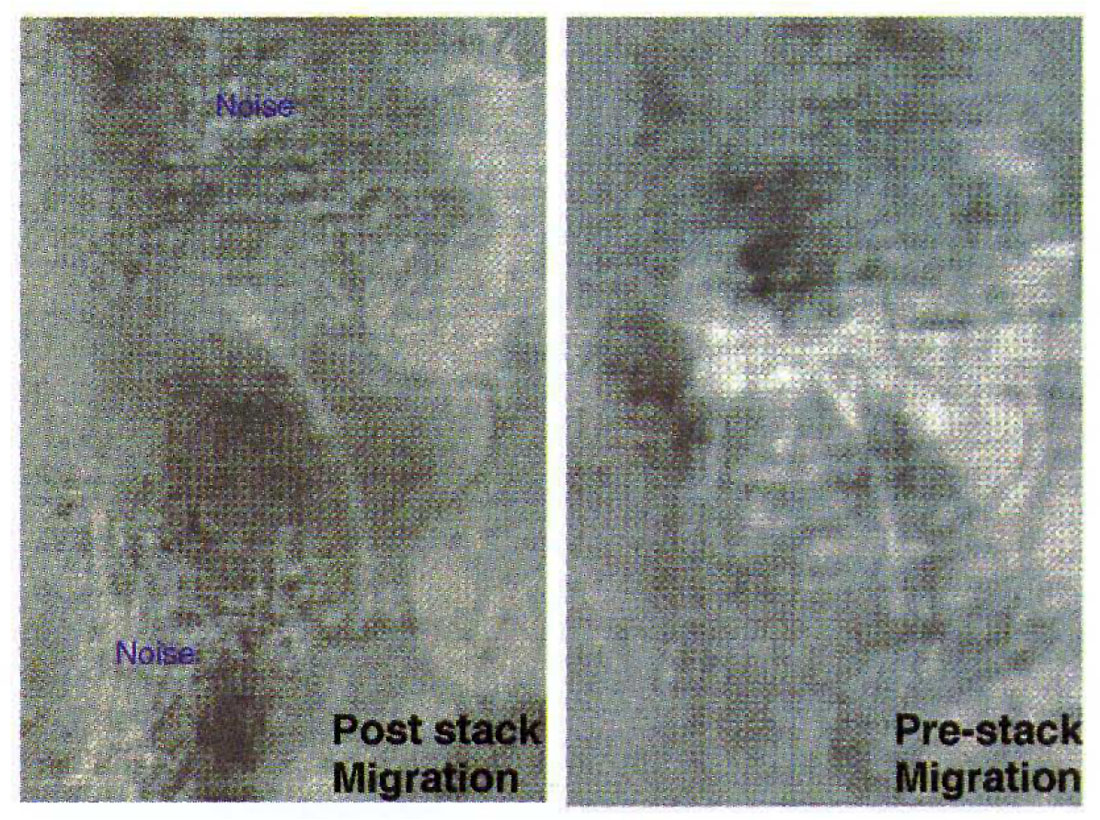
Despite the disturbing effect the noise created on the continuity over the zone of interest, the occurrence of discrete, identifiable backscatter on this particular dataset affords a rare opportunity to investigate the attenuation characteristics of modem processing flows . The 3-D dataset was acquired using a widepatch Sparse 3-D technique, with eight receiver lines live, as shown in the map (Figure 9, top left), and shot record (Figure 9, top right). The widepatch nature of the 3-D acquisition provides some attenuation of the backscatter noise at the stack stage, however 3-D post-stack time migration removes the noise significantly, and 3D prestack time migration provides the greatest attenuation of the backscatter events. (See Figure 9, bottom left and 9, bottom right.) The superiority of the prestack migration for backscatter attenuation could be attributed to the ability of prestack migration to image and attenuate the diffraction tails of the near surface scattering locations, before they are attenuated in the stack process. Preserving the apparent steep dips during stack would require an extremely good DMO application. Despite the lack of DMO, and the subsequent poor fidelity of the diffraction tails in the stack, the poststack 3-D migration does attenuates much of the diffraction energy from the scattering on the river channel, although not to the same degree as the prestack migration. The effectiveness of prestack time migration for backscatter noise attenuation is also apparent on time slices through the migrated cubes. The post stack slice (Figure 10, left) shows a higher level of noise compared to the prestack time migration (Figure 10, right).
Conclusions
The data examples, comparing 2-D against 3-D, suggest surface effort, denoted by stack fold, may be significantly reduced in the 3-D case. The data examples comparing various 3-D patch geometries illustrate that surface effort during acquisition is not a reliable predictor of image quality, an d wide patch acquisition can produce better images, for lower overall effort, than other common acquisition patch geometries. Model studies show that 3-D acquisition and processing attenuates backscattered noise far better than 2D acquisition, using either s tack or pres tack migration processes. Model studies indicate that wide patch 3-D geometry can attenuate backscatter more efficiently than narrower patch geometries. The final data example shows that 3-D prestack migration removes noise caused by backscatter from an incised river channel. Techniques such as wide patch 3-D which hold the promise of higher data quality for lower cost are rare, and merit further attention.

Acknowledgements
J. Gittens, Veritas seismic processing
M. Stratton, Amoco Canada
S. Gray, Amoco Canada
J. Etgen, Amoco E&P Technology
C. Regone, Amoco E&P Technology
J. Smith, Amoco E&P Technology


Join the Conversation
Interested in starting, or contributing to a conversation about an article or issue of the RECORDER? Join our CSEG LinkedIn Group.
Share This Article