The majority of the world’s petroleum resources are contained in heavy oil and oil sand reservoirs. Average recoveries from heavy oil and oil sand reservoirs are typically low ranging from 5 to 15 percent for cold heavy oil production and from 30 to 85 percent for steam-based in situ processes. Two reasons account for this: first, geological heterogeneity in the form of variable rock and rock-fluid properties and second, fluid heterogeneities in the form of variable fluid composition. Geological heterogeneities refer to spatial variations of porosity, permeability, relative-permeability curves, shale and mud layers, etc. Fluid heterogeneities refer to spatial variations of the fluid composition and properties such as viscosity and density. We will show that the controlling variable on recovery of these resources is fluid compositional variations.
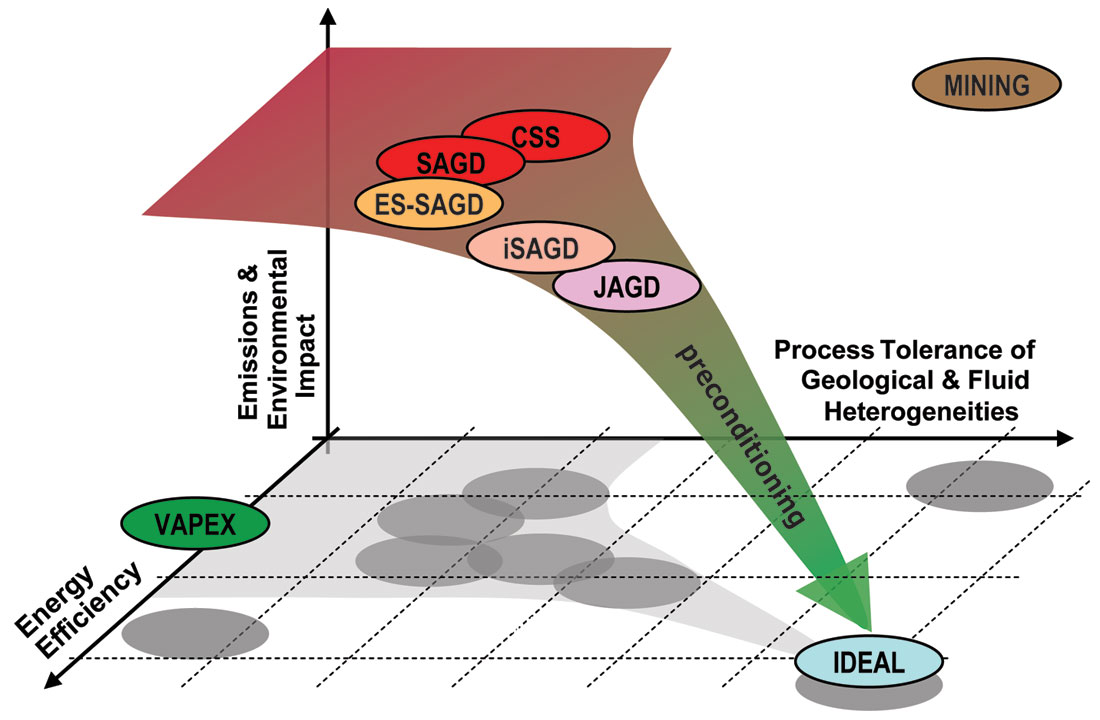
Figure 1 displays the three axes that define a recovery process for oil sands: tolerance to geological and fluid heterogeneity (Geotolerance), environmental impact (gas emissions and water use), and energy efficiency. A recovery process such as mining is geotolerant, i.e., heterogeneity does not matter since all of the oil sand is processed and the oil recovery factor is high typically higher than 90%. However, mining is only suitable for shallow resources, is very costly, and has high carbon dioxide emission and other environmental penalties. In situ processes to produce viscous and poor quality oils rely on high pressure primary production, as in cold heavy oil production, or thermal and/or solvent-based methods to mobilize the oil by reducing its viscosity. The key problem of these processes is that they are not very geotolerant, that is, their performance is adversely affected by the reservoir geology and fluid heterogeneity. Also profit margins are small because of high capital and operational costs. Also, thermal processes produce large amounts of carbon dioxide emissions and use huge volumes of water. We believe this geo-intolerance, the excessive emissions and environmental impact, and consequent energy losses can be reduced and are due to insufficient tailoring of recovery processes to geological and fluid property variability commonly seen in heavy oil and bitumen reservoirs.
Heavy oil and bitumen reservoirs exhibit significant variation of oil composition and thus fluid properties, such as oil viscosity and density both vertically and laterally throughout the reservoirs1. Fluid properties commonly vary by one or more orders of magnitude across the thickness of a reservoir or laterally over the distance of a single horizontal production well. The flow rate of bitumen in a reservoir is given by Darcy’s law:
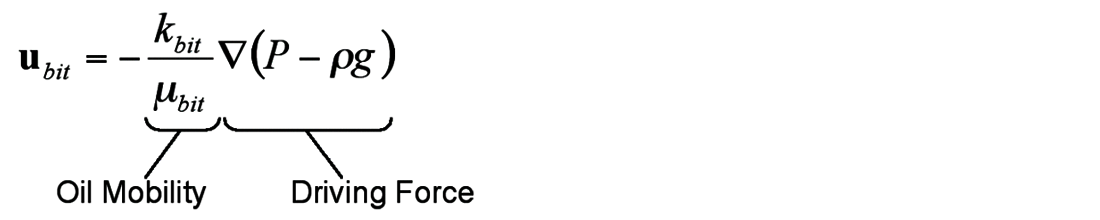
There are two components to this equation: first, the oil phase mobility (the quotient of the oil phase effective permeability and its viscosity) and second, the driving force. This means that the flow rate of oil can be enhanced by increasing the oil mobility or raising the driving force, that is, the pressure gradient. If in gravity drainage mode, as is the case in Steam Assisted Gravity Drainage, then the only control on flow rate is the oil mobility because the acceleration due to gravity is constant. Thus, the key control on a gravity drainage recovery process is the oil mobility. In a reservoir where the permeability varies 2 to 3 times over the vertical range of the reservoir, if the oil viscosity varies by orders of magnitude, then the control on the variability of the oil mobility is the viscosity and thus the viscosity is the most important factor controlling flow in heavy oil and bitumen gravity drainage processes.
It has been our experience that the lower viscosity oil phase is at the top of the reservoir. For example, a Peace River viscosity profile is displayed in Figure 2. At the top of the reservoir, the oil viscosity is about 80,000 cP whereas at the bottom it is about 1.75 million cP at 20°C. This is a 22 times increase in the viscosity of the oil phase going from the top of the reservoir to its bottom. From Figure 2, permeability rises to the bottom of the reservoir by about seven times. Permeability coupled with oil viscosity results in oil phase mobility ranging from about 0.017 mD/cP at the top of the reservoir to about 0.000030 mD/cP at the bottom. That is, oil at the top is about 500 times more mobile than oil at the bottom. This of course has direct consequences for production of heavy oil from this reservoir. In such a vertically graded reservoir, the best place to position the production well is near the top of the reservoir in the lower viscosity material.
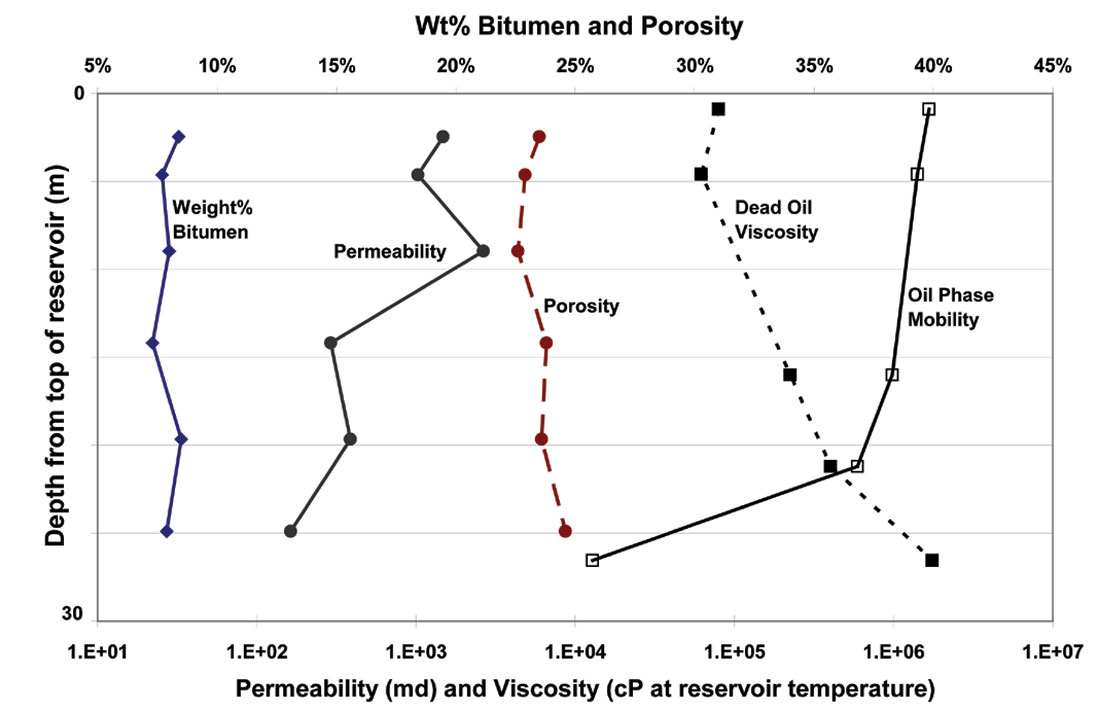
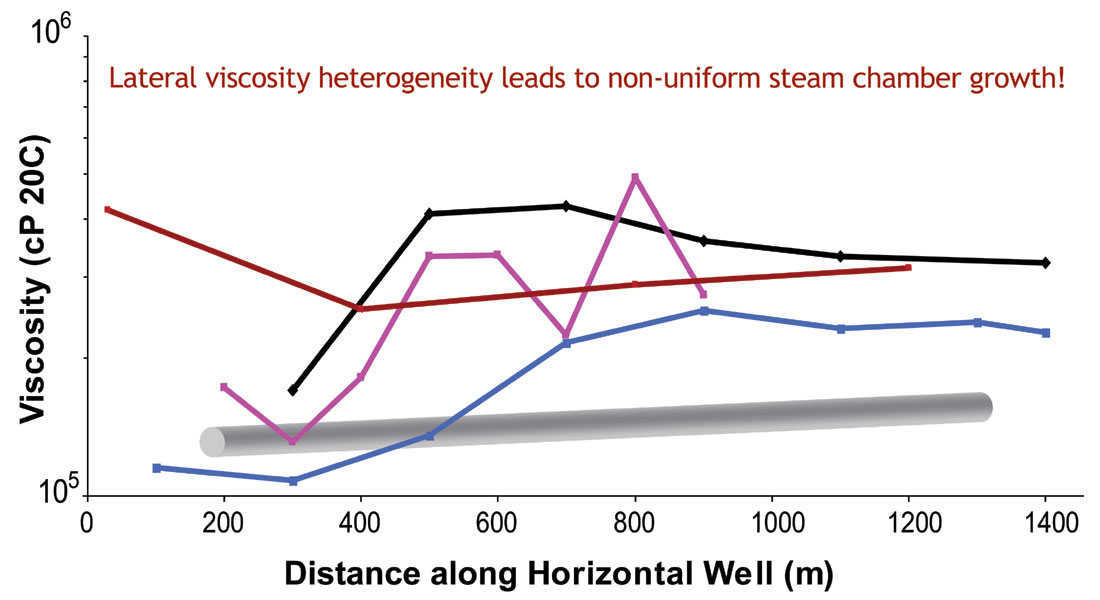
Figure 3 shows the variation of viscosity along four different horizontal wells. In each well, the viscosity varies significantly over distances of up to 1300 m. In a reservoir with large areal variations of oil viscosity, the production well should maximally intersect the lower viscosity portions of the reservoir. For thermal process design, the better quality, lower viscosity oil is typically at the top of the reservoir. Therefore, to accelerate production, well placement should be designed to recover this oil first.
Variability not uniformity of oil properties seems to be the rule! Here, we summarise types of variations in fluid properties seen in heavy oil and bitumen reservoirs, briefly describe how they are formed, and then illustrate how geotailored recovery processes can be designed to take advantage of the viscosity variation. Incorporation of oil viscosity variations into reservoir simulations is a necessary step to design optimal recovery technologies for heavy oil reservoirs.
Fluid Heterogeneity is Caused by Biodegradation over Geological Timescales
Heavy oils can form via biodegradation of conventional crude oils, that is microbial metabolism or conversion of hydrocarbons to biogenic gas (e.g., CO2 and methane), over geological timescales1,2,3. Since the microbes need to live in free water and have access to essential water-borne nutrients, biodegradation occurs at the oil-water contact (OWC) under anaerobic conditions4 in high water saturation zones usually at the base of pay. The degree of and rate of biodegradation is mainly controlled by reservoir temperature, feed components and nutrients, and extent of oil-water-contact area and oil volume, reservoir water salinity3,7. The Western Canada heavy oil province in general follows worldwide trends but is more complex because long residence times of oils in the reservoir and the stopping of primary oil charge post Laramide orogeny and basin inversion7.
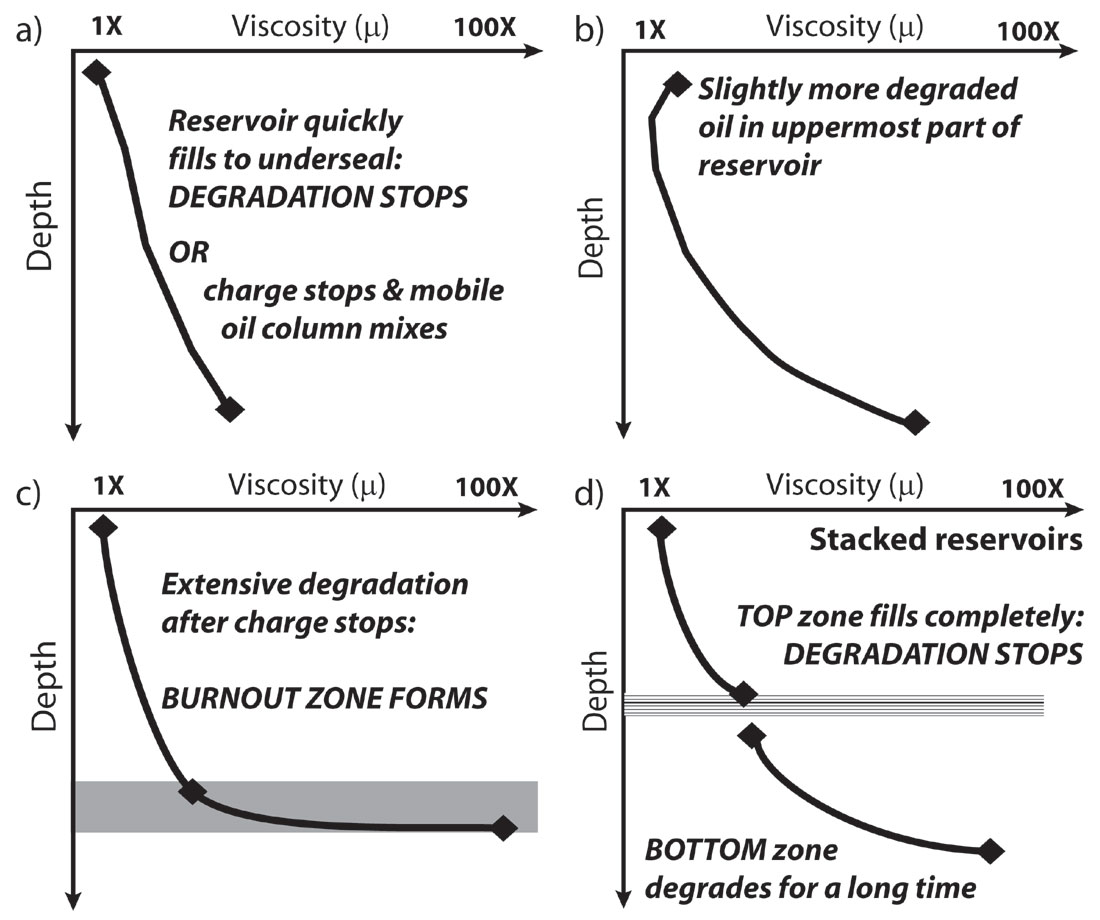
Compositional gradients are the result of buoyant lower-density fresh oils preferentially charging the top of the reservoir while or charge stops and lighter oil column slowly mixes. In case (b), at the top of the oil column we find slightly more viscous and more degraded oil which may be related to increased degradation due to top water or late stage degradation at the top of the reservoir by influx of top water due to leakage of top gas. Below this top zone is a curved profile which develops by slow diffusive mixing of oil column after main charge stops. Case (c) indicates extensive biodegradation which continues after charge stops with a basal burnout zone. Case (d) is representative of stacked reservoirs (only two shown here) separated by mudstones. Generally, the upper reservoir fills first completely and degradation stops, whereas degradation proceeds for a longer time in the lower zone.
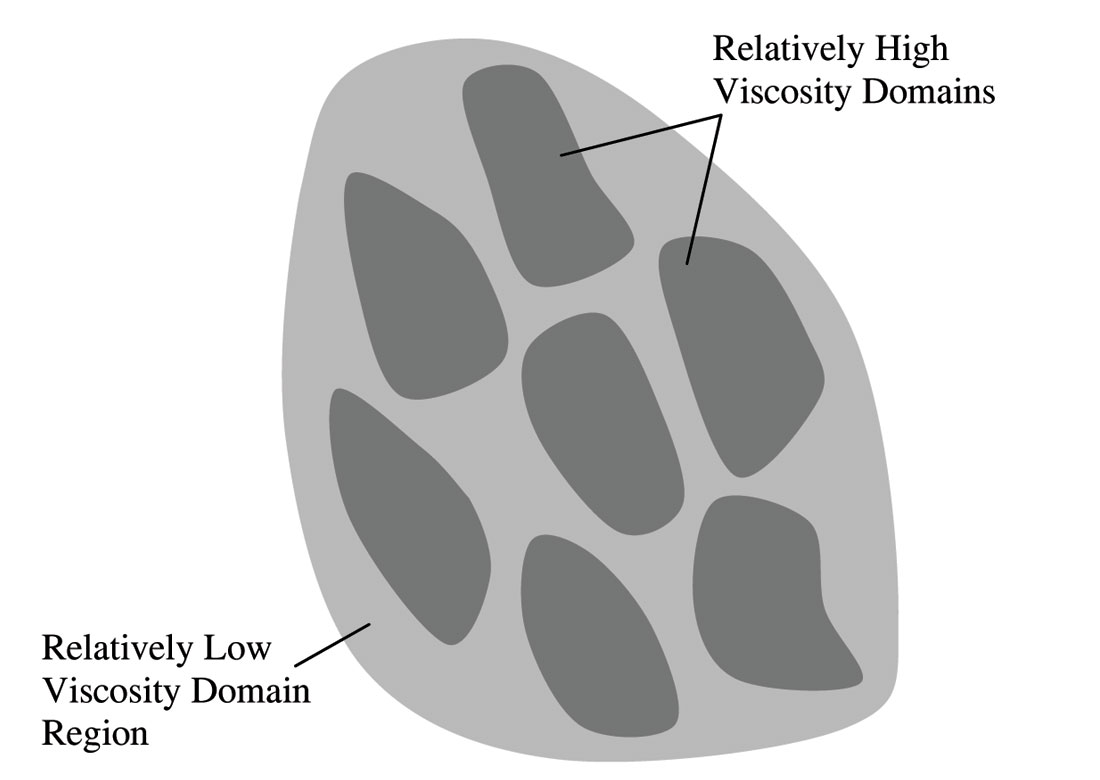
As shown schematically in Figure 5, viscosity variations exhibit areal patterns, for example, lower viscosity “fingers” are often embedded between higher viscosity “islands” though variation is typically smooth and wavelike unless faulting is involved. Lateral oil viscosity variations occur smoothly with changes of between 2 and 10 times on lengthscales of 500 to 1000 m. This is a result of the interplay over geological timescales of oil charge rate, diffusion and mixing, and biodegradation rate which is controlled by proximity to water legs among other factors. This process is continuous and so rather than distinct oil viscosity domains, a graded transition between relatively high and relatively low viscosity regions exist. Intersecting viscous fluid regions and complex sedimentologically controlled permeability domains result in reservoir with complex oil mobility variations. Thus, for gravity drainage recovery processes where oil mobility is the chief control on oil movement, the placement on wells becomes critical. Delineation of these reservoirs is necessary to create high resolution fluid property maps. By considering a map as shown in Figure 5, for recovery processes that use long horizontal wells, the optimal well trajectory would not be a straight one. Geotailoring cold or thermal production wells for this reservoir would involve routine optimization of complex well trajectories in 3D, well spacing, and well length. The optimal well configuration may be quite different from a standard SAGD one!
Impact of Fluid Property Variations on Recovery
The oil mobility gradient has direct impact on how a horizontal well would inject fluid into and produce oil from a reservoir. Irregular steam chamber growth for example may well be the result of lateral viscosity gradients. The mobility heterogeneity at start up may promote non-uniform steam conformance which adversely impacts production. Recovery processes designed to perform in uniform fluid mobility reservoirs will have difficulties in a typical Western Canadian oil sands reservoir.
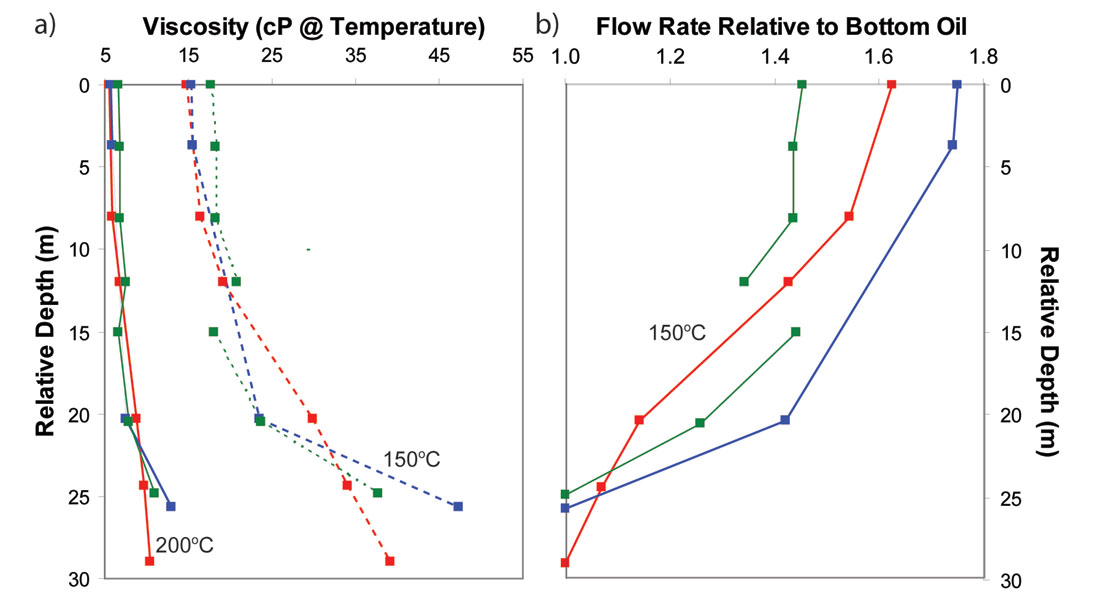
Gravity-drainage recovery processes rely on steam temperature fluid properties. While vertical viscosity variations are common at reservoir temperature, viscosity gradients are often assumed to be negligible at steam temperature yet varying oil composition and physical properties including temperature effects on viscosity would be expected. Figure 6 displays a plot revealing how vertical oil viscosity varies by a factor of up to four in two Peace River oil sand reservoirs at steam temperature (215°C) and the temperature of the mobilized oil at the edge of the steam chamber (200°C). Viscosity data were extrapolated from a suite of high temperature dead oil viscosity measurements (up to 185C) by using the ASTM-D341 equation. Thus, even at steam temperatures, viscosity variation in a reservoir impacts production. Figure 6 also displays the oil flow rate relative to the bottom oil under gravity drainage. This means that even for a steam process, the ideal place to start a steam chamber is actually near the top of most reservoirs – not the bottom.
Geotailoring Recovery Processes for Reservoirs with Viscosity Variations
There are two requirements for any heavy oil or bitumen recovery process: first, the oil must be mobilized and second, the mobilized oil must be delivered by some driving force to the production wellbore. In SAGD, steam releases its heat to the bitumen and raises its mobility. Under gravity drainage, the mobile bitumen flows through the steam chamber and along its sides to the production wellbore. This is an elegant process which is very suitable for highly permeable, homogeneous reservoirs containing constant viscosity oil.
If a unit of energy is injected into the top part of the reservoir, a lower viscosity, more mobile oil would result at the top of the reservoir than would be the case if that unit of energy had been injected into the more viscous bottom oil. Thus, for optimal energy efficiency, the amount of mobilized oil will be greater if the steam was initially injected into the top oil rather than into the bottom oil and to accelerate oil production and maximize recovery, the top oil should be produced first. This means that steam should be injected into the upper parts of the reservoir to accelerate production and produce the highest quality oil. This can be achieved by using a horizontal steam injector located at the top of the reservoir. If a SAGD well configuration was used, the production well would be positioned about 5 m below the injection well. In a 30 m reservoir, the lower 23 m of the reservoir below the production well would not be recovered. There is a balance between placing the production well high enough so that it accesses relatively low viscosity oil to facilitate steam chamber growth yet not too high in the reservoir so that ultimate recovery suffers. Ultimately, the SAGD configuration is not optimal for a viscosity-graded reservoir because either one of the oil rate or recovery will suffer at the cost of the other. The best well configuration would be one where gravity drainage supplies reservoir fluids to the producer, the wells are close enough to efficiently establish thermal communication, initial oil production is obtained from the lower viscosity bitumen in the upper portions of the reservoir, and the wells are situated to produce the oil from the lower parts of the reservoir to obtain reasonable recovery factors.
JAGD21: A Geotailored Process
A geotailored well configuration we have developed is the J-well and Gravity Drainage recovery process (called JAGD, formerly known as JAGASS, J-well and Gravity Assisted Steam Stimulation)21 as shown in Figure 7. In this well configuration, the steam injection well is located in the top few meters of the reservoir and is substantially horizontal along its trajectory. The production well consists of an inclined J-well which from plan view is in line with the top injection well. The toe of the production well is located several meters below the injection well whereas its heel is located near the bottom of the reservoir. Thus, the J-well intersects the majority of the reservoir cutting through geological heterogeneities throughout the reservoir.
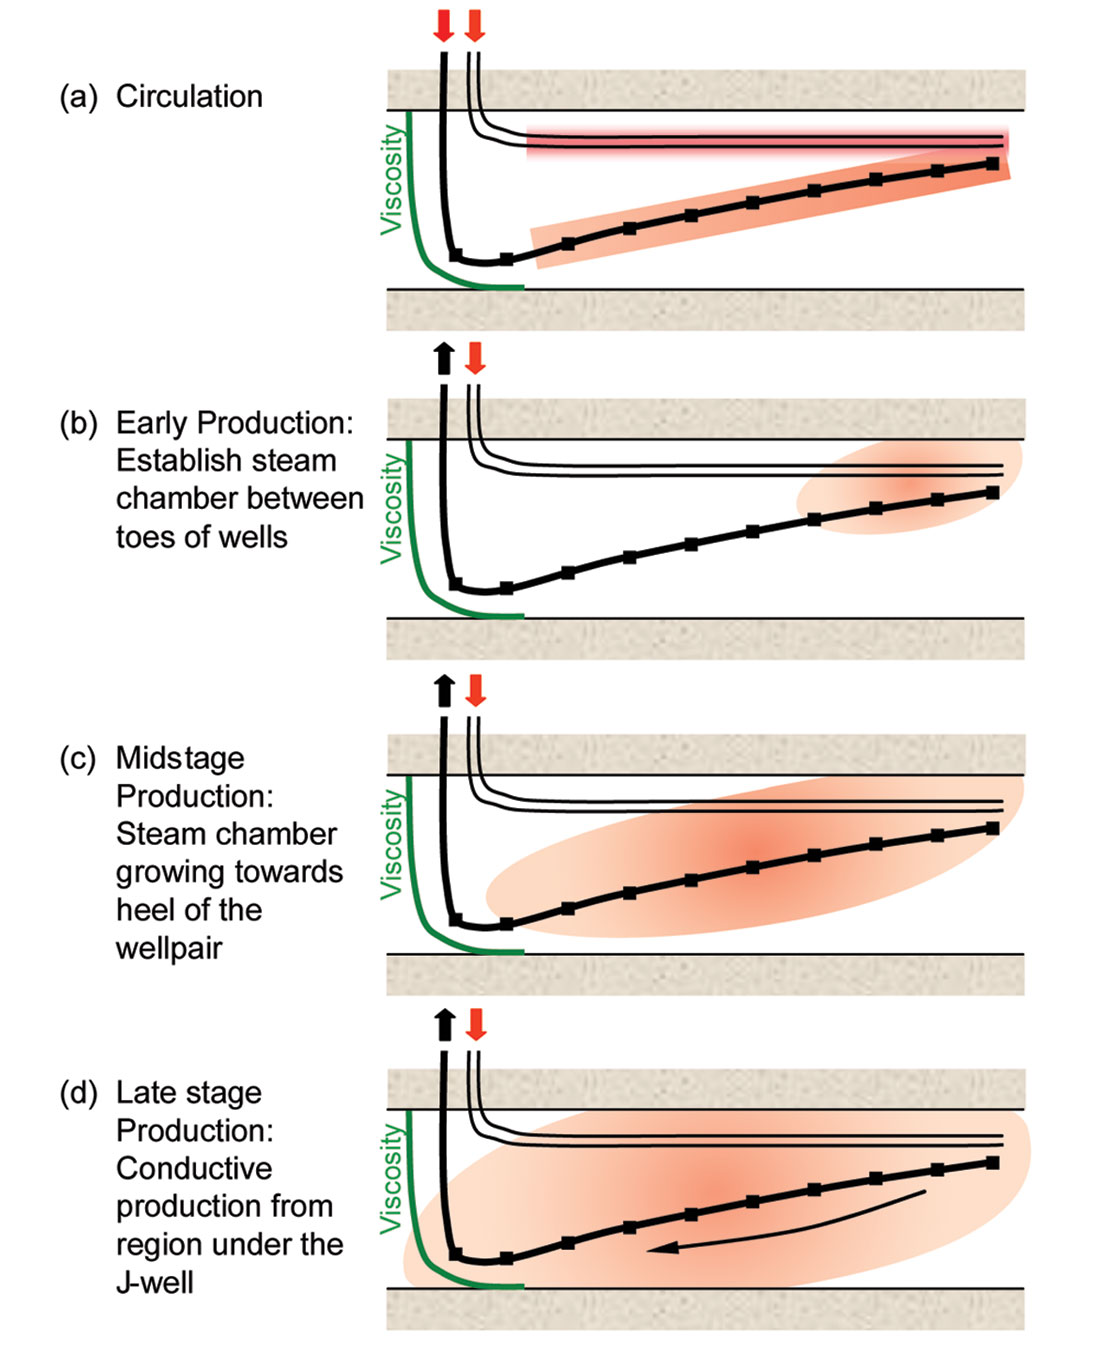
The JAGD process operates in a similar manner to that of SAGD21. As shown in Figure 7a, before production, thermal communication is established between the toes of injection and production wells by steam circulation. Because this is only done over a relatively small length of the wells compared to SAGD where communication occurs along the entire length of the wells, the circulation period for JAGD is less energy intensive and of shorter duration than that of SAGD. After thermal communication is achieved, then steam is injected into the injector and production is started out of the lower well as shown in Figure 7b. The heated mobile bitumen at the toes of the wells is flushed into the production well and a vapour depletion chamber is established there. At the edges of this small chamber, mobilized bitumen flows under gravity to the production well below and is removed from the reservoir. At the base of the chamber, steam condensate and mobilized bitumen accumulates to form a liquid pool above and within the production well. This acts to prevent live steam production from the chamber as is found in steam trap control in SAGD. The liquid bath in JAGD is shorter than that in SAGD where it exists along the entire length of the wellpair. In JAGD, this shortened interval implies more control of the steam trap above and within the production well than would be found in SAGD. As shown in Figure 7c, with continued steam injection, mobilized bitumen drains not only in the cross-well direction as is the case in SAGD but also in the up-well direction (from toe to heel) as the steam chamber evolves towards the heel of the J-well. Also, as this occurs, the steam chamber penetrates into deeper portions of the reservoir accessing bitumen in the lower parts of the reservoir. With conductive heating from the steam chamber to the portions of the reservoir below the J-well, this oil eventually drains in the up-well direction towards the heel of the J-well (Figure 7d). Thus, ultimate recovery from the reservoir is similar to SAGD.
The key benefits of the JAGD well configuration are21:
- Target more valuable, lower viscosity top oil. JAGD first produces bitumen from the upper regions of the reservoir and thus first produces the more valuable, lower viscosity, higher API gravity oil.
- Reduced steam volume. JAGD starts with a relatively small steam chamber at the wellpair toe so steam usage is lower in the earlier stages of the process than would be case in SAGD. Steam conformance along the injection well will be better achieved than in SAGD because the chamber grows from one end of the well to the other rather than along the entirety of the well at the same time.
- J-well accesses majority of reservoir. The J-well spans nearly the entire reservoir thickness. Fluid flow that would have been impaired by vertical barriers in SAGD would not suffer to the same extent in JAGD.
- Local steam trap control. The liquid bath only exists at the base of the chamber.
- Multiple gravity drainage directions. Mobilized bitumen drains along the edges of the steam chamber and parallel to the wells.
Several other modifications to JAGD can be applied to improve the process further21. For example, a movable packer or interval control valves could be used in the wells to better control the evolving steam chamber along the wellpair. Also, before drilling the J-well, if the oil viscosity is low enough and solution-gas drive large enough in the upper parts of the reservoir, the top well initially could be operated as a cold production well. After the cold production has become uneconomic, it would be then converted to steam service and used as a steam injector as described above. The cold production stage of the process could provide cash that could be used to develop the thermal stage of the process.
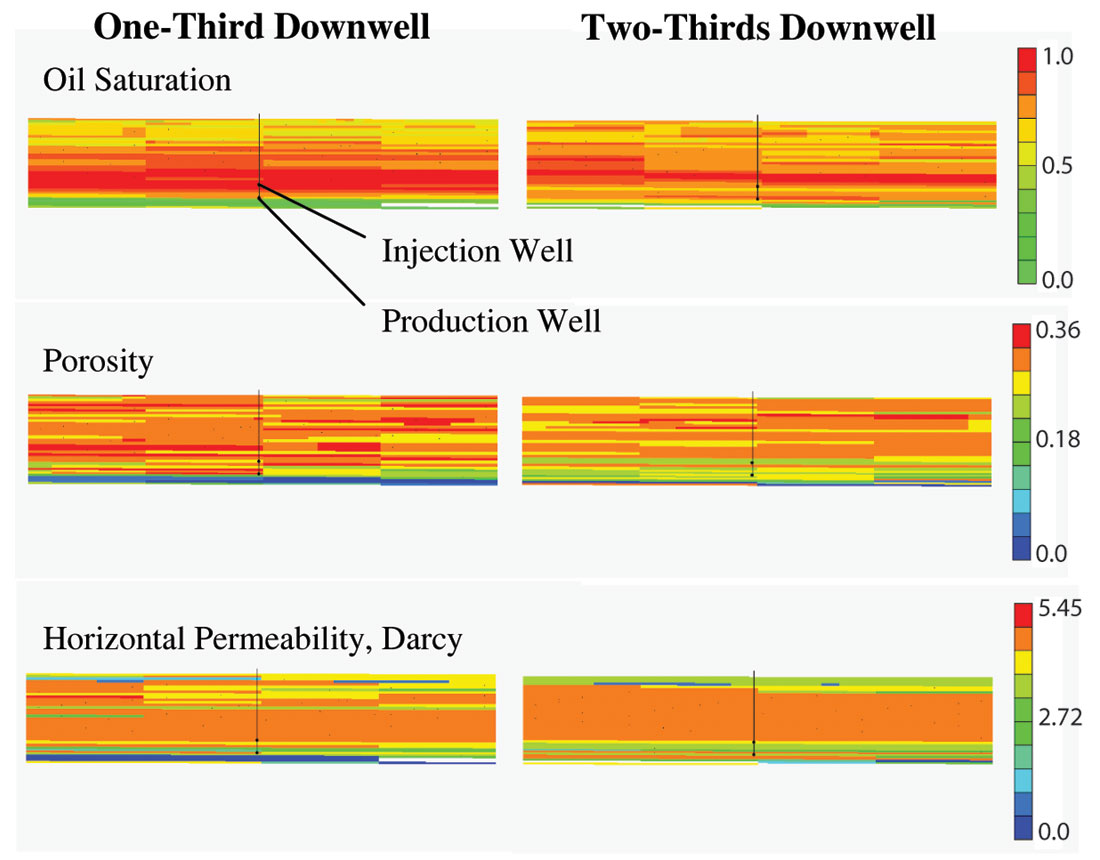
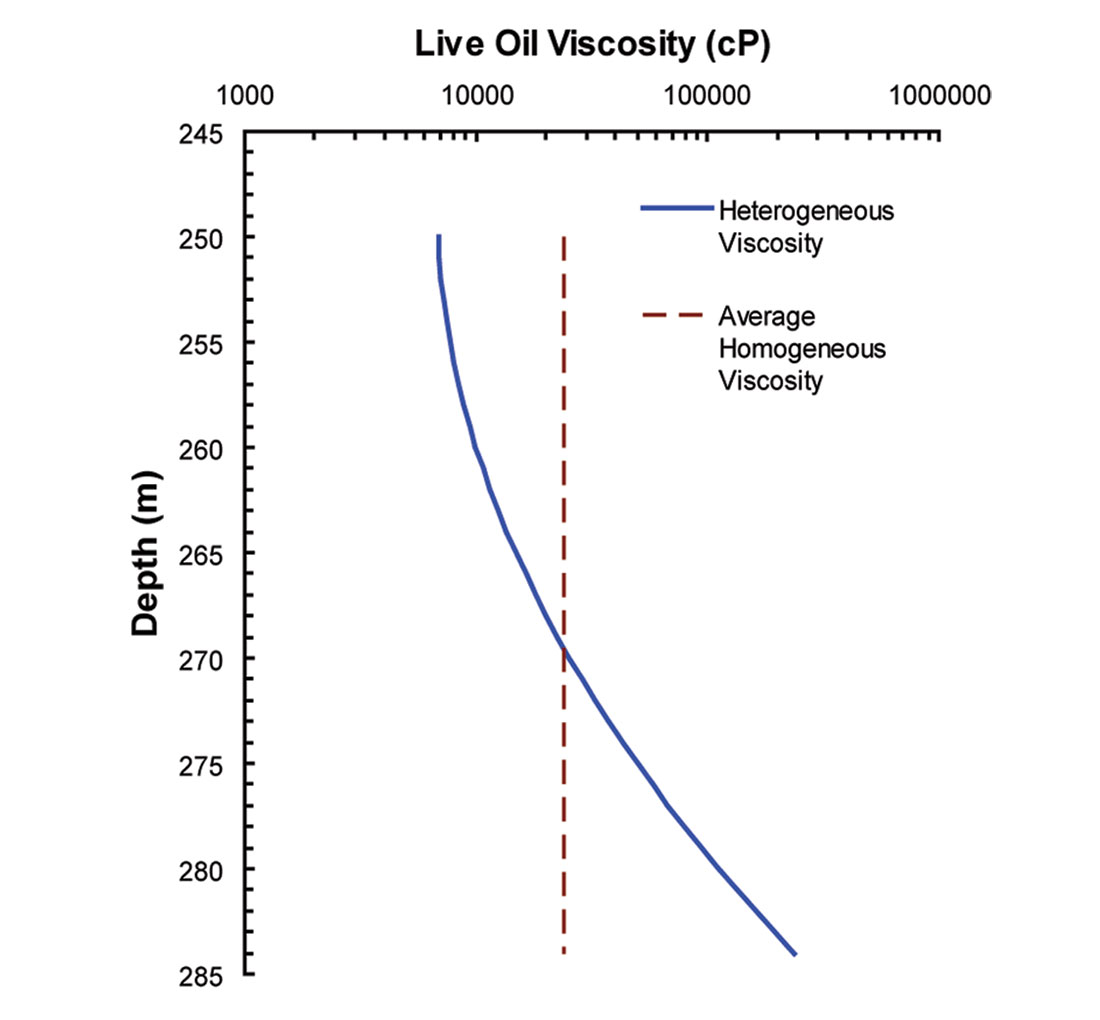
A reservoir simulation model was used to assess how well placement can be altered to improve the recovery factor and thermal efficiency of the process. Figure 8 shows sample cross-sections of the porosity, permeability, and oil saturation distributions. The reservoir thickness is 32 m. Initial reservoir conditions are 10°C and 2600 kPa at the top of the reservoir. Figure 9 shows the initial live oil viscosity profile. Viscosity variations are in the vertical direction and range from about 8,000 cP at the top to about 250,000 cP at the bottom of the oil leg (Figure 9).
The JAGD process has been simulated by using the CMG22 STARS™ thermal simulator and compared to an equivalent SAGD process in the same reservoir. In the SAGD model, a single well pair is placed in the centre of the reservoir model. The length of each well is 700 m. The location of the production well is 2 m above the bottom of the reservoir and oil leg with 5 m interwell spacing. Prior to SAGD, three months of steam circulation occurs to establish thermal communication. After steam circulation is done, SAGD mode starts with steam injection at 1000 kPa at 0.95 quality and fluids produced from the reservoir. In the JAGD model, the 700 m injection well is located 3 m below the top of the reservoir and at the toe the interwell spacing is 5 m. The production well is inclined so that the heel of the well is 2 m above the base of the reservoir. The heel of the production well is directly below the heel of the injection well. Similar to the SAGD model, steam circulation occurs for 3 months. After the wells are placed on production, the top well injects steam at 1000 kPa.
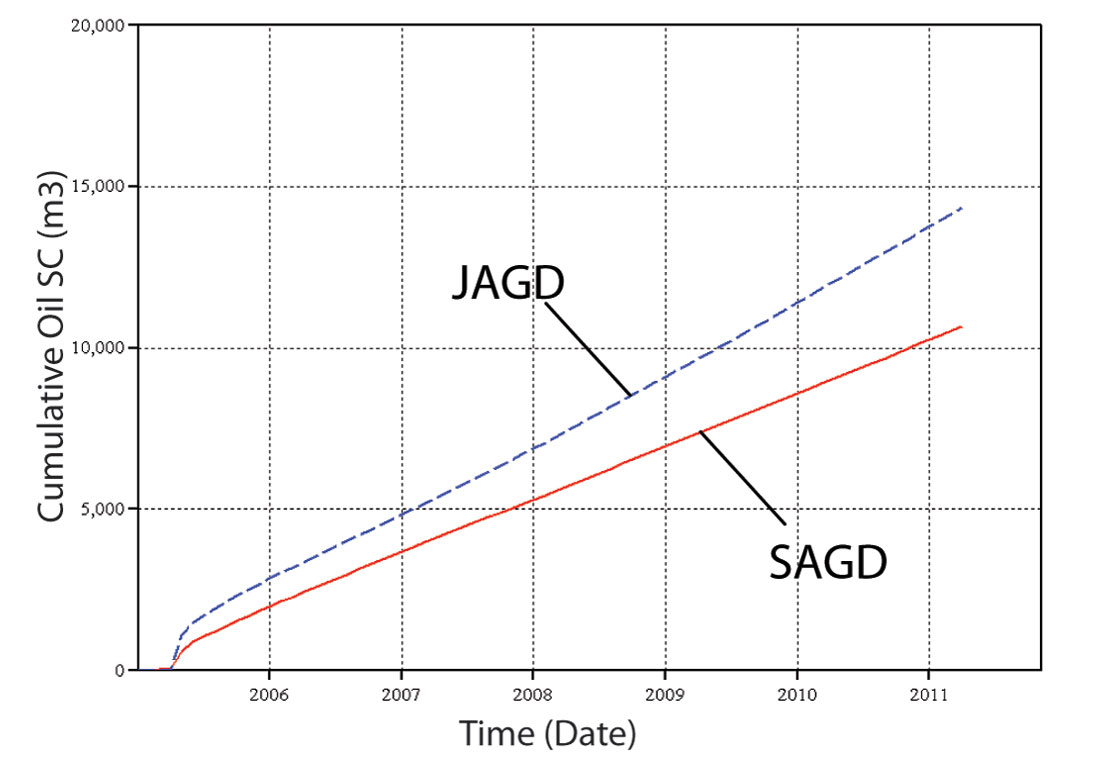
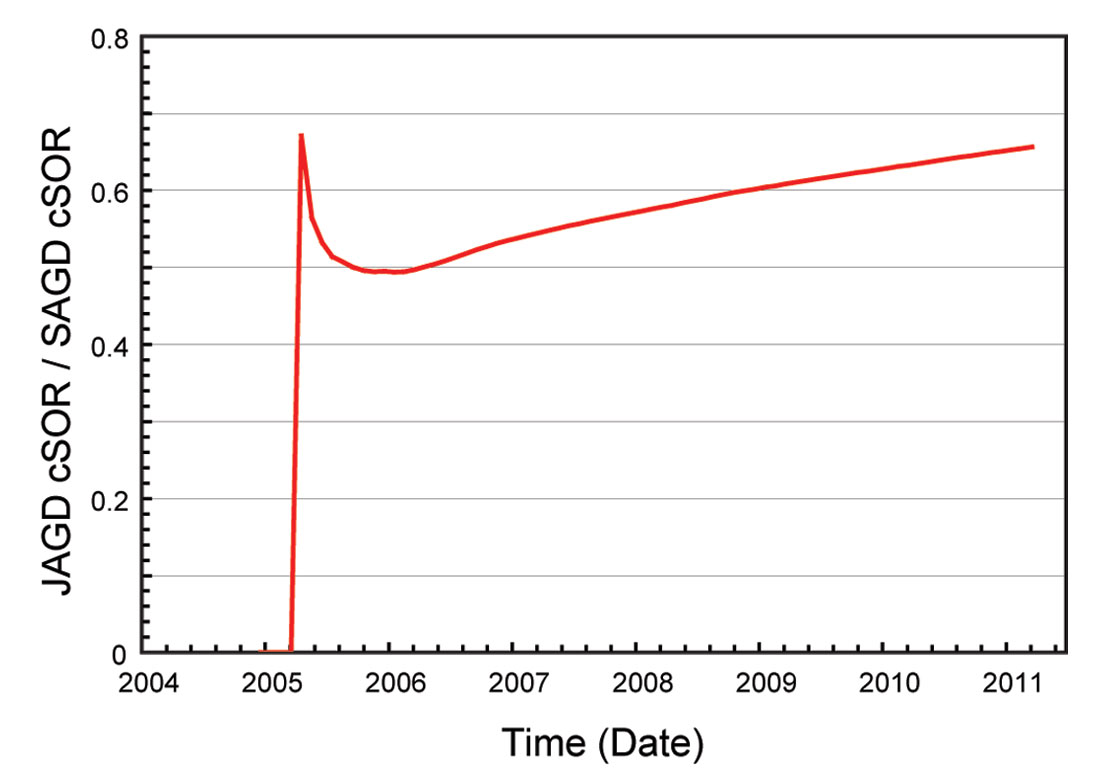
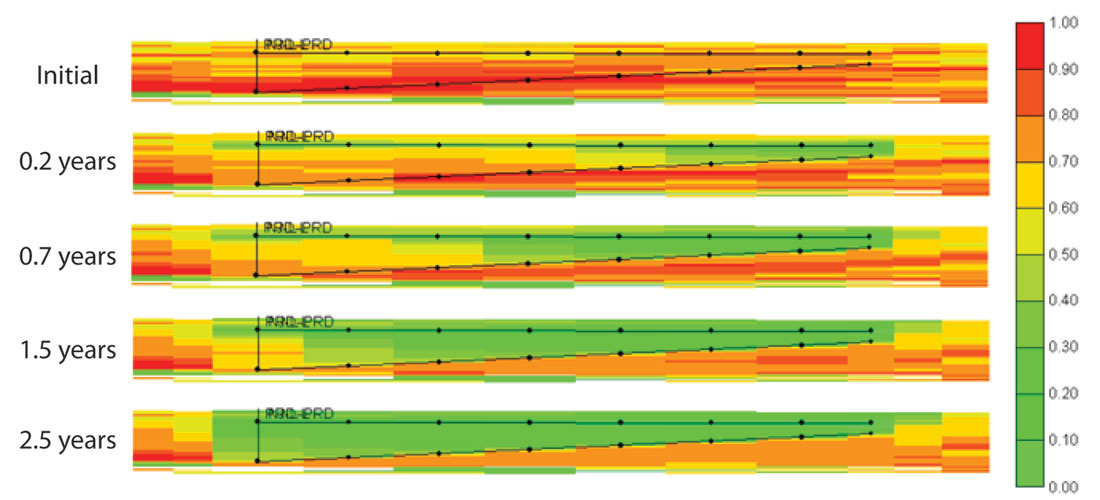
Figure 10 compares cumulative oil phase volumes in SAGD and JAGD operations in a reservoir with the viscosity profile displayed in Figure 9. The results show that JAGD produces more oil than SAGD over a seven year period. The initial rates are higher in JAGD because the steam chamber is accessing the lowest viscosity oil in the reservoir. Figure 11 plots the ratio of cumulative cSOR of JAGD and SAGD. The results show that steam usage per unit bitumen volume produced is between 50 and 65% that of SAGD; the thermal efficiency of JAGD is significantly higher than that of SAGD. Figure 12 shows cross-sections, in the downwell direction, of the oil saturation distribution as JAGD evolves. The steam chamber rapidly grows in the up-well direction as bitumen is produced from the reservoir. This is especially the case in the initial period of the process because the chamber is growing in the low viscosity oil region. As the chamber grows downwards by production from the J-well and starts to encounter higher viscosity oil, its growth slows down relative to that at the start of the process. As the chamber grows in the up-well direction, it also does so in the cross-well direction. The largest amount of steam chamber growth occurs at the toe of the wells where the steam chamber first starts. As the steam chamber extends in the up-well direction, the slope of the steam chamber is established along the J-well. Heat conducts from the hot chamber into the oil sand located directly underneath the J-well and mobilizes the oil there which consequently flows down towards the heel of the J-well. This can be seen by the reducing oil saturations in the region below the J-well as the process evolves.
In conclusion, the defining characteristic of oil sands is large vertical and lateral spatial variation in fluid properties, such as oil viscosity. These variations are related to the competitive effects of active oil charge, which increases oil quality and biodegradation at oil water contacts, which lowers oil quality, and produces large vertical and longer wavelength lateral gradients in composition, API gravity and oil viscosity. Typically the bottom of the reservoir contains the most biodegraded, most dense and most viscous oils. Lateral viscosity variations appear to occur smoothly on viscosity scales of two to ten times on lateral length scales from 500 m to 2 km unless faults are crossed where variations can be more dramatic. The impact of oil viscosity variations on recovery process performance promotes the notion that heavy oil production processes must take advantage of the viscosity variations to more efficiently produce these reservoirs . Recovery processes have to be geotailored to the target reservoir and its mobility ratio domain structure. This work also suggests that fixed guidelines such as locating the production well of a SAGD process a few meters above the base of pay may not always be the best design basis for heavy oil recovery processes. The impacts of vertical gradients in oil mobility have been demonstrated in the field where it is widely accepted that for cold production of heavy oil, the industry standard is to locate the cold production well in the top few meters of the reservoir. We have proposed the JAGD process which takes into account the oil phase viscosity variations to improve the economic and environmental performance of the production process.
In general, the complexity of oil mobility domains laterally and vertically in oil sand reservoirs suggests that non-linear well configurations are likely to more efficient than the current linear well combinations utilized in most processes. For design of heavy oil recovery processes, the coupling of fluid property heterogeneities into compositional reservoir simulation is we feel a necessary step to design of efficient heavy oil production processes. Truly integrated reservoir geoscience and engineering is the key and all the necessary tools are available to achieve this!


Join the Conversation
Interested in starting, or contributing to a conversation about an article or issue of the RECORDER? Join our CSEG LinkedIn Group.
Share This Article