Introduction
The high rewards of finding hydrocarbon in the sub salt plays make it very attractive for exploration endeavors. However, it is a challenging mission. Subsurface pressure uncertainty causes recurrent drilling failure to reach the objective targets.
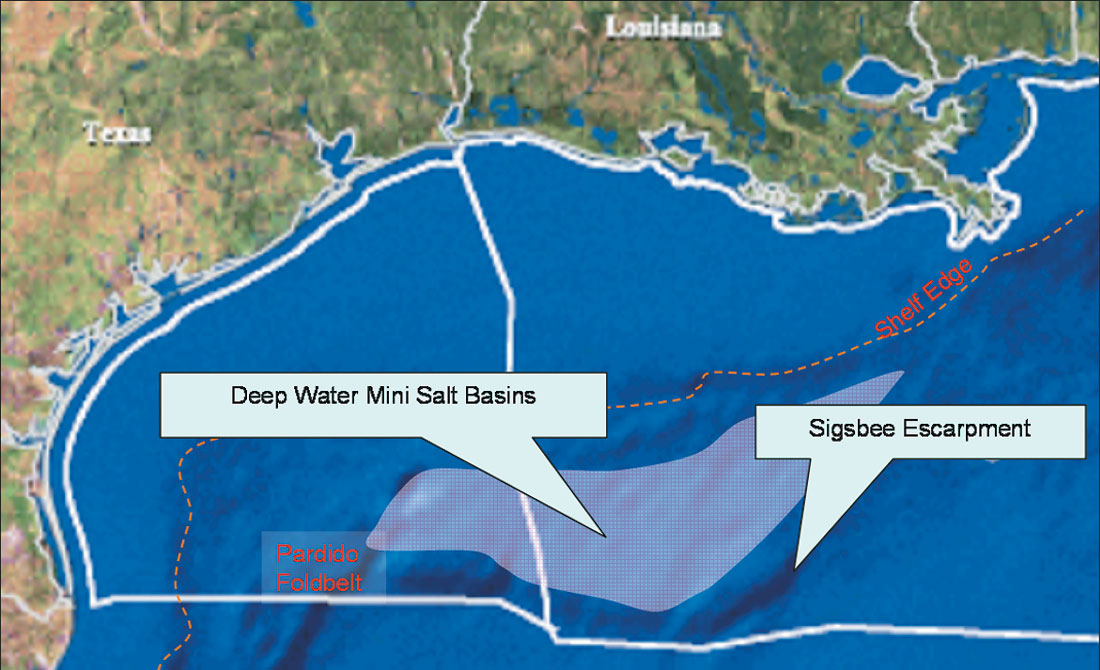
After the discovery of Mahogany, fifteen years ago, special attention was directed to the sub-salt plays, and gradually shifted from the shelf to the deep water (Fig.1). Deep water (>1000’water depth) yearly production increased from 21 MMbblo and 33 Bcfg in 1985 to 339 MMbblo and 1.1 Tcfg in 2006 (MMS). Consequently, the cost of acquiring and testing the prospects has dramatically increased due to their location in the deep water salt-mini basins. This is a result of the presence of intricate geopressure compartmentalization in a salt environment, deep mud line, deep target depth, and shallow sediment hazards.
In the GoM Tertiary-Quaternary, geopressured sediments are caused mainly by compaction disequilibrium phenomenon. Lithology and maximum principal stress essentially control this process. The unique salt petrophysical properties contribute to substantial changes in the pore pressure gradients in the host sediments above and below the salt layer. Salt’s low density is responsible for retarding the overburden gradient below the salt, and reversibly enhances it above the salt. The negligible permeability of salt creates a perfect seal. Moreover, salt’s ductile nature generates a variety of structural styles that impact the stress orientation and magnitude. Subsurface geopressure dictates sealing and retention capacities and consequently impacts the capability to trap oil and gas in a specific structural closure.
While a great deal is known about salt body delineation from geological and geophysical data, this article addresses salt related risk assessment from a geopressure standpoint.
Concepts and definitions
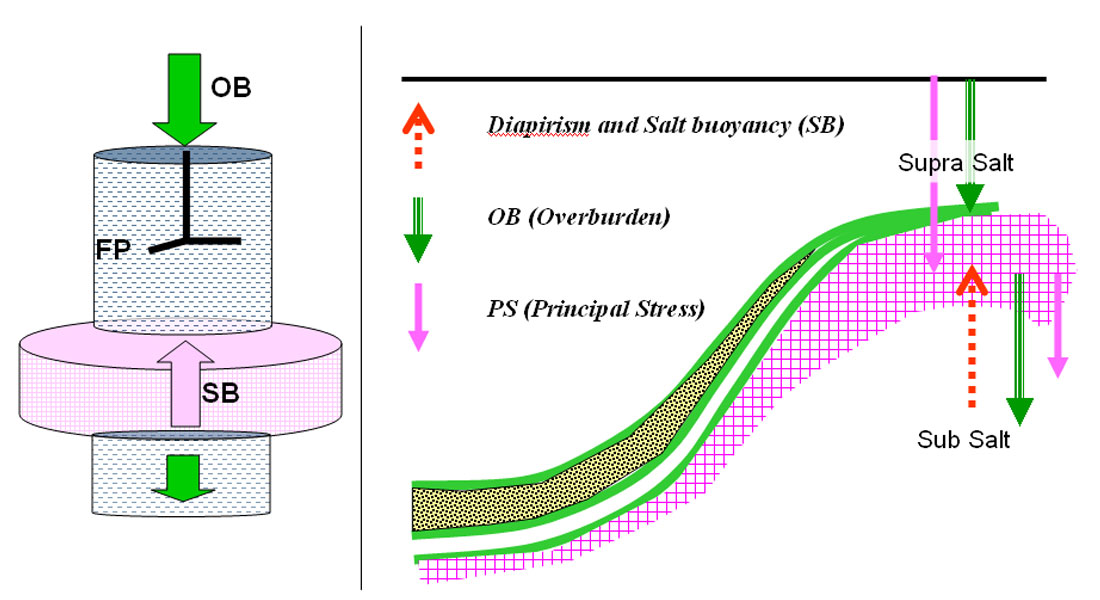
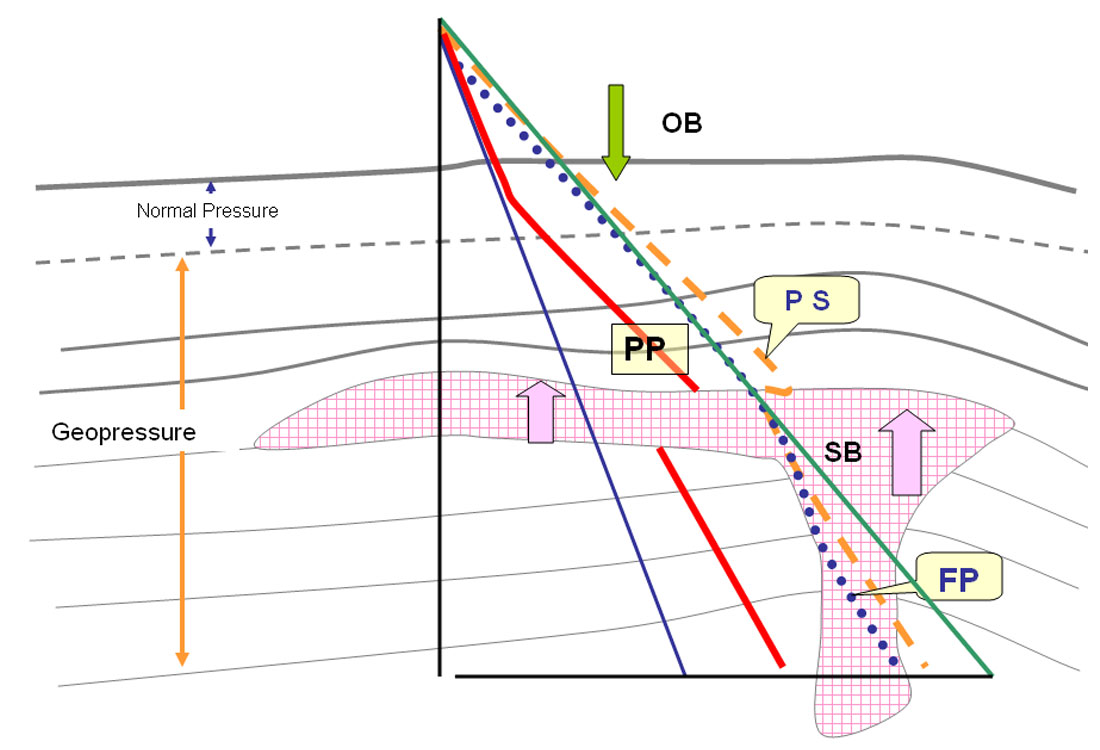
In extensional salt basins, the magnitude and direction of the principal stresses are controlled by sediment load, salt thickness, and salt emplacement-displacement history. Therefore, the maximum principal stress (PS) is not necessarily represented by the vertical weight of the overburden (OB). Salt buoyancy (SB) usually acts upward and has the tendency to accelerate and decelerate the PS above and below the salt respectively (Fig.2).
In several sub-salt wells drilled in the mini-basins (Fig.1) of the Mississippi and Green Canyons and Garden Banks areas (MC 211, 292, 619, 627, 674, 714, GC 153, 699 and GB 217), a distinctive shift of the pore pressure envelopes and normal compaction trends takes place across the salt body. A lower pore pressure gradient has been observed below the salt and a higher gradient above the salt barrier. On a salt-rooted mini-basin scale, a higher gradient was also observed in areas where the salt was emplaced and a lower gradient where the salt withdrew (Shaker and Smith 200
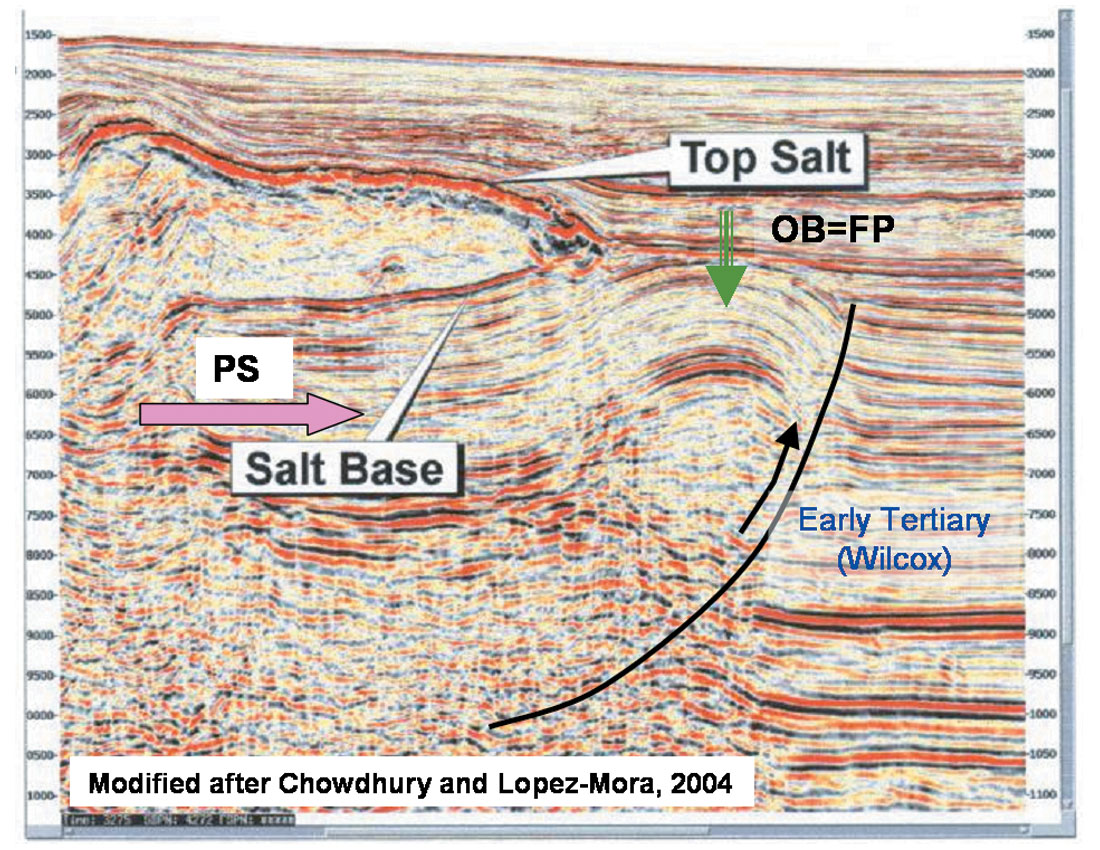
On the other hand, in a compressional system, the lateral stress generated by the salt movement (Fig.3) acts as the maximum principal stress (PS), whereas the load of sediment (OB) represents the minimum stress (FP).
At the Sigsbee Escarpment (Fig.1), where the salt mass (toe) is creeping down-dip near the mud line, creating thrust folds/faults out of the older underlying sediments, a promising potential new deep water frontier has emerged. Several Wilcox equivalent (lower Tertiary) discoveries have been announced recently in the Perdido Foldbelt and Walker Ridge (A. Berman and J. Rosenfeld, 2007). Chevron’s large discovery in Block 758 WR is located along this trend. The discovery well (Jack #2) cost Chevron about $100 million and took three months to drill (press release).
Stress fields, in particular the maximum (PS) and minimum (FP) principal stresses, determine the pressure envelopes in the subsurface sedimentary column. Principal stress dictates the progress (transgression and regression) of the pore pressure (PP), and fracture pressure (FP) represents the breaching limit (Fig.4).
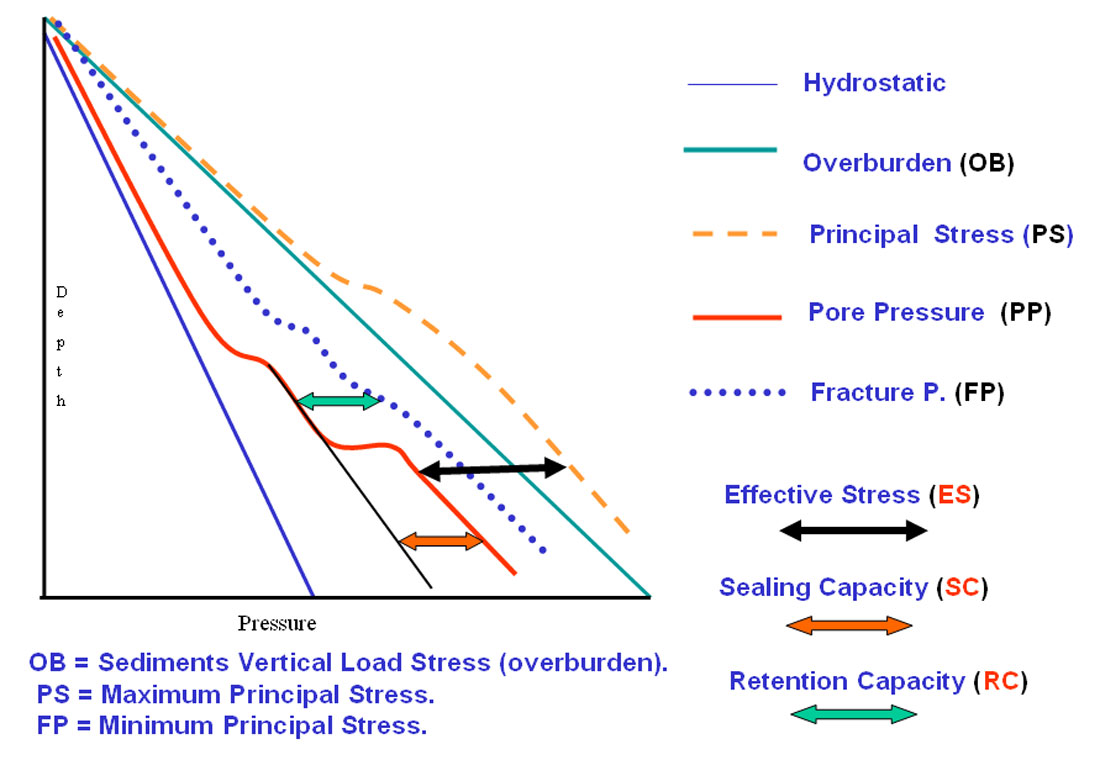
Terzaghi (1943) established the relationship between the PS and PP as:
PP=PS-ES or PP=PS-(PS-PP) (Fig.4)
Therefore, the principal stress is the driving mechanism of pore pressure build up. Sealing capacity (SC) is expressed by the transgression of the excess pressure in a specific compartment, whereas Retention capacity (RC) re p resents the maximum capability of trapping specific hydrocarbon column in a structural closure (Shaker 2001). The difference between the fracture and pore pressure play an essential role in dictating the retention capacity (Fig.4)
Models and Case history
A brief discussion associated with different geopressure models and case history examples follows:
Salt overhangs, Sheets and Canopies
The dynamic and emplacement history of these allochthonous salt bodies is a complex issue to evaluate in this short article. Therefore, density difference between the salt and host sediments will be considered the main driving mechanism for PP development. The sediment above is subjected to a principal stress greater than the overburden stress as a result of the salt buoyancy (SB) and consequently has a higher pore pressure gradient. This leads to a large reduction of the drilling tolerance window (fracture pressure – pore pressure). These conditions require higher mud weight and multiple casing points to drill this upper section.
On the other hand, the principal stress on the rock column below the salt is reduced due to salt buoyancy effect. This leads to a higher retention capacity and the possibility of a thicker hydrocarbon section being trapped below salt. This also might reduce the sealing capacity (weaker seals) below the salt. The conceptual model in figure 5 exhibits this relationship. Moreover, it clearly shows the substantial drop of the PP and FP below the salt due to the reduction of the principal stress. This leads to wide-spread, known drilling problems at the salt-sediment interface in several sub-salt prospects.
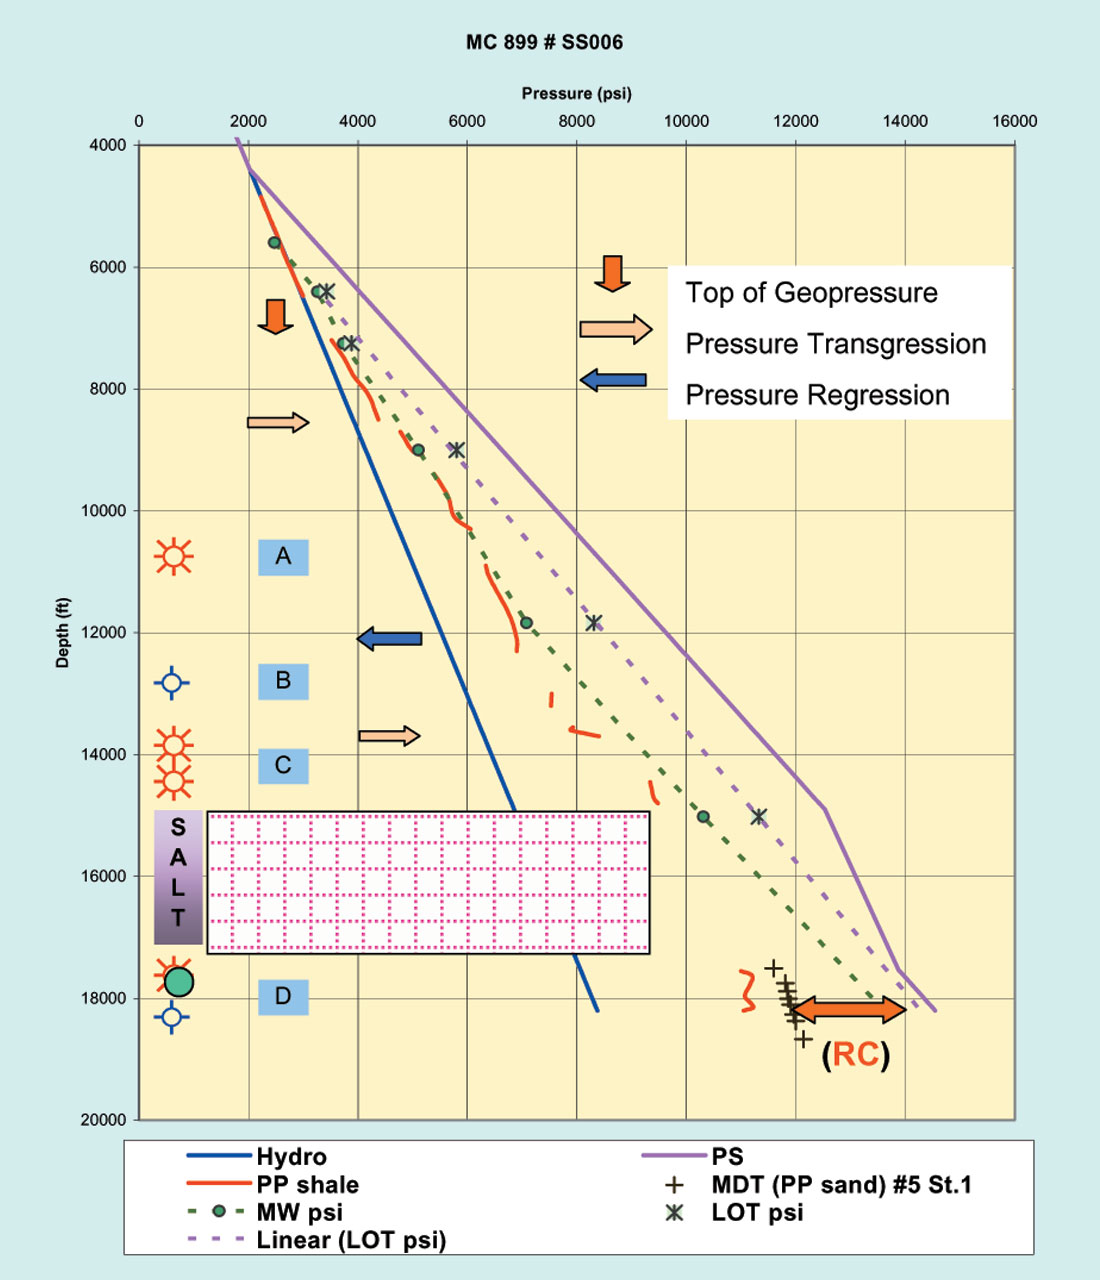
Cosby Field is an exploration success and currently produces from the sub-salt trap. The field covers four blocks (Mississippi Canyon Block 898, 899, 941 and 942). Block MC 899 production peaked at 14.4 MMbblo and 19.1 Bcfg in 2002. In this field, Mississippi Canyon 899 - Well #6 (Fig.6) represents a key example of the presence of multiple pay zones below and above the salt. A thick gross oil and gas pay zone was trapped due to the large RC as a result of the sub-salt PP regression. The measured PP (MDT) at +/-18,000’ pay zone was +/- 12000 psi (PG of 0.66 psi/ft). The lower pressure gradient (PG) may be responsible for the relatively rapid production decline if this block. The reported production in 2006 was 2.18 MMbblo and 3.16 Bcfg.
Note that the high principal stress / pressure gradient in the supra salt resulted in several kicks and water flow incidents and, therefore, seven casing points were needed to drill above the salt. Conversely, in the sub-salt section, two casing strings from the base of the salt to TD (18,250’ tvd) were set. Several sidetracks were performed to reach the lower objectives below the salt due to several losses of circulation (low PS / PG). Eventually, production will resume from the supra-salt pay zones.
Mackerel Prospect’s wildcat well #1 in Mississippi Canyon 619 was a disappointing sub-salt exploration endeavor. The relationship between principal stress, overburden, pore pressure and fracture pressure in the geopressure model in Fig. 5 applies.
The pressure plot in pound per gallon (ppg) vs. depth of MC 619#1 (Fig. 7) shows a steep increase of mud weight (MW) to drill the section above the salt which led to setting 5 casing strings. Moreover, the extrapolated fracture pressure trend from the Leak off Tests (LOT) and Formation Integrity Tests (FIT) exceeded the calculated overburden. This confirms the assumption that PS is higher than the OB in the supra salt section.
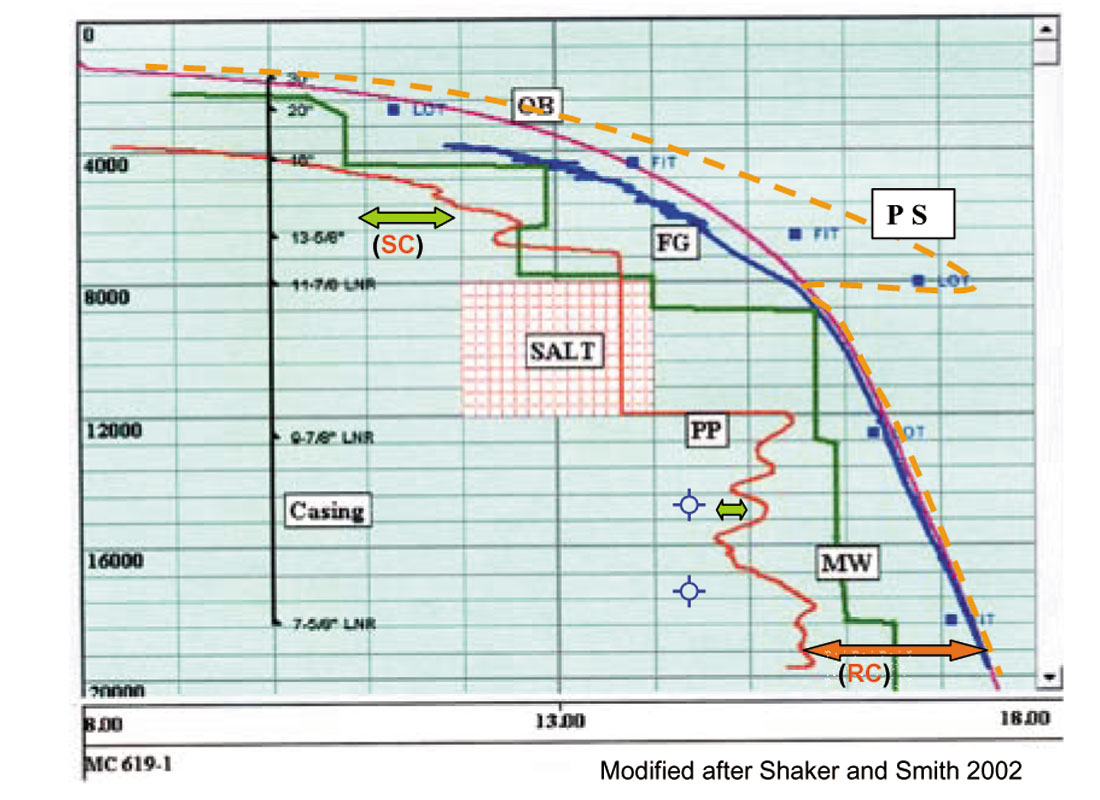
Below the salt principal stress and fracture pressure retreat and, therefore, the MW shows a minor increase of 1/2 ppg from the base of salt (12000’) to the well’s TD (21000’). This indicates a weak transgressive pressure envelope and, consequently, failed seal compartments, i.e. absence of SC.
Therefore, the targeted sub-salt reservoirs are deemed water wet. Moreover, the timing of the salt emplacement in relation to the hydrocarbon migration to the prospect might explain the failure of finding hydrocarbon in this well (Shaker 2004). In spite of high sealing capacity in the thin sediments (6000’) above the salt, the prospective section is not economically feasible to pursue.
Salt Toes and Fold Belts
The new deeper exploration fairway is associated with the creeping salt toe at the Segsbee Escarpment (Fig.1 and 3). As a result, the lateral stress has generated compressional fold/fault structural plays in the Wilcox equivalent sediment below the salt. The fault plane in this structural setting usually yields high sealing capacity. Perdido, Walker Ridge and the Mississippi fold belts are the new exciting and promising exploration plays needed to rejuvenate domestic energy needs. Based on the released data from these frontier wells, a geopressure model (Fig. 8) has been proposed and might explain some of the trapping mechanism and drilling challenges facing the industry.
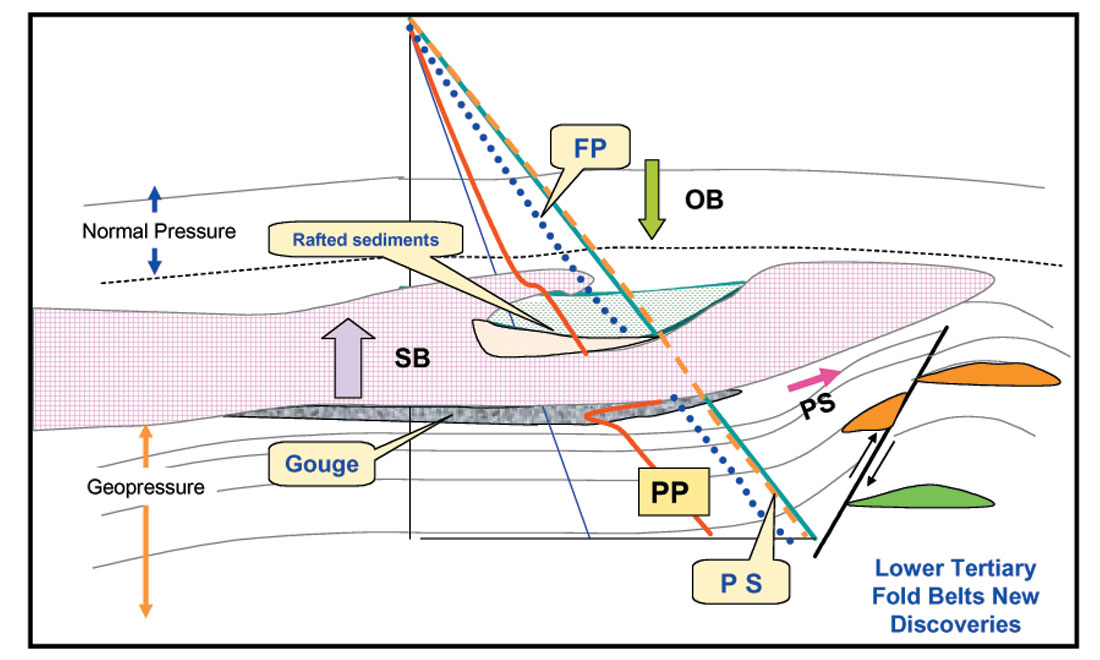
In addition to the salt buoyancy effect, on the sediment below and above the salt, rafted sediment blocks embedded in the salt mass and gouges (furrows filled with transported and crumbled sediments) at the base of the salt impact the subsurface geopressure profile. If these older rafted blocks are cased with impermeable layers, PP will show a high gradient. In the case of plowing the older sediment underneath the salt toe, the shear stress will substantially reduce the PP in this thin rubble layer underneath the moving salt (Fig.8). Sub salt gouges represent a drilling difficulty and hazard in frontier exploration plays. In addition, the salt buoyancy will accelerate and decelerate pore pressure above and below the salt respectively.
Atlantis field represents an exploration success of testing a prospect below the salt toe. This probably will not be the general case in the frontier lower Tertiary fairway where the targeted traps are located down-dip from the tip of the toe (Fig.8).
The geopressure plot of the discovery well #1 ST#2 in Green Canyon Block 699 (Fig.9) exhibits the relationship between the principal stress, overburden and fracture pressure. Note, the fracture pressure is in proximity of the calculated overburden above the salt, whereas principal stress far exceeds the overburden and fracture pressure in the sub-salt. This leads to a wide window of retention capacity and the presence of thick column of oil especially between 17800’ and 18500’.
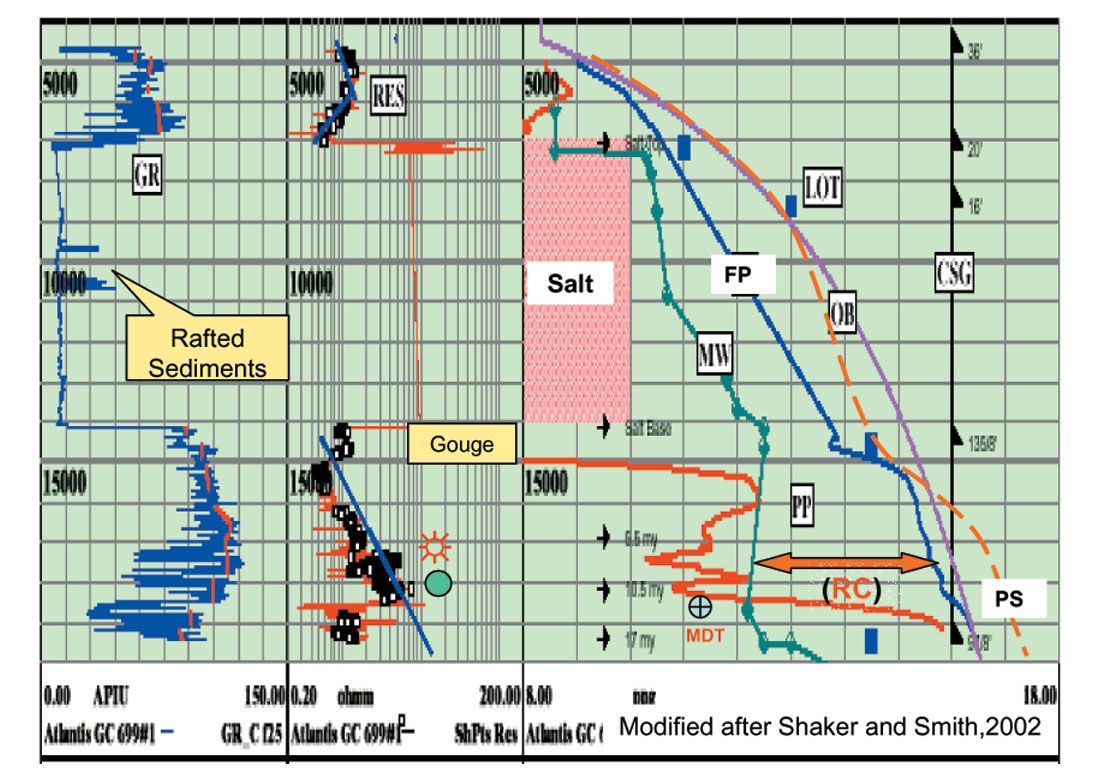
On the other hand, the reduction of PS in the sub-salt section led to a moderate PG of +/- 0.61 psi/ft at depth +/- 18400’ (MDT measurements). This can be attributed to the thick salt layer above (+/- 7000’) and the water depth of the mud line (- 4495’). Mud weight was increased to 10.5 ppg and an extra casing point was set in the middle of the salt due to the presence of rafted sediments within the salt body. Moreover, the possible presence of the interface salt-sediment gouge, causing a sharp drop in the PP, was responsible for sidetracking the original hole.
The presence of several wet sandy rich sections below the pay zone, which started at 18500’ to TD (19500’ TVD) and concurred with an increase of MW to 12.4 ppg (overbalanced), led to thick mud cake, stuck pipes, plug back and side track. BP is planning to put Atlantis field on line the next year. The projected daily production is estimated to be 250 Mbblod and 180 MMcfgd.
Conclusion
Exploration in the deep water mini-salt basins and frontier fold belts has yielded and is expected to produce substantial reserves, but is also very challenging.
Rewards:
- Salt enhances the retention capacity in the sub-salt and the sealing capacity in supra-salt.
- Large reserves are trapped by less faulted structural closures as a result of salt swells in the mini-basins area
- High sealing capacity of the thrusted fault system in the fold belt fairways.
- High flow rate due to the high permeability of the younger sediments (Plio-Pleistocene), particularly above the salt.
- Drilling does not require high mud density to reach objective targets.
Challenges:
- Encountering several drilling problem (kicks, SWF) above the salt due the high PS and the pressure gradient. Several casing points needed to drill through this zone.
- Drilling hurdles are common at the salt-sediment interface at the base of the salt especially in the gouge zones.
- The moderate to weak pressure gradient and sealing capacity below the salt can be a substantial cause of seal failure and weak water drive in the production phase.
- Sub-salt seismic imaging quality and accuracy.

Acknowledgements
The author is greatly indebted to Dr. Colin Sayers for his review of this manuscript and valuable technical advice.


Join the Conversation
Interested in starting, or contributing to a conversation about an article or issue of the RECORDER? Join our CSEG LinkedIn Group.
Share This Article