Geoscientists are inclined to use pore pressure (PP) plots expressed in PSI vs. Depth (P-D). This graphic illustration is beneficial for prospect and play-concept compartmentalization and seal integrity appraisals. On the other hand, drillers and engineers prefer to use Mud Weight Equivalents (MWE) in pound per gallon vs. depth (PPG-D) to prepare their well prognosis and carry out their drilling program.
The conversion method of calculating the PPG from the actual measurements in PSI is usually subjected to computation distortion, especially in the geopressured system. While the PP in the permeable beds shows a positive gradient slope on the P-D plot, it tends to demonstrate a negative slope on the PPG-D plot. This observable fact has been attributed incorrectly to several geopressure phenomena, such as regression, centroid etc.
A new Geological Based Geopressure Conversion Modeling (GMC) compensates for the erroneous values derived from using a universal (0.052) Standard Conversion Factor (SCF). Moreover, this model simulates realistic geopressure compartmentalization and seal effectiveness in concordance with the actual measured values on the P-D plots and the drilling records.
Introduction
The SCF is derived as follows:
From lb/gal to psi/ft
12in3/231 in3=0.052
and vice versa from psi/ft to lb/gal
1/0.052=19.2
This mathematically-driven conversion is typically embedded in most of the pore pressure prediction soft wares. It is used to perform the conversion from PSI/FT to PPG MWE in all calculation without the benefit of integrating lithology, compartmentalization, pressure differential between seals and reservoirs, structural setting, and hydrocarbon presence.
The GMC has been developed and applied successfully in several wells on the shelf and deep water. The new conversion results are a comprehensive representation of the equivalent mud weight (EMW) needed to exert pore pressure in wet and pay sands. Moreover, it emphasizes the status of the subsurface compartmentalization as it would be concluded from the P-D plot and the drilling program.
Case Histories
Two cases were chosen to clarify the new model representation in dry (wet sand) and producing (pay sand) wells follows:
Wet Sands
The deep well #1 (TD 21,550 feet) in Keathley Canyon, offshore Louisiana, drilled by BP in Block 255 was used in this paper to show the difference between the SCF and the GMC conversion methods in wet reservoir sands. This well was selected due to the frequent Repeated Formation Tester (RFTs) measurements which were taken in most of the permeable beds and the fact that compartmentalization is clearly identifiable. Resistivity was used for pore pressure prediction in the shale beds (Eaton, 1975)
In this case the top of the geopressured zone is identified at 11,600 feet (Fig. 1). The PP profile is represented by cascade fashion pore pressure envelopes (PP RFT). Pressure transgression and regression are impacted by the sealing capacity of the shale caps and/or structural failure (Shaker, 2002). Slopes on the formation RFT’s and Mud Weights (MW’s measured at surface RKB and RFT tool) values show a positive slope (increasing with depth).
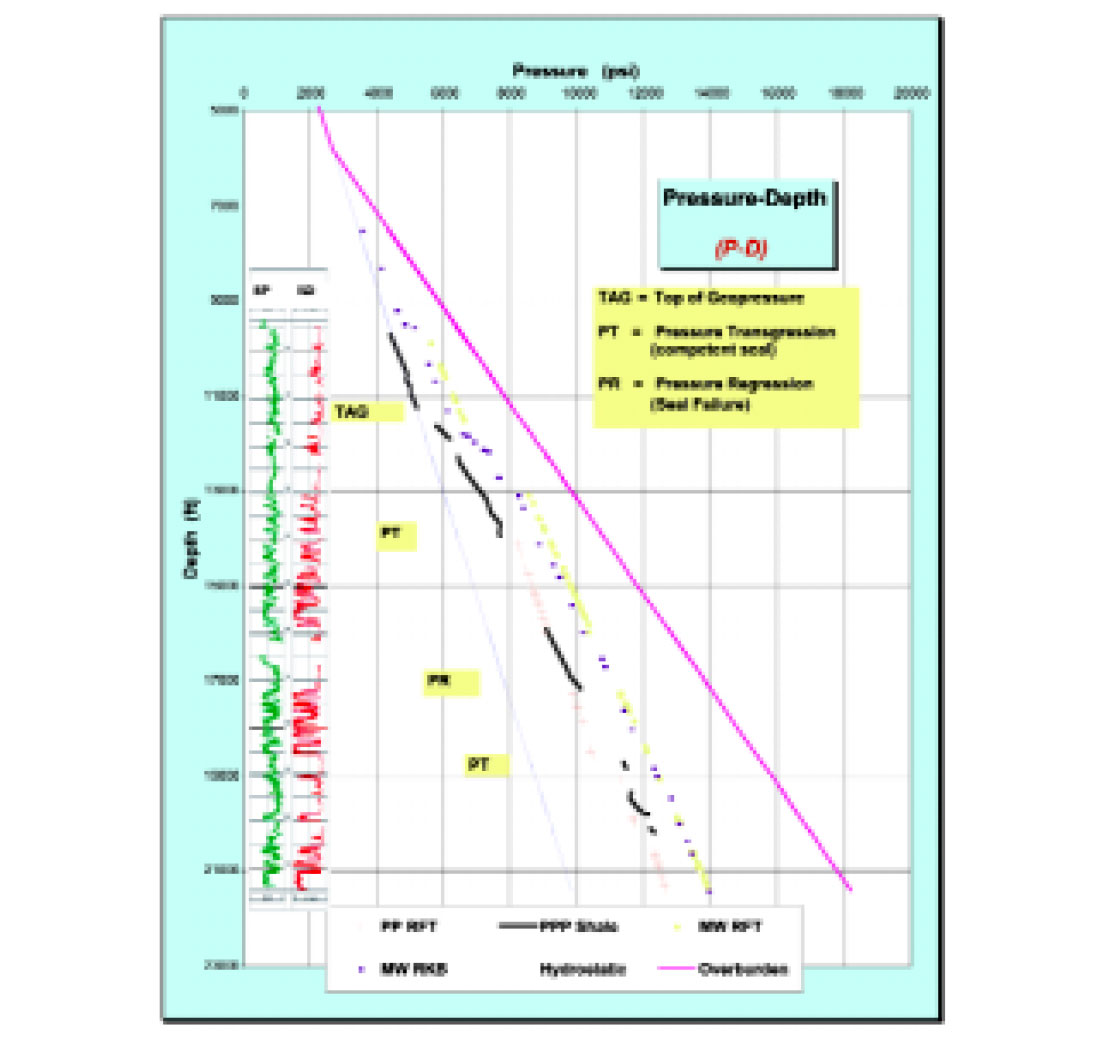
The plot shows three distinctive compartments which are, respectively, between 14000 to 16000 feet (upper), between 17000 to 18500 feet (middle) and below 20000 feet (lower). The upper and the middle compartments are in communication. A pressure transgression takes place between the middle and the lower ones, where a competent seal caps the compartment below. All the pressure gradients in the wet sand packages show positive slopes of 0.46 psi/ft (Gulf of Mexico regional hydrostatic gradient).
PPG MWE - D using the SCF
Using the conventional 0.052 conversion factor has substantially altered the pore pressure profile (Fig. 2). The pressure expressed in mud weight equivalent (SCF sand), in the permeable zones, shows a negative slope. This gives a false indication that the mud weight needed to exert the formation pressure decreases with depth.
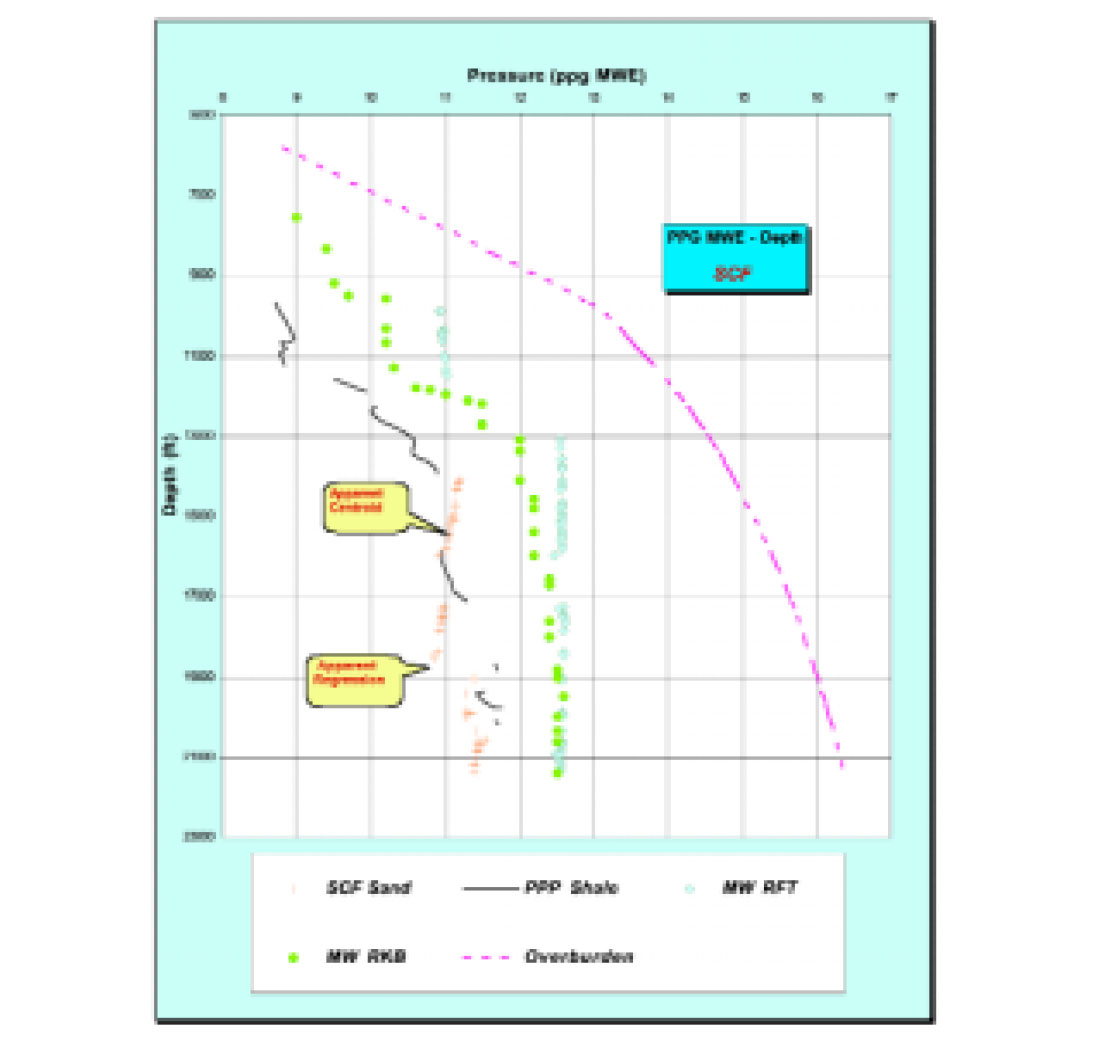
Using this plot gives the artificial impression of the presence of centroid effect. Noteworthy, the centroid phenomenon cannot be recognized in a single well-bore, but can be observed only by correlating multiple wells on a basin scale. Moreover, this plot shows a non-existing pressure regression in each reservoir type sands in the geopressured system.
PPG MWE - D using the GMC:
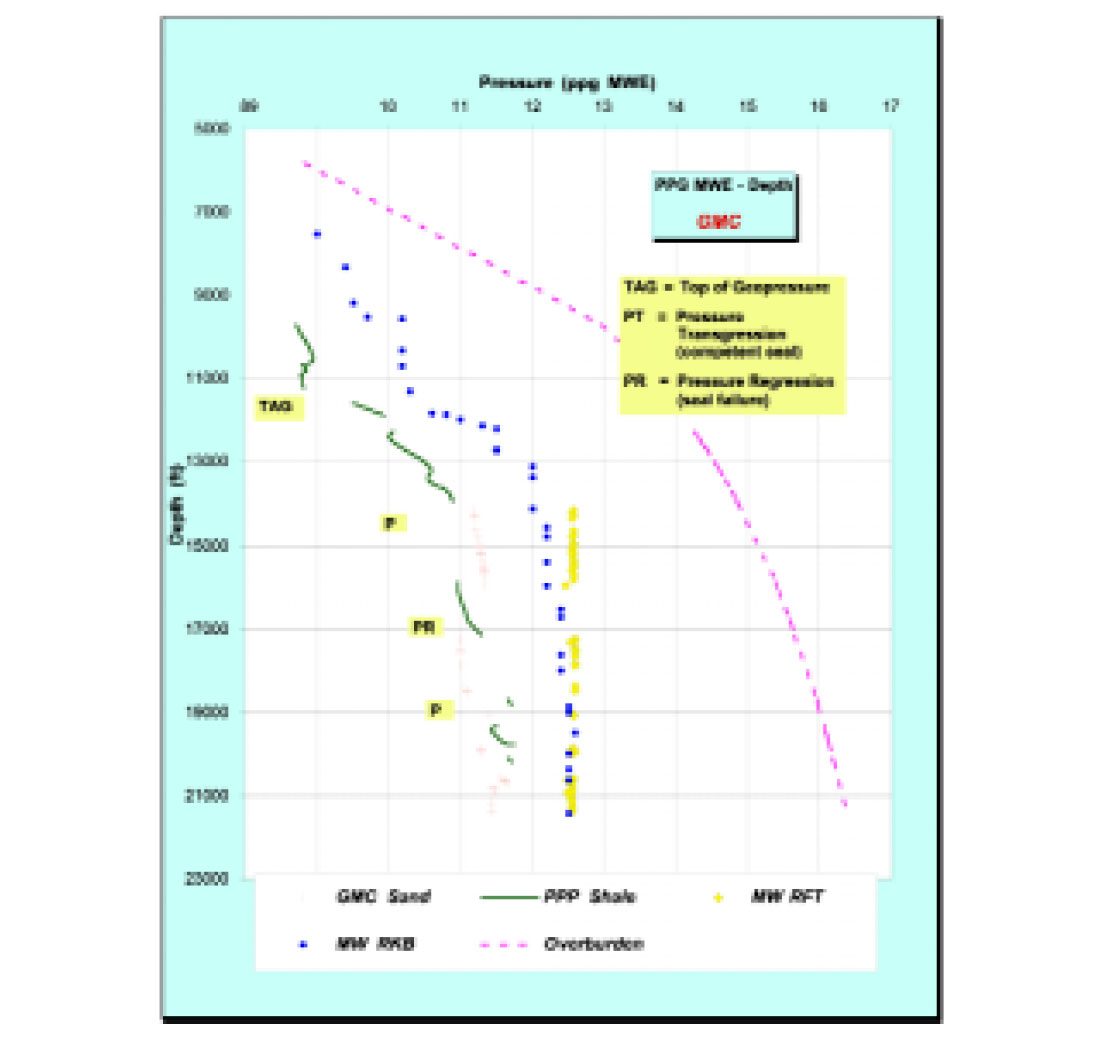
Using the geological based modeling (Fig. 3) successfully simulates the actual measurement in MWE and rectifies the pore pressure and sealing capacities profiles. The results concluded from this method concur with the P-D plot interpretations and the mud log observations. Noticeably, the well was drilled with overbalanced mud (± 1 ppg). An increase in the background gas (show #5) was noticed at the sand (13940 - 13970 feet) where pressure transgression took place between the seal and the upper compartment. Moreover, nutplug sweep was frequently used to control mud loss below depth 17000 feet where pore pressure shows a regression envelope.
Pay Sands
Well No.1 in East Breaks (offshore Louisiana) Block 602 (Nansen Field) was drilled by Kerr McGee to TD 11990 feet. Several RFT’s were taken in the pay and wet zones. This well exhibits the benefits of using GMC in pay zones.
Pressure-Depth Plot (expressed in PSI v. Depth)
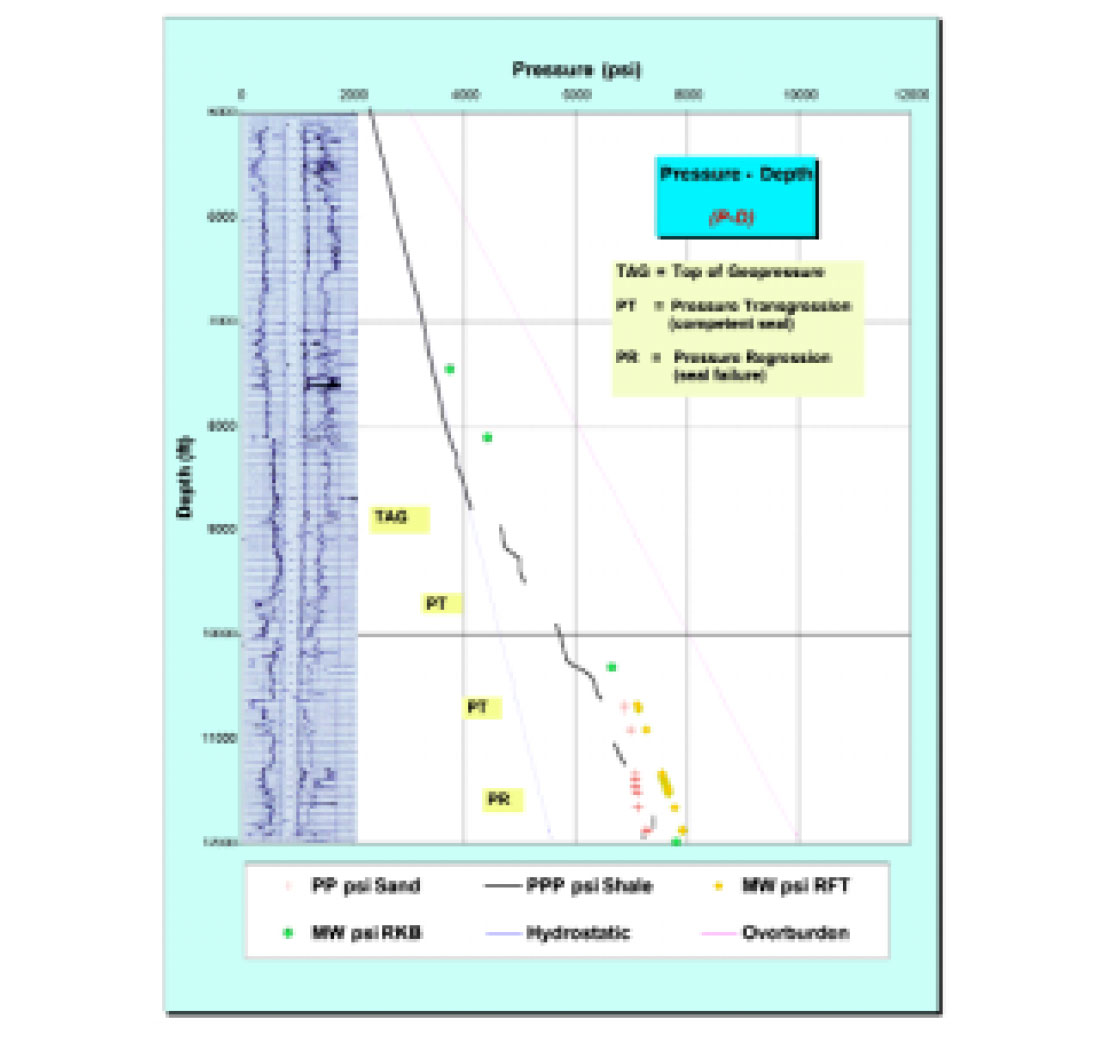
The plot shows three distinct compartments (Fig 4). The upper wet one (10,670 - 10,910 feet) shows a higher value (PP psi Sand) than the predicted pore pressure (PPP psi Shale) in the top seal (pressure transgression). The middle pay zone from (11,322 - 11,516 feet) is in communication with the pay zone at 11,650 - 11,660 feet. The lower wet zone at 11,850 - 11,900 feet shows a weak pressure regression on both the measured and the predicted pore pressure profiles. The proximity of the PP differential in the shale and sand beds to the mud weight pressure resulted in a stable bore hole during drilling. Caliper shows that bore hole was in relatively good shape. Furthermore, the slope on the pay zone RFT’s shows a positive trend of light crude of specific gravity of 0.85 g/cc (API 28º - 30º).
PPG MWE - Depth using SCF
The RFT’s in the oil bearing reservoir (SCF Sand) shows a negative slope (Fig. 5) in spite of the constant value of the mud weight from the RFT’s tool and MW at the Kelly bushing (MW RKB). This enlarged graphic plot, which covers the lower section of the well between 10000 and 12000, shows negative gradient. This does not agree with the natural laws, which simply states that PP in a single reservoir increases with depth. Additionally, apparent centroid and regression take place between the measured PP and predicted PP.
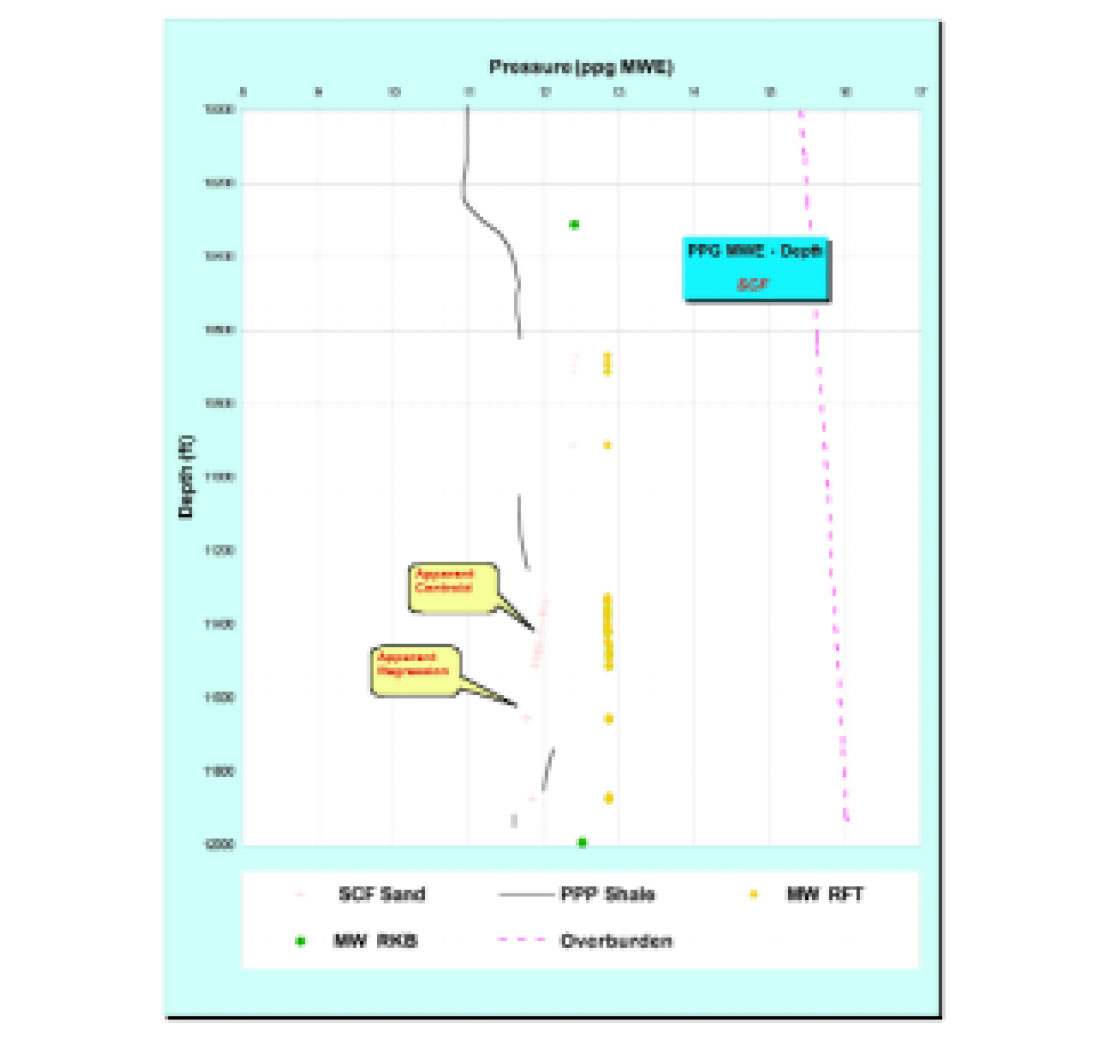
Furthermore, the plot shows the same PPG MWE values at the base of the pay zone and the lower wet zone. On the contrary the P-D shows a weak regression between the middle and lower compartments, either due to the presence of the water leg or seal failure.
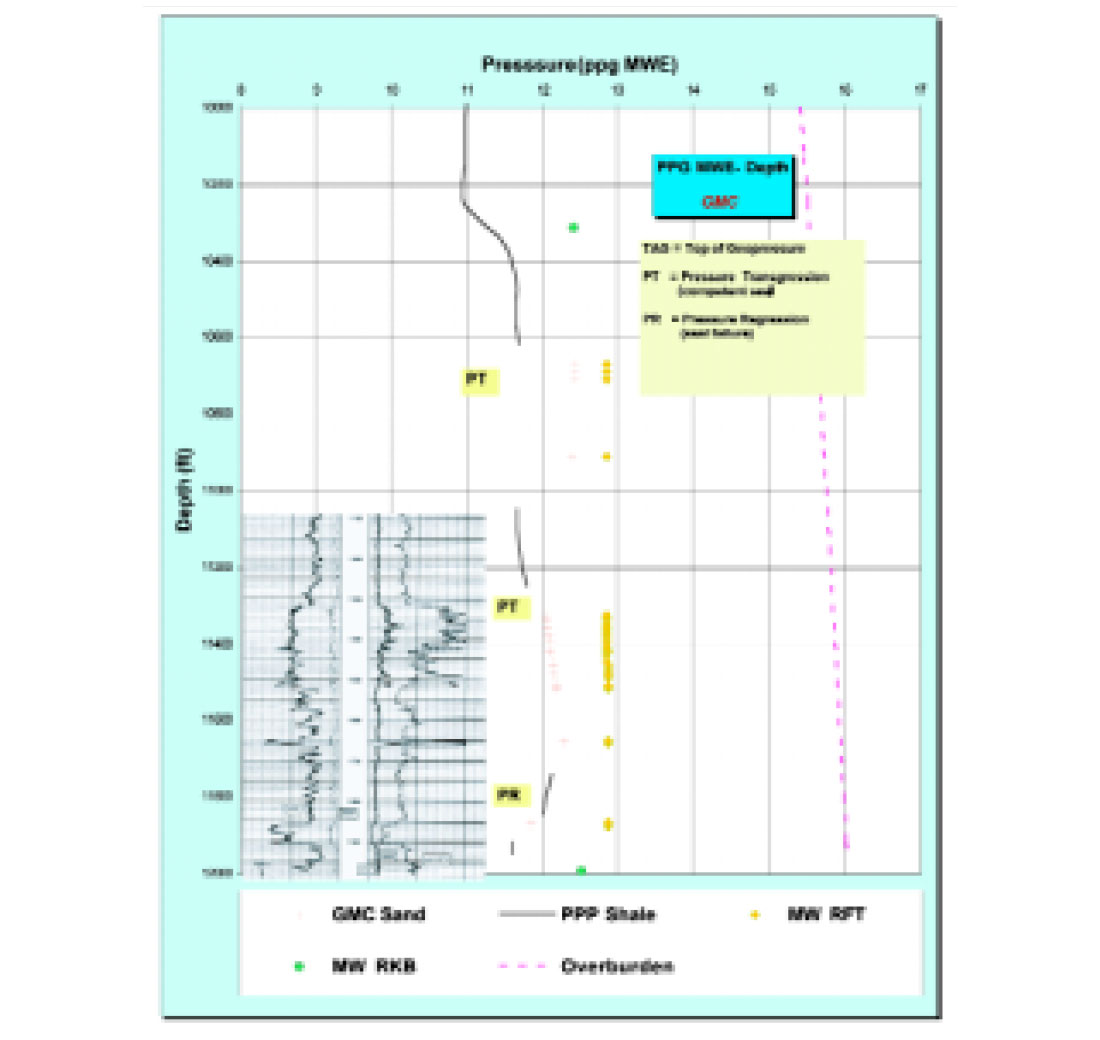
PPG MWE - Depth using GMC
The plot (Fig. 6) exhibits a similar result as the P-D plot. Three compartments are clearly shown with the positive gradient slope in the main reservoir compartment. A clear communication is taking place within the sand section between 11322 and 11660 foot. Moreover, the GMC results show the regression envelope, on both the measured and predicted pressure, at the lower wet sand.
Benefits of using GMC:
Several advantages and benefits can be achieved by using the GMC technique instead of the conventional SCF:
- Eliminate the negative slopes on the measured pore pressure, although the actual RFT’s shows PP increase with depth.
- Calculate a MWE that simulates the actual data.
- Help in establishing the right calibration for pore pressure prediction using petrophysical properties (velocity, resistivity, porosity, density etc).
- Avoid the incorrect assumption of some geopressure phenomenon such as centroid and regression
- Give a closer and accurate estimate difference between the drilling mud weight on the rig floor / ECD (equivalent circulating density) and the formation calculated MWE from RFT’s.
- Foresee the risk of drilling surprises such as hard kicks, blow out, and loss of circulations.
Conclusion
Most of the pore pressure related drilling problems occur at the seal/reservoir interface zones. Therefore, the misrepresentation of the PP profile in the permeable beds using the SCF can results in drilling surprises and unexpected high cost losses to reach the exploratory target. Furthermore, using PPG derived from SCF as a calibration tool for pore pressure prediction can lead to unrealistic pore pressure predictions in the shale (seals). Several apparent geopressure behaviors can be seen on the PPG-D plot as result of using the SCF.
Conversely, the GMC expresses the PPG MWE in sensible values that emulate the P - D plot. This new geological based modeling converts the measured subsurface geopressured profile to comprehensive values that matches the actual geopressure compartmentalization and seal effectiveness. Additionally, pore pressure prediction calibration in the shale can be more accurate by utilizing this modeling technique.


Join the Conversation
Interested in starting, or contributing to a conversation about an article or issue of the RECORDER? Join our CSEG LinkedIn Group.
Share This Article