Introduction
Reservoir optimization has been identified by many as the last frontier of the oil and gas industry. As fewer giant fields are discovered, improving the low recoverability from existing oil and gas reservoirs will be the focus of increasing capital spending within the industry.
3-D surface seismic information has been effective in identifying bypassed production in many existing fields. 4-D or time lapse surface seismic monitoring has yielded some early positive results in identifying bypassed reserves, especially in North Sea fields. However, much of the remaining untapped reserves are hidden by sub-seismic scale heterogeneities not imageable with surface seismic data. The economic opportunity is often in fields with highly variable production rates that are not explained in the 3-D surface seismic data volume.
Development strategies in such existing reservoirs include:
- Do nothing
- Use well control: logs, production data and geologic inference to determine new infill locations
- Drill a patterned infill
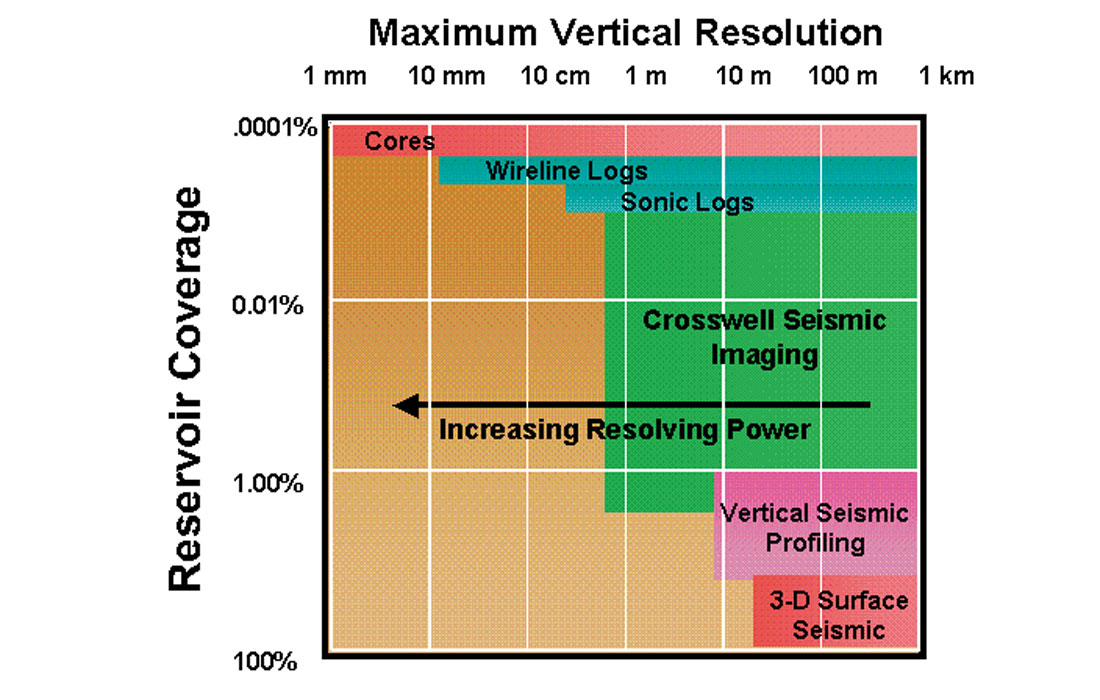
Ideally the strategy would include strategic or targeted infill wells. The limitation is information between existing wells at the scale of heterogeneities that control flow in the reservoir. The gap in reservoir information can be graphically expressed as in Figure 1.
This paper describes applications of information at an unprecedented resolution from crosswell seismic as a critical driver in targeting strategic infill wells. Specifically, in the two reservoirs described, the optimal infill strategy is to use horizontal wells targeted using the interpreted crosswell seismic information. Two sidebars provide more information on the crosswell seismic method and other applications of crosswell seismic information.
The first application described below is in targeting infill wells to penetrate a high porosity, highly productive sand within the Viking formation in Western Canada. The 3 to 10 meter (10 to 30 ft) thick sand channel is not seen in available surface seismic data over the field. The result is a productive horizontal well targeted in the high porosity channel confirming the crosswell seismic interpretation.
The second case history involved carbonate reefs in a West Texas field where production is highly variable. Bypassed reserves were the objective of a planned horizontal well drilling campaign. Crosswell seismic provided the detailed reservoir characterization in a pilot area to qualify horizontal well infill locations and trajectories and to consider improved water injection strategies.
These cases demonstrate the economic benefit in applying crosswell seismic to reservoir optimization. Crosswell seismic fills the information gap between 3-D surface seismic and VSP and well control including well logs and production history. Crosswell can be an integral element of a strategic infill drilling campaign.
Case 1: Channel Sand, Crystal Viking Pool, Canada (Borsato, et al, 2001)
The operator had encountered variable success in targeting a high producing sand within the Crystal Viking Pool. The objective was to increase production in the Crystal Viking Oil Pool by targeting a horizontal well in a high porosity, high producing sand (F1 Sand). The channel sand, 3 to 10 meters (10 to 30 ft ) thick, was below the resolution of the existing surface seismic surveys. As a result, all prior well locations were selected based on well log data, production data, geologic models, and inference. Due to the complex depositional environment, the seemingly discontinuous channel sand was difficult to map with well log data and a geologic model alone, and several wells had missed the F1 Sand in the area.
The operator selected crosswell seismic to deliver vertical resolution of 2 to 3 meters (6-10 ft) between existing wells. The ability to resolve the F1 sand between existing wells was key in designing the trajectory of the horizontal well to intersect the elusive F1 Sand.
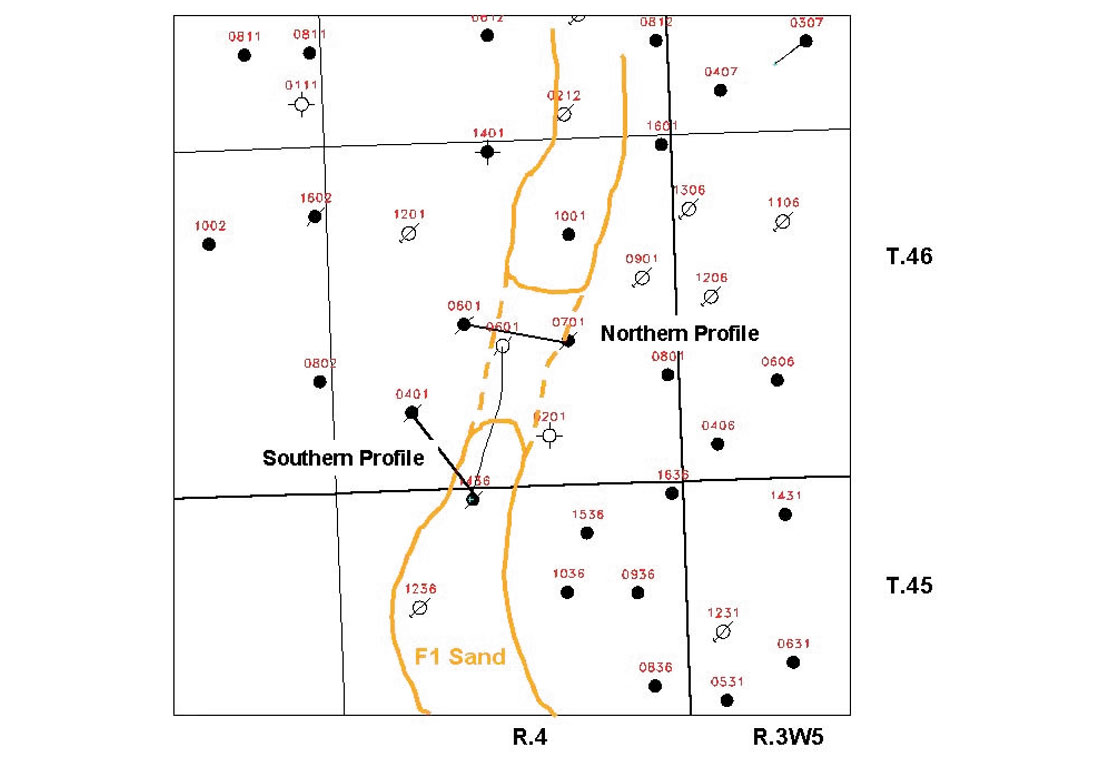
Figure 2 shows the presumed extent, based on well log data, of the high porosity F1 Sand and the wells involved in the survey. Well log data indicate that the F1 Sand was encountered in one of the wells (14-36 in Figure 2) and based on geologic models could be present between two of the others (6-1 and 7-1). The planned horizontal well was to originate at well 14-36 and end somewhere between wells 6-1 and 7-1. The location of the F1 Sand between wells 6-1 and 7-1 would need to be precisely established in order to design the appropriate horizontal well track. If the F1 Sand was not present between the two wells, then the horizontal well was not likely to be economically viable.
The geology of the Crystal Viking Oil Pool located in Alberta, Canada, about 300 km (185 miles) northwest of Calgary has been thoroughly studied. The facies within the Viking Formation are reasonably complex, ranging from tight sands and shales to porous sands and conglomerates of varying quality. The goal of the crosswell seismic survey was to delineate the high-porosity (F1) channel sand (as described in Reinson et al 1988, fine to medium grained sandstone), within the incised valley system of the Viking Formation. Thickness varies from 3-10 meters (10-30 ft).
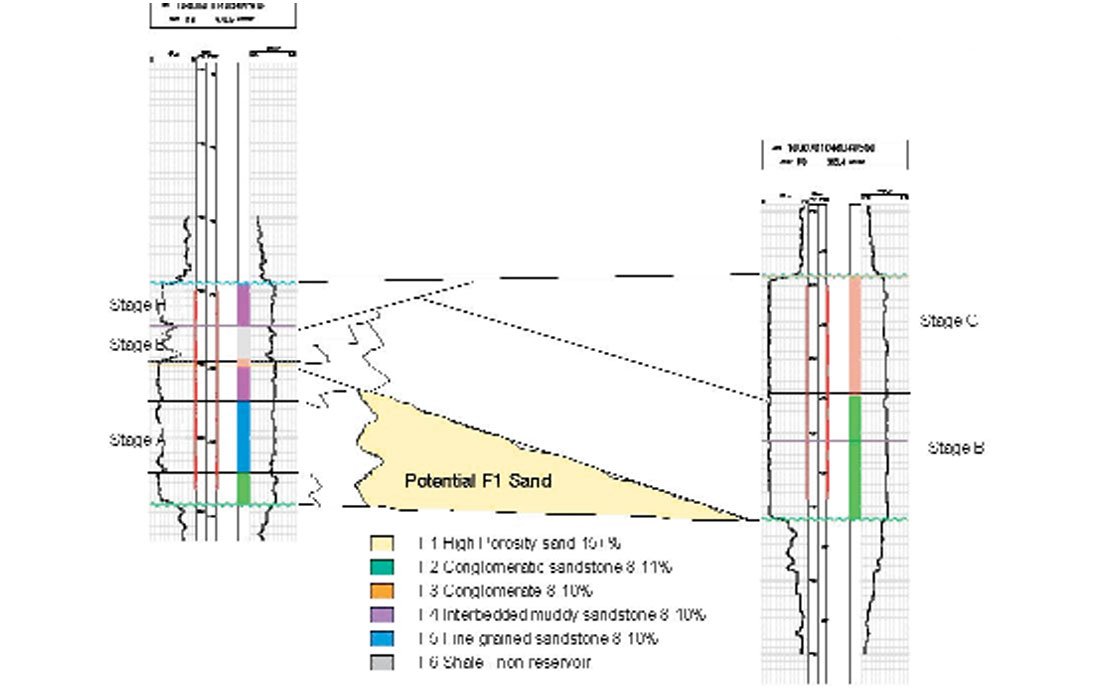
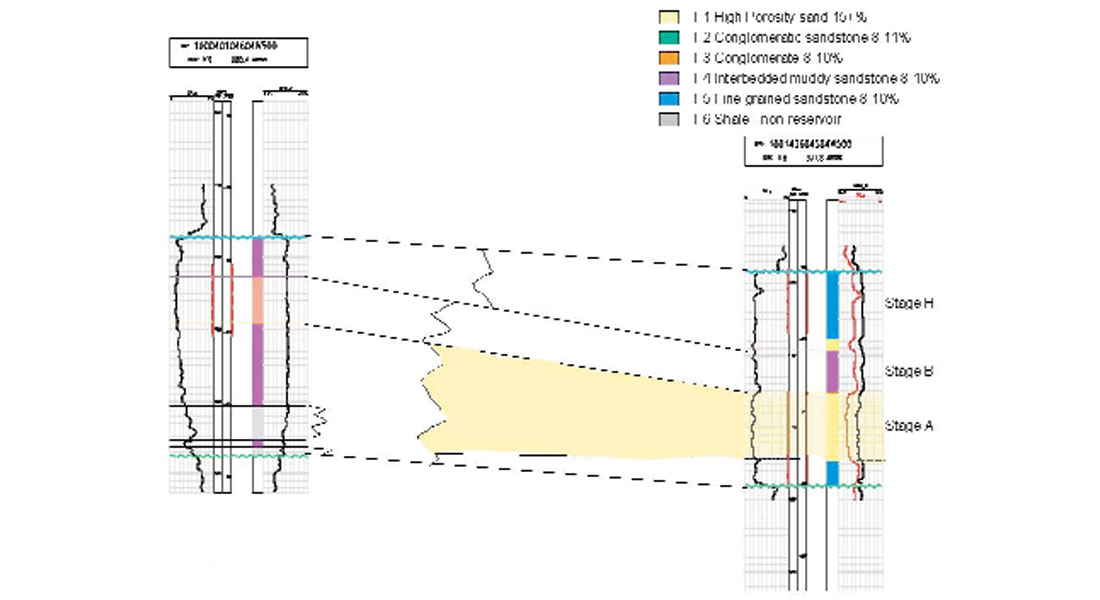
For the crosswell survey two pairs of existing vertical wells were chosen based on their locations, where information was critically needed for optimal placement of the horizontal well. The facies distribution (based on well log data) within the Viking Formation between two northern wells is shown in Figure 3, and the facies distribution between two southern wells is shown in Figure 4. This information was used to design the layout of the crosswell seismic profiles. The crosswell profiles will provide two high-resolution images across a vertical plane defined by each of the well pairs. The crosswell information will closely constrain the trajectory along the two planes, but is not fully three-dimensional due to the inherent coverage limitations of the crosswell geometry.
Two crosswell seismic profiles were acquired in the Crystal Viking Oil Pool in August 2000, each spanning about 500 meters (1650 feet) between wells: a northern profile between wells 6-1 and 7-1 and a southern profile between wells 4-1 and 14-36. The southern profile was shot to locate the western boundary of the F1 sand as well as to establish a baseline seismic signature for the F1 sand at the 14-36 control point. The northern crosswell seismic profile was shot to confirm or deny the existence of the F1 Sand between these two wells. With this information the start and end of the horizontal well could be optimally placed. In parameter testing, the Viking and surrounding formations were found to support propagation of compressional wave energy at frequencies up to 1200 Hz, providing excellent vertical resolution for crosswell seismic imaging. The data of each profile was collected using frequencies between 200 and 1200 Hz, a sample period of 250 microseconds, and 8 sweeps per shot. The receiver tool was placed in the 4-1 and the 6-1 well bores, and the source tool was placed in the 14-36 and the 7-1 well bores.
Existing surface seismic surveys were not able to distinguish between the intra-valley deposits (containing the F1 Sand) and regional Viking due to small acoustic differences and maximum frequencies of 80-100 Hz. Thus, the surface seismic could not be used to interpret the various facies within the incised valley complex. The crosswell seismic survey provided the high frequency data, which enabled facies interpretation and delineation of the F1 Sand. The entire Viking complex can be mapped in the surface seismic data, whereas the individual facies can be interpreted in the crosswell seismic information.
Careful interpretation of the crosswell data was necessary to correctly identify the F1 sand. Synthetic seismograms from the sonic logs in well 14-36, where the sand is present and well 6-1, where the sand is missing, were used as diagnostic tools. Then, the crosswell seismic reflectivity data of the southern profile, where the F1 Sand exists at well 14-36, was interpreted with the assistance of geologic knowledge of the region. The ability to identify and map individual facies added confidence to the F1 interpretation. From these data the F1 Sand was found to have a signature peak and trough of relatively large amplitude. The northern profile was then interpreted using this information along with well log data and knowledge of the geology in the field. Figures 5 and 6 are images of the crosswell seismic data for each profile. These show the crosswell seismic reflectivity data as wiggle traces laid over the velocity data displayed in color. The interpreted F1 Sand is highlighted on each image, together with other interpreted facies.
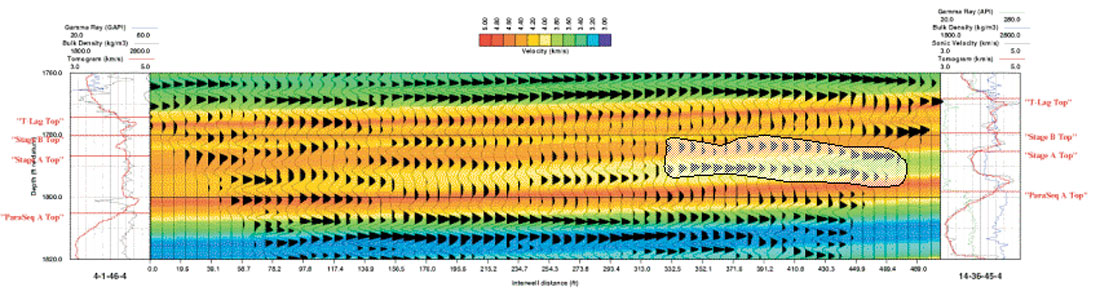
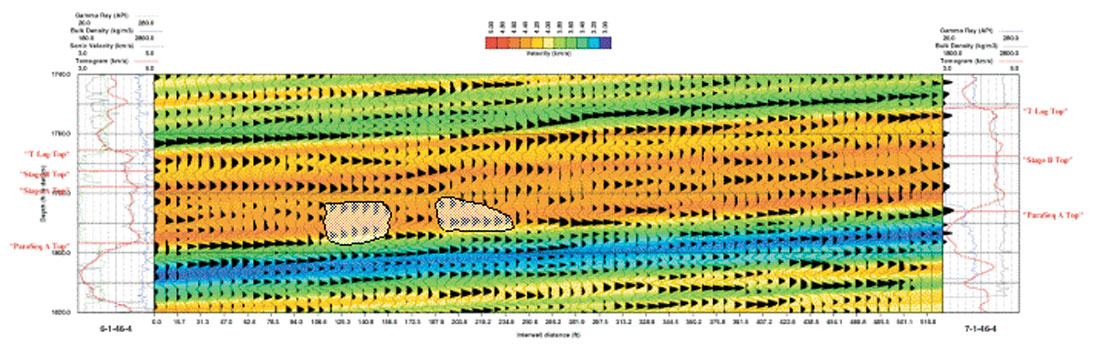
Interpretation of the crosswell reflection images indicate the presence of the F1 sand between wells 6-1 and 7-1 (northern profile) providing an ending target for the horizontal wellbore. There is evidence that the sand has thinned and perhaps bifurcated. The western portion of the sand was targeted for the horizontal well. The sand was determined to be over 200 meters (650 ft.)wide along the southern profile with a western boundary about 200 meters (650 feet) west of well 14-36. The horizontal well was designed based on the interpretations of the crosswell seismic images. The horizontal well was then drilled and remained in the F1 Sand for approximately 1/2 of the trajectory, leaving the F1 sand during part of the northern half of the trajectory, and then re-entering the F1 Sand again at the end of the trajectory between wells 6-1 and 7-1. As a result, the interpretations were confirmed and production was increased.
Additionally, the inter-well data provided by the crosswell seismic images allowed for further understanding of the Crystal Viking Pool facies, and provided valuable depth data on the various parasequence tops and bases. These data have been used quantitatively in the structural-stratigraphic 3-D reservoir model developed for the pool.
Case 2: Carbonate Reefs, West Texas
The oil and gas operator’s objectives in this project were twofold:
- Strategic infill drilling using horizontal wells to tap bypassed production from a prolific high porosity dolomite stringer to increase recovery of the original oil in place (OOIP).
- Enhanced reservoir characterization to optimize water injection for reservoir pressure maintenance.
The geologic setting is a shelf marginal facies with carbonate buildups or reefs. Variability in production suggested reservoir heterogeneities of a sub-seismic nature. Depending on the lateral scale of the heterogeneities horizontal wells drilled by re-entering existing vertical wellbores may provide significant increase in production of bypassed reserves based on a single horizontal wellbore tapping several isolated zones. The general lack of pressure response between wells may also be attributed to these discontinuities and the identification of their lateral extent can result in better placement of water injection for a more evenly distributed pressure regime.
The wells involved in this study have been produced since the 1960’s. Current typical comingled production from a well in this field is 10-60 bbls. per day. The reservoir rock that is the focus of this case history is a massive limestone formation with dolomite stringers having a porosity that ranges from 6-14 percent.
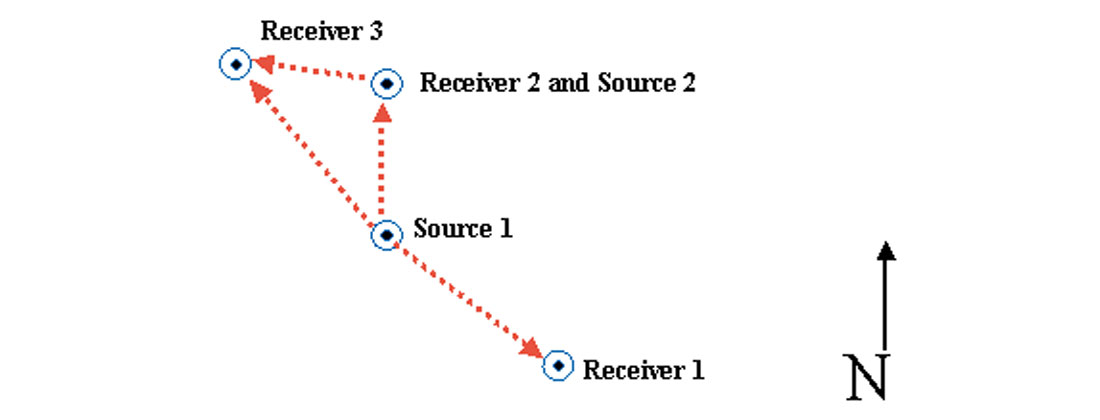
In this project, the operator arranged 4 crosswell surveys between 4 wells that averaged 2,000 feet (610 m)apart, as shown (Fig.7). Through careful attention to well preparation and survey design, these surveys were completed in under two days, resulting in minimal interruption to production. A common-receiver gather shows typical crosswell time records for the survey (Fig.8) The high transmissibility of the massive carbonate section returned very high-resolution data with frequency content up to 2000 Hz in the compressional arrivals. Also present is shear wave data with an upper frequency of 500 to 600 Hz.
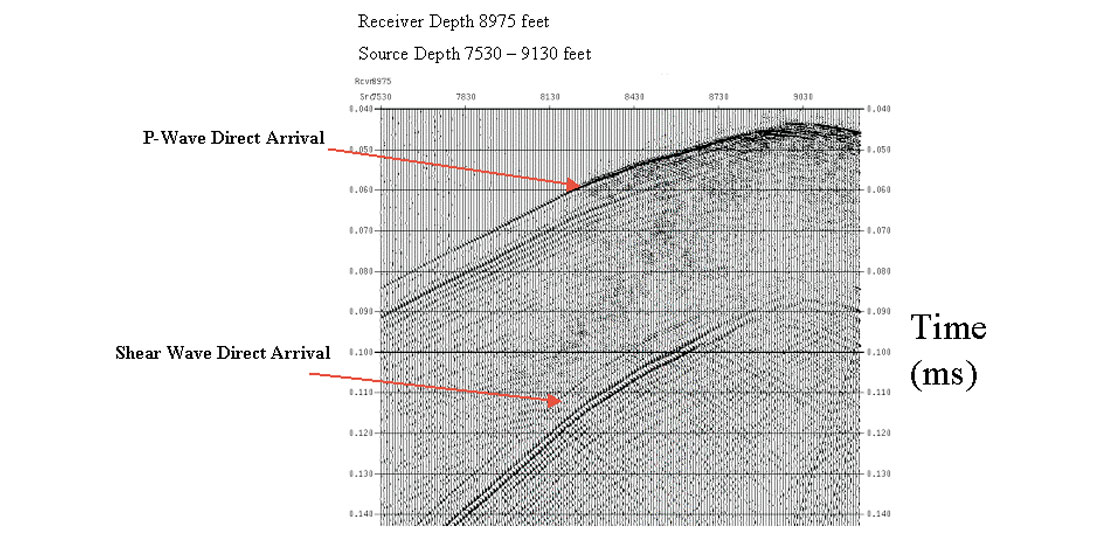
Fig.9 illustrates the results of the survey where the high porosity dolomite pinches-out between the wells. This information geologically explains the observed pressure isolation and lower production of the well to the south. As a result of the crosswell survey a horizontal well originally planned as a re-entry of the well to the south in Fig.9 looks less prospective. The crosswell data indicate that the higher porosity dolomitic production pinched out significantly short of the southerly well, resulting in a significant portion of the planned horizontal well in the non-productive section of the reservoir. The detailed images considered together provide a 3-D view of the reservoir (Fig.10) and allow more prospective horizontal well trajectories to be identified.
Fig.11 illustrates the results from a second well pair to the north. The juxtaposition of the continuous thin layers and the shingling is illuminated by the high-resolution image. Interpretation of these images provides a map of the edges of the buildups. Regions of probable pressure continuity can be identified, allowing more optimum selection of zones in the reservoir for water injection and pressure maintenance, and better choices for injection well locations.
Crosswell Seismic Imaging
Standard reservoir description methodology, led by the advancements in 3-D seismic imaging, has progressed rapidly over the last decade. However, even in its current state-of-the-art form, it is limited by the lack of data at a scale that fits in between that of surface seismic data and wellbore derived measurements. 3-D seismic lacks resolution at stratigraphic scales and has limited ability to independently quantify the various critical reservoir properties. On the other hand, wellbore measurements, such as logs and cores, deliver high-resolution sampling and parametric precision. But borehole measurements only sample a very small volume of the reservoir. In a typical reservoir, this can often be an unrepresentative sample because of the intrinsic geological heterogeneity of the reservoir, i.e. the reservoir properties vary with position in the reservoir.
Crosswell seismic imaging is a new and practical technique for generating high-resolution images of the reservoir between wells. The technology has transitioned from scientific potential to commercial service capability only in the last three years. Crosswell seismic builds heavily on the proven geophysical experience of surface seismic, but in contrast to 3-D seismic, which has evolved from being primarily an exploration tool, crosswell seismic is a development and production tool. New developments in technology and operational capability allow crosswell seismic to address a very broad range of reservoir challenges. The major advancement provided by new high-resolution, measurement-based methods, is that detailed reservoir features can be directly imaged, as opposed to statistically estimated. This has direct application in the two cases in point, where the exact trajectories were precisely mapped along the productive horizons, and faults and compartmentalization features were clearly identified in advance of drilling the wells.
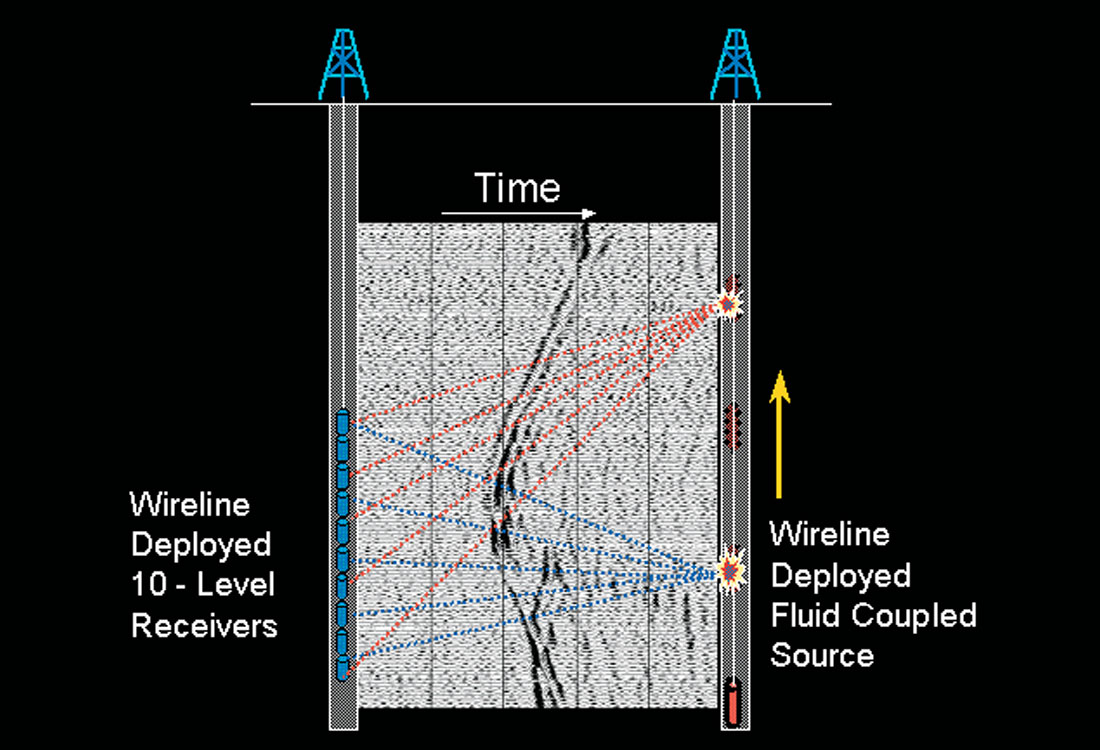
The process of data acquisition is conceptually simple: crosswell seismic takes the seismic survey from the surface down into the reservoir itself. This yields several practical advantages, the most obvious one being 10 to 100 times better vertical resolution achieved (typically 1 to 2 m). Measurements are directly referenced in depth and co-located with well log data and are not affected by near surface effects. Similar to standard wireline operations, crosswell seismic field operations utilize two or more wells simultaneously. A downhole seismic transmitter or source is lowered into one well, while receiver arrays are lowered into one or more adjacent wells. TomoSeis’ patented crosswell source (X-Series(tm)) uses piezoelectric technology, producing controlled displacements of the borehole fluid to distribute energy over a large surface area in the wellbore. The proprietary design uses multiple piezoceramic radiator elements coupled into several radiating arrays that are swept by surface programmable source controllers. These arrays have radiation patterns optimised for crosswell seismic. On the receiver side, TomoSeis’ TARS active-array receiver system is specifically designed for high speed, reliable crosswell seismic data acquisition, built to withstand the rigors of the production well environment and to operate in vertical and deviated wells and both open and cased holes. Several well pairs can be logged simultaneously with receiver systems deployed in multiple wellbores around a single source-well. Proprietary ceramic hydrophones are used because they offer faster data acquisition and superior frequency response (100 Hz to 4 kHz) to geophones, which is critical for high-resolution imaging.
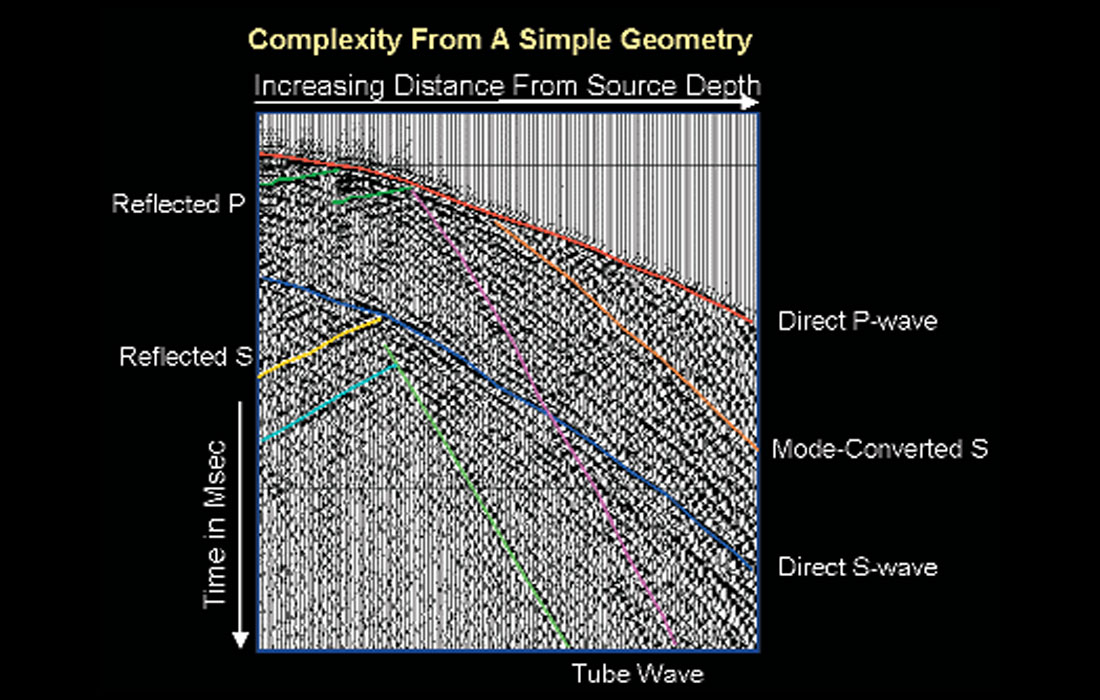
High-bandwidth (typically 200-2000 Hz) data are then collected between the wells, directly across the reservoir or other zone of interest by pulling the source past the receiver array, while continuously firing the source. See Fig.a This technique greatly accelerates the speed of acquisition. Typically, a complete crosswell survey can be conducted in one or two days. The resulting crosswell seismic data recorded contains a wealth of information about the reservoir’s properties and structure. See Fig.b.
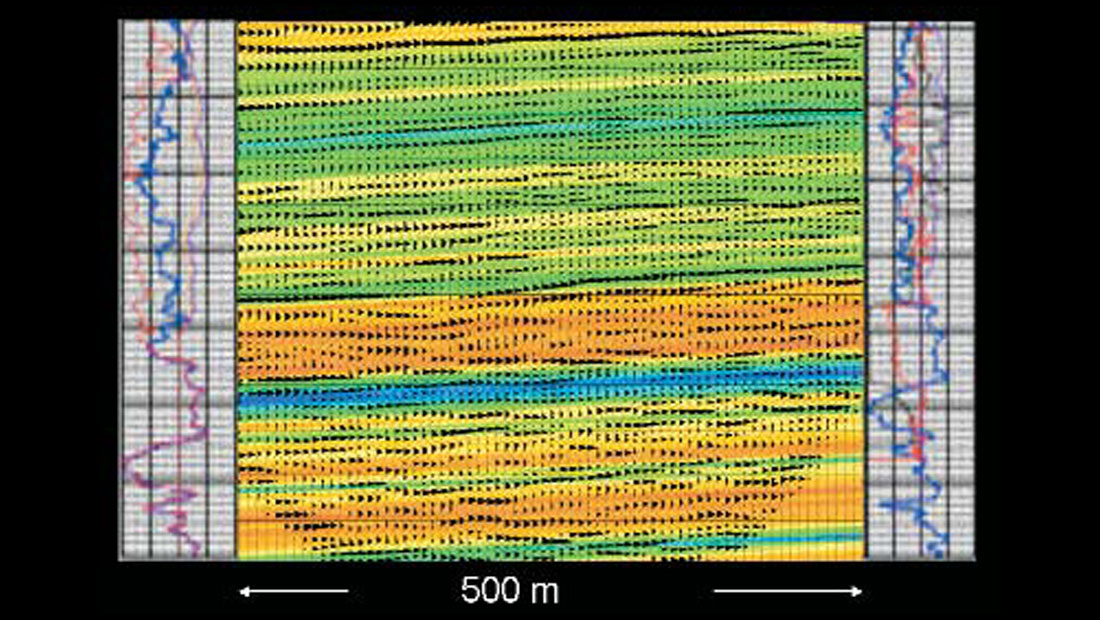
As with standard seismic processing, many methods are used to extract the required data resulting in a properties description (velocity field) and structural image of the interwell space. After raw data editing and fixing, the first processing step generally employs travel time inversion (crosswell tomography) to yield a velocity map between the wells-basically, an “interwell sonic log” of the reservoir (Washbourne, 1999). This tomogram is directly referenced in depth and is used as the base model for reflection imaging. Fig.c. Subsequent processing steps include wavefield separation and VSP-CDP mapping (as in offset VSP) to produce a detailed reflection image of the reservoir’s structure (Lazaratos, 1993). The resulting image is similar in character to surface seismic or VSP, but at greatly increased resolution. Other information such as shear, mechanical properties, anisotropy, and guided wave modes (continuity logging) can be analyzed and integrated into the overall reservoir model.
Crosswell Seismic: Other Applications
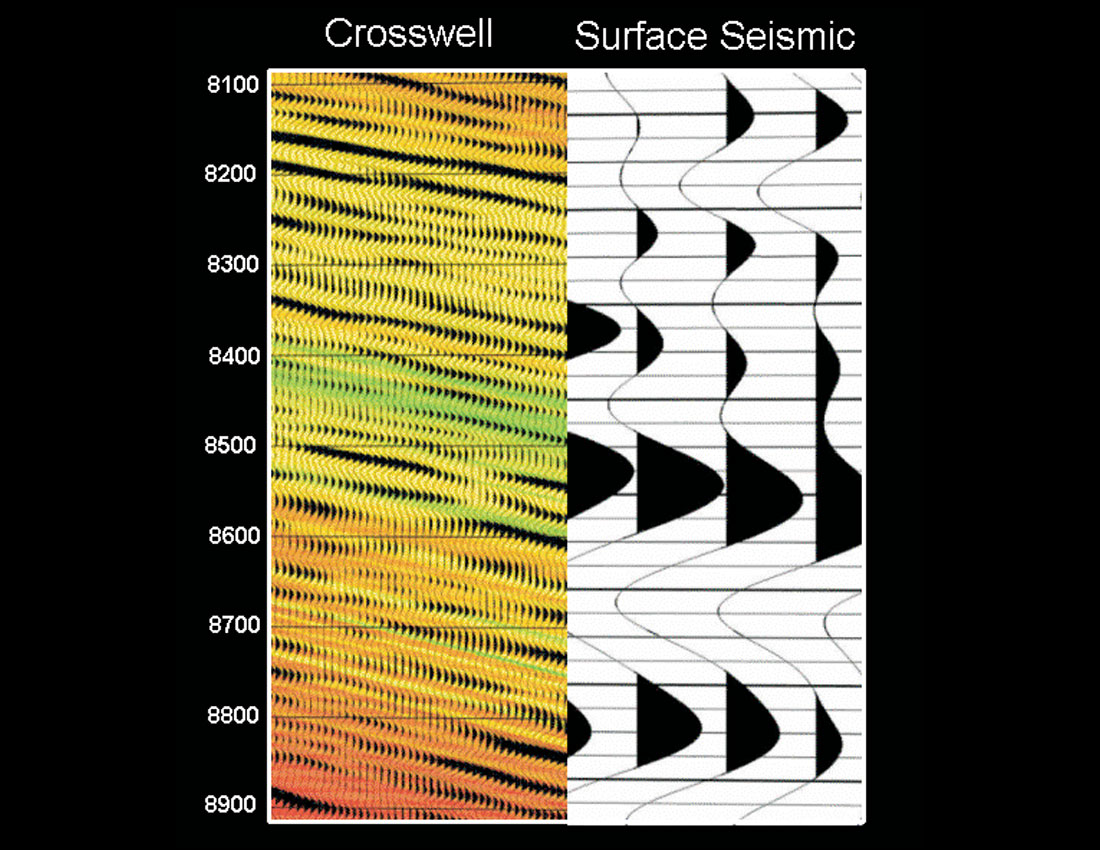
Crosswell seismic can be used in many applications where the resolution advantage over surface seismic (see Figure d) is required to solve reservoir problems. Applications include:
Reservoir Description
- Sub-seismic Structure or Stratigraphy
- In-fill Drilling
- Static Properties
Monitoring
- SAGD
- CO2 Floods
- Steam Floods
- Gas Storage
- Surface Seismic calibration


Join the Conversation
Interested in starting, or contributing to a conversation about an article or issue of the RECORDER? Join our CSEG LinkedIn Group.
Share This Article