There have been tremendous advancements in 3D multicomponent seismic acquisition, processing, analysis and interpretation over the past five years. Improvements have been made in PS-wave (converted-wave) signal processing, including velocity analyses and anisotropy, interpretation and event registration of PP and PS data, and prestack imaging. Both PS-waves and P-waves (compressional waves) from multicomponent ocean bottom cable (OBC) data provide additional opportunities to understand the subsurface. The converted waves are generally used to provide complementary images and velocity information to support the conventional seismic model. However, they also provide a new opportunity to measure and understand S-wave (shear wave) azimuthal anisotropy. This technology requires new methods for detecting azimuthal anisotropy in 3D-4C data, and also, advancements in our understanding of multicomponent vector fidelity, lithology and fluid discrimination, velocity model building in gas obscured structures, and the nature of S-wave birefringence or splitting.
The purpose of this article is to discuss recent advancements in just two of the areas listed above: S-wave splitting, and prestack migration. This doesn’t mean the other topics are not important, only that there is not enough space to discuss them all. We show case studies from land and marine environments which indicate that S-wave splitting is very sensitive to subsurface horizontal stresses. Using established techniques of transverse component analysis and 2Cx2C Alford rotations applied to PS-waves, S-wave azimuthal anisotropy measurements appear to correlate well with borehole logs and production induced deformation. Prestack imaging is the next important step, now that conventional processing methodologies are well established. We show examples of prestack time and depth migration that are providing significant improvements in PS-wave resolution.
S-wave splitting and rock properties
Shear-wave splitting is an essential phenomenon that occurs to some degree in all our multicomponent surveys. Being able to quantify the effects of birefringence and apply appropriate processing techniques is critical to obtain good images and improved understanding of the rock properties responsible for splitting.
Fractures in the earth tend to be aligned and vertical because of the stress regime where they are formed. They come in all scales from micro cracks to large fractures and faults. They also occur in multiple sets, generally two that are conjugate or orthogonal, or often three sets. However there is generally only one open set of fractures aligned with or related to the maximum horizontal stress direction.
If these fractures are smaller than our seismic wavelengths we don’t measure or image individual occurrences. Instead we get an average response. This averaging of small scale, ordered heterogeneities leads to the larger scale directional dependence in the form of azimuthal anisotropy. By measuring suitable seismic attributes of this anisotropy we can infer information about the orientation and hopefully the density of the fractures. These attributes are obtained from both the P-wave data and S-wave splitting, where a simple and accurate form of this anisotropy is an HTI (horizontal transverse isotropic) medium, representing a single set of vertical fractures.
Valhall near-surface
The Valhall OBC survey acquired for BP was primarily designed to improve imaging of the crest of the Valhall structure where conventional seismic imaging was degraded by gas (Rosland, 1999). A re-processing project (Olofsson et al., 2003) improved seismic velocity information in the overburden where the seabed acquisition system and geometry were expected to have a number of positive effects on the shallow data.
The geometry was designed for sufficient coverage at the target level but the 600 x 600 m cross- spread design had only limited fold and coverage in the shallow overburden, constraining any velocity analysis methods. Although S-wave splitting was expected to affect the PS-waves due to fracturing in the crest of the reservoir structure, the anisotropy analysis of the shallowest layers gave a striking result that had not been seen before.
Figure 1 shows a ring of observed azimuthal anisotropy superimposed on color contours of seafloor subsidence. Each short bar indicates the orientation of the fast S-wave polarization and its length the amount of S-wave splitting. Individual analyses were performed at the intersection of shot and receiver lines. The contours range from zero to four meters of subsidence that occurred between 1978 and 2001.
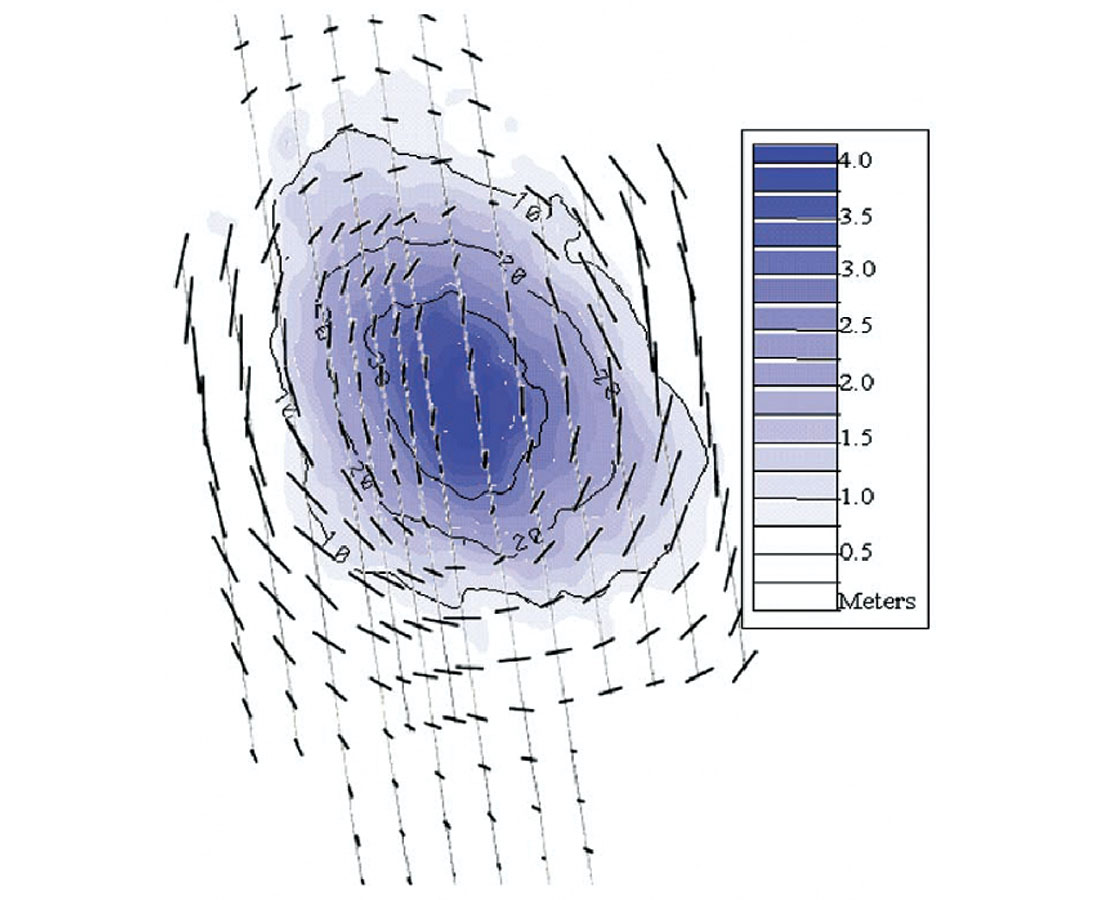
Correlation between S-wave splitting anisotropy and seafloor subsidence is indeed remarkable given the relatively small amount of subsidence. Reliably detecting this amount of change below the seabed could be challenging with conventional seismic; however, S-wave splitting appears to be robust and it is possibly more sensitive than looking directly for time differences in conventional P-waves Also, S-waves have an advantage because of their slower velocity and increased shallow resolution.
It is worth mentioning that further azimuthal anisotropy analyses showed S-wave splitting in many layers below the shallowest and above the reservoir level. Correcting for these effects has significantly improved the quality of the converted wave image.
Pinedale anticline
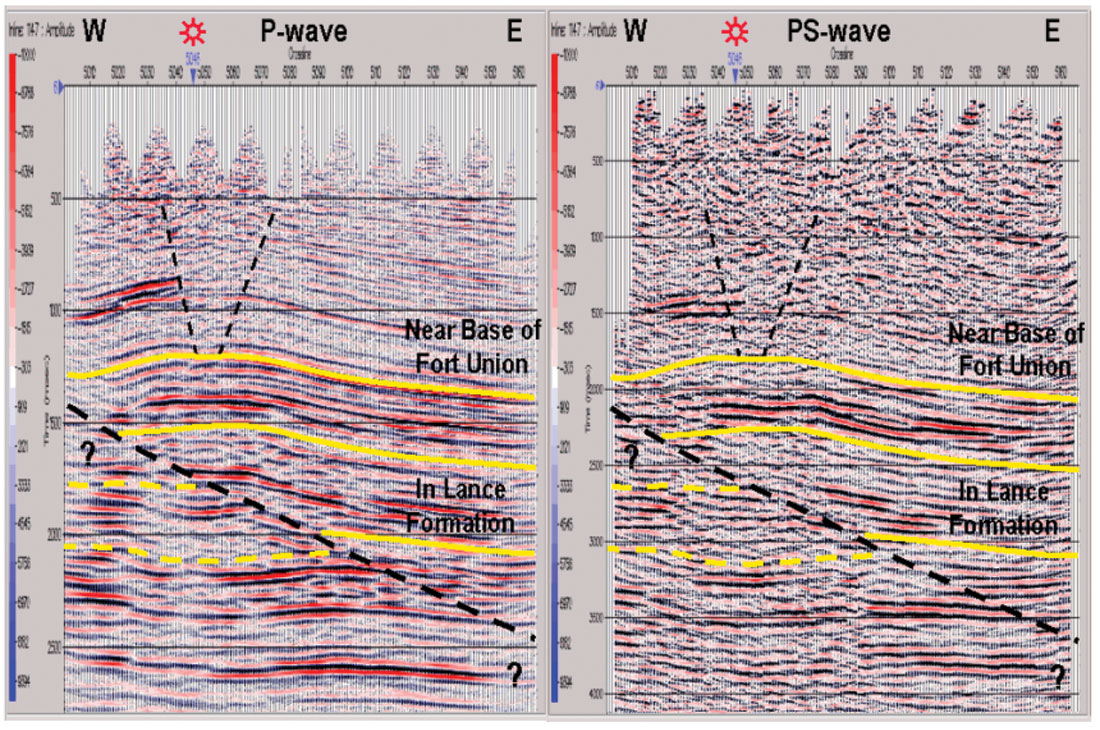
At the Pinedale field in Wyoming, a PS-wave seismic survey was acquired to quantitatively identify naturally fractured zones. The targets are Cretaceous tight gas sand reservoirs at depths between 3,000 and 4,500 m in the Lance formation. Figure 2 shows the P-wave and PS-wave interpretation over the Pinedale anticline. The PS-wave section is compressed in time by a Vp/ Vs ratio of 2 to match the P-wave. Although these reservoirs are associated with natural fractures, they require induced fracture treatment to provide the necessary permeability for production.
A 3D-3C survey was designed and acquired to provide wide-azimuth and good offset distributions at the target. Receiver lines were oriented N70°E and the shot lines were oriented at 45° to the receiver lines in roughly a NW-SE orientation to yield a CMP fold of approximately 50 for P-waves and 50 for PS-waves over 25 km2.
Alford (1986) rotation adapted for PS-waves (Gaiser, 1999) provided a means to combine the multi-azimuth data into a single 4C volume. The four azimuth volumes of radial and transverse components were analyzed to identify the orientation of the fast S-wave polarization and the amount of S-wave splitting between the fast and slow modes. This was done for the overburden Fort Union formation, an intermediate layer and the target Lance layer.
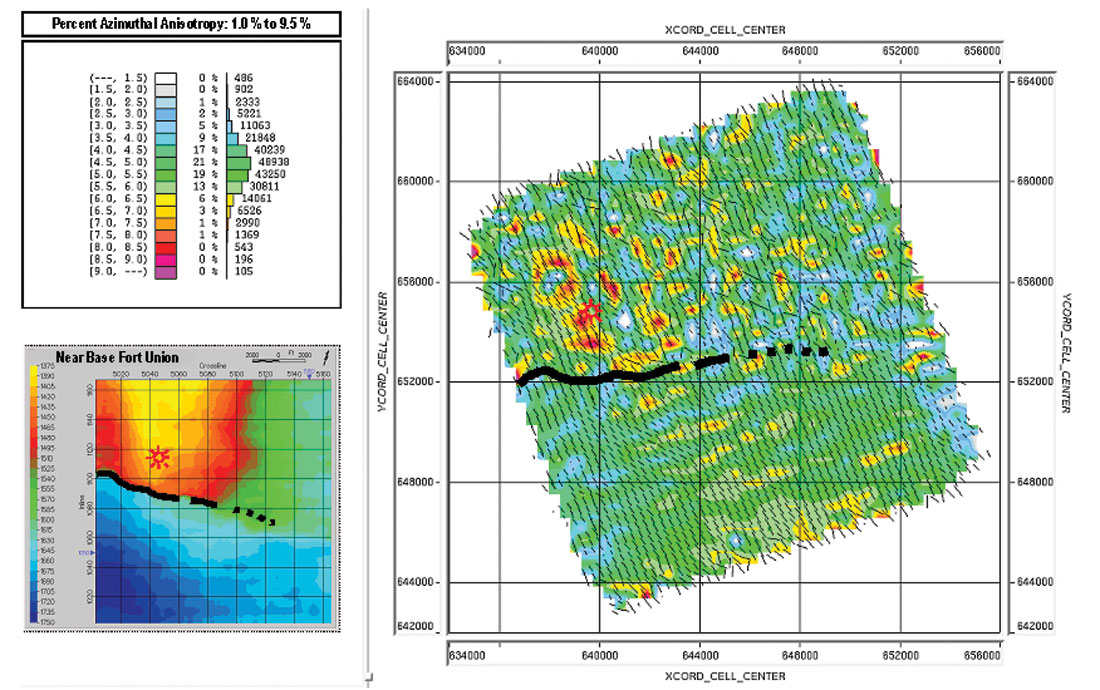
Figure 3 shows the overburden azimuthal anisotropy analysis from surface to near base of Fort Union. Colors represent percent anisotropy (fracture intensity), which have a peak distribution between 4% and 5%. The small lines indicate the orientation of the fast S-wave (fracture orientation), which averages around N35°W and is aligned with the regional stress direction. Note that the more intense anisotropy occurs over the Pinedale anticline, which would be consistent with regions of extensional stress and more intense fracturing.
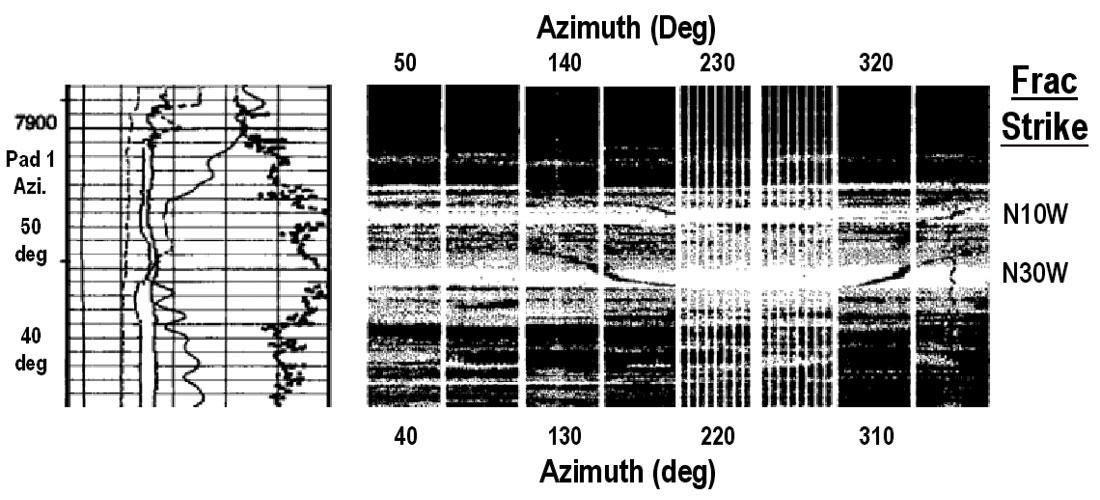
It is important to use well log information, such as the FMI and dipole sonic logs to calibrate these anisotropy results. For example, the FMI logs from the Antelope 15-23 well, located at the southern tip of the anticline, show mostly bedding planes near horizontal dip, but at many levels dip exceeds 30° and 40°, which could be related to low-angle fracturing associated with the thrust fault tectonics at Pinedale. It is interesting that at these levels, the fracture strike is qualitatively in agreement with the principal PS-wave directions. Also, close to base of Fort Union, the strike of near vertical fractures (Figure 4) agree with the N20ºW fast S-wave orientation. Although these are probably drilling induced fractures, they agree with the orientation of the anticline axis at this location, which is rotated slightly to the N-S direction. This indicates that the fast S-wave polarization is very sensitive to local stresses.
Further layer stripping below the overburden can provide azimuthal anisotropy for target layers. Production at Pinedale field is primarily from the Lance formation where fractures play an important role to assist permeability. Related to the flexure and structural complexity of the anticline are faults that cut through both fore and back limbs (Figure 2). Induced fracture treatments conducted at nine levels over 600 m in the Antelope 15-23 well have resulted in the production of 62.7 MMcf gas and 2,123 Bbls oil over one and a half years. The azimuthal anisotropy analysis over the Lance formation shows similar results as Figure 3, where more intense anisotropy occurs over the apex of the anticline, but also to the east. High anisotropy areas would be candidates for further investigation as potential fracture sweet spots, particularly where basin-centered gas reservoirs play an important role in gas accumulations in the area.
Prestack Time/Depth Migration
Conventional processing methodologies are well established for PS-waves for determining S-wave statics and velocities, and it is critical to determine these fields before PSTM or PSDM (prestack time or depth migration). Although VTI (vertical transverse isotropic) velocities and anisotropy are implicitly incorporated in the moveout velocities for conventional processing, this anisotropy must be explicitly measured for prestack migration.
The actual methods used are dependent on the geometry and geophysical problems for each survey. In some cases the PSTM model has been used as the initial model for the PSDM, and in others the PSDM is built from scratch with a simple starting Vp/ Vs model and the P-wave model. The PSTM method has been widely used in a number of different areas and has proved to be a reasonably efficient and accurate tool for PS imaging. It is well known that PS-wave imaging is more sensitive to anisotropy than P-wave imaging and it is essential that the PS-PSTM is anisotropic. Where well data exists it is possible to calculate an initial δ and ε (Thomsen 1986, VTI parameters) model, and without well data the empirical ANNIE model, described by Sayers and Johns (1999) can be used. Both methods can be updated during the iterations of PS-PSTM and velocity corrections as described by Kristiansen et al. (2004).
Where velocity changes rapidly we can expect that PS-PSTM will be limited in the same way that it is for P-wave PSTM. In these cases PS-wave imaging will be improved by PSDM. Joint PP and PS tomography is clearly the ideal method to update the depth model, when this is impractical a sequential, layer-based or gridded method has been successful. In the sequential solution, updates to both models are refined layer-by-layer rather than assuming the P-model is completely accurate and updating only the S-model. Incorporating all available well data is essential to guide and constrain the model. Crompton et al. (2005) give details of the model building and joint P and S updates on a recent project. In that case, WVSP (walk-away vertical seismic profile) data has also been used to compare with the model to ensure that both models are consistent with each other and match the well data by using event matching in the tomography program. Crompton also showed that tilted transverse isotropy (TTI) was introduced instead of VTI. This accounted for the dip and azimuth of the horizons and the TTI model has improved the imaging.
Synthetic PSDM
To verify the accuracy and effectiveness of any migration algorithm it is important to test the code on synthetic data where velocity and model are known. For this purpose, synthetic data were computed using a modified version of the SU (Seismic Unix) code from the Colorado School of Mines to calculate P and PS-wave traveltimes for linear velocity gradients in factorized transversely isotropic medium. The unique property of such a medium is that vertical Vp/ Vs and the amount of anisotropy remains constant while velocity increases with depth.
Many models were studied with a linear velocity gradient, Vp = 1.8 + 0.6 z, and a constant Vp/ Vs = 3. Various amounts of anisotropy were tested for both PSTM and PSDM, where ε = 0.15 for a maximum value and δ = 0.1, 0.08, 0.06 and 0.04. Data sets were generated with a range of positive and negative offsets from +/- 3 km, and for both P-wave and PS-waves. Figure 5 shows a 2D synthetic PS-wave data example computed for the 2000 m offset gather. The superimposed white lines indicate the time position of reflectors where dip varies from 30 to 90 degrees and five point diffractors are located in the center.
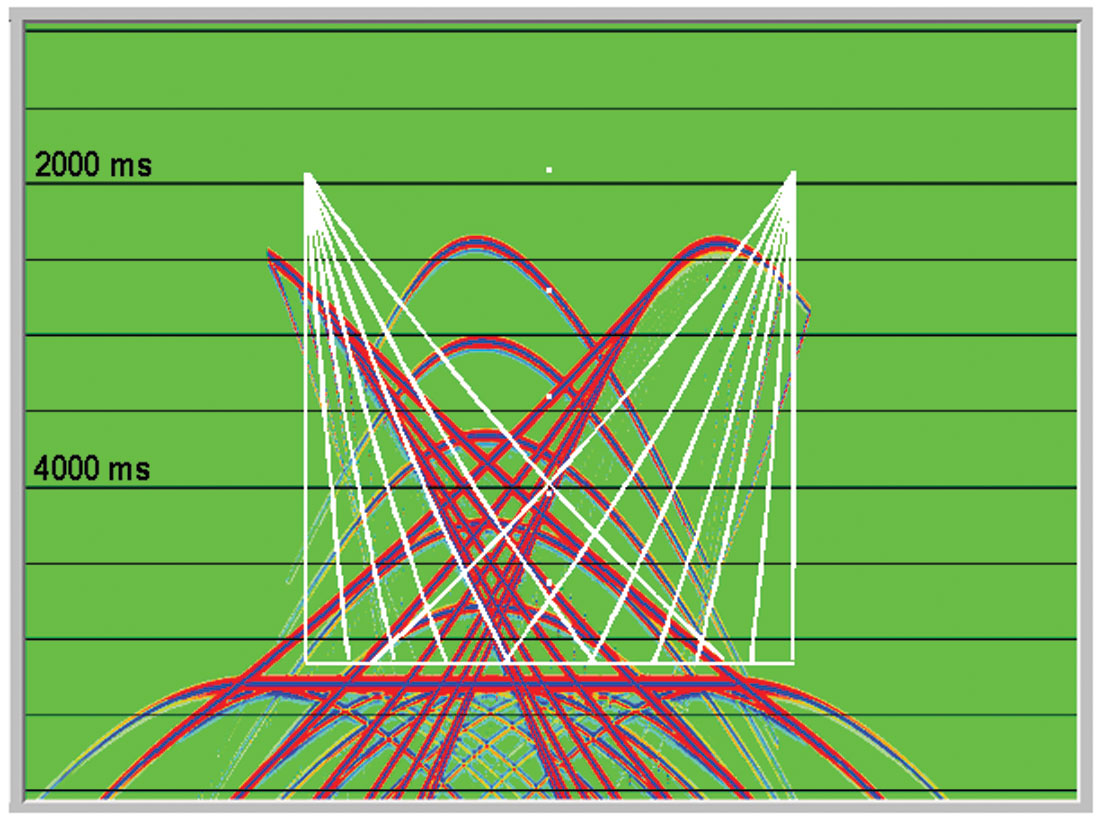
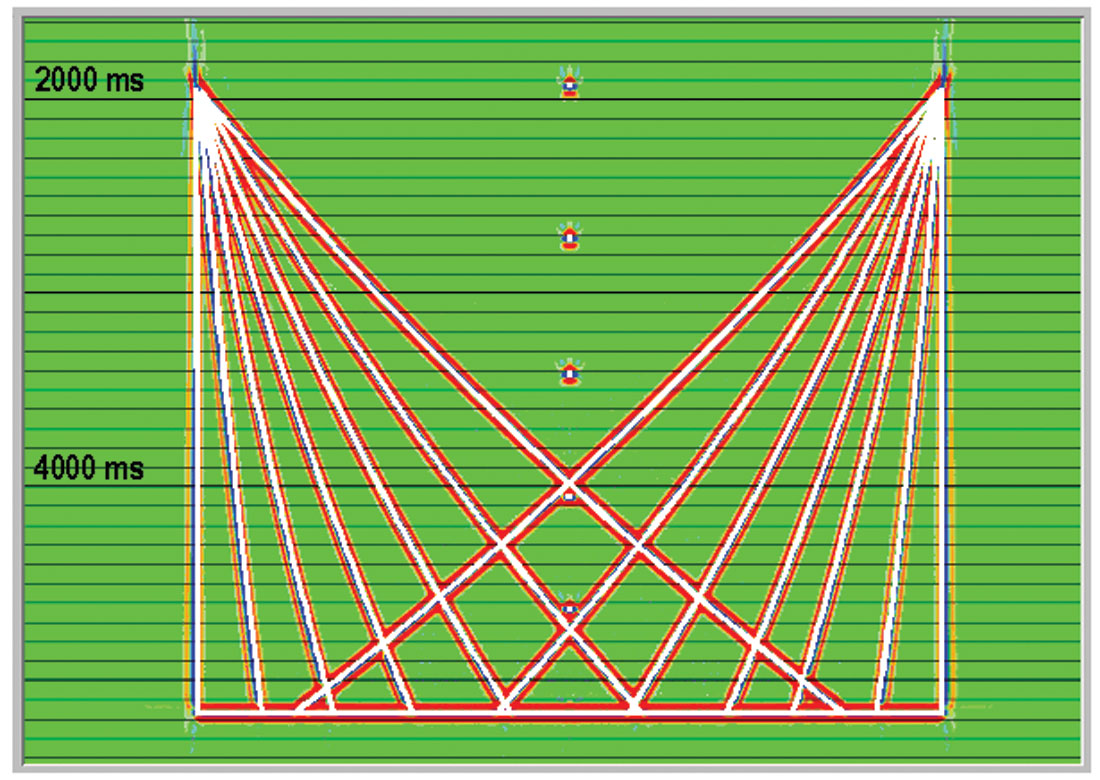
Figure 6 shows the all offset migration result of a dataset with an intermediate δ value. PSTM was performed using a converted-wave Kirchhoff algorithm where traveltimes were computed for turning rays in a VTI medium. Agreement of the stack with the model of the point and dipping reflectors is very good. PSTM can handle simple models very well but it is limited with strong anisotropy and higher Vp/ Vs values.
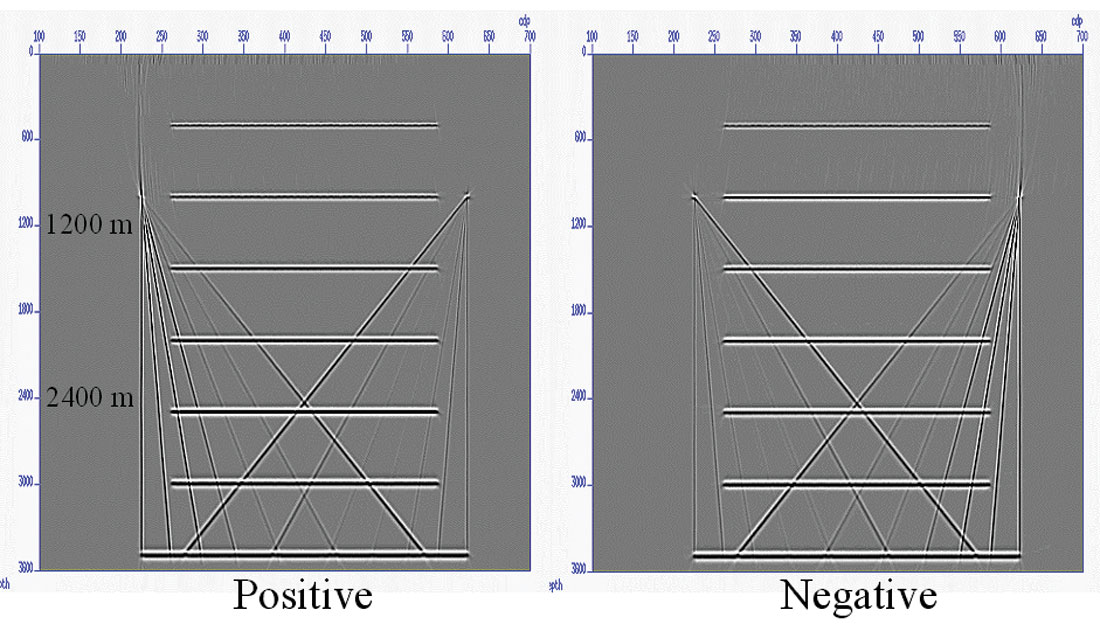
As expected, in these cases PSDM behaves much better and can accurately position and focus the data. Figure 7 shows the stack results for both positive and negative offsets after PSDM. In this case the anisotropy was larger and traveltimes were computed by an exact and efficient ray method. Also, the point diffractors were replaced with more extensive flat reflectors for the purpose of velocity model building. This provided a means for construction of velocities for PSTM and to help constrain the anisotropy for PSDM. Note the different illumination of dipping events for positive and negative offsets, a characteristic of imaging with asymmetric PS-waves.
Caspian Sea
Recent work has shown that complex structures can be significantly improved with PSTM and PSDM imaging for converted waves. The 4C data acquired in the Caspian Sea has very challenging structural and geophysical problems, including steep dips, shallow gas and seabed disruption associated with mud volcano features. PSTM and PSDM have been successfully used to image beneath some of these problems as reported in the September edition of The Leading Edge by Bouska and Johnston (2005).
This is a particularly challenging area for seismic data and conventional towed seismic fails to image the crests of many structures that are associated with mud volcanoes. The mud volcanoes provide dramatic structures caused by fluidized mud and shale being forced from deeper layers towards the surface. The poor quality seismic areas are thought to be influenced by gas in the overburden, unconsolidated sediments, and heterogeneities causing highly scattered noise. Figures 8 and 9 show a comparison for PZ (summed hydrophone and vertical geophone data) and PS-PSTM. The structure and shallow resolution are improved on the PS image.
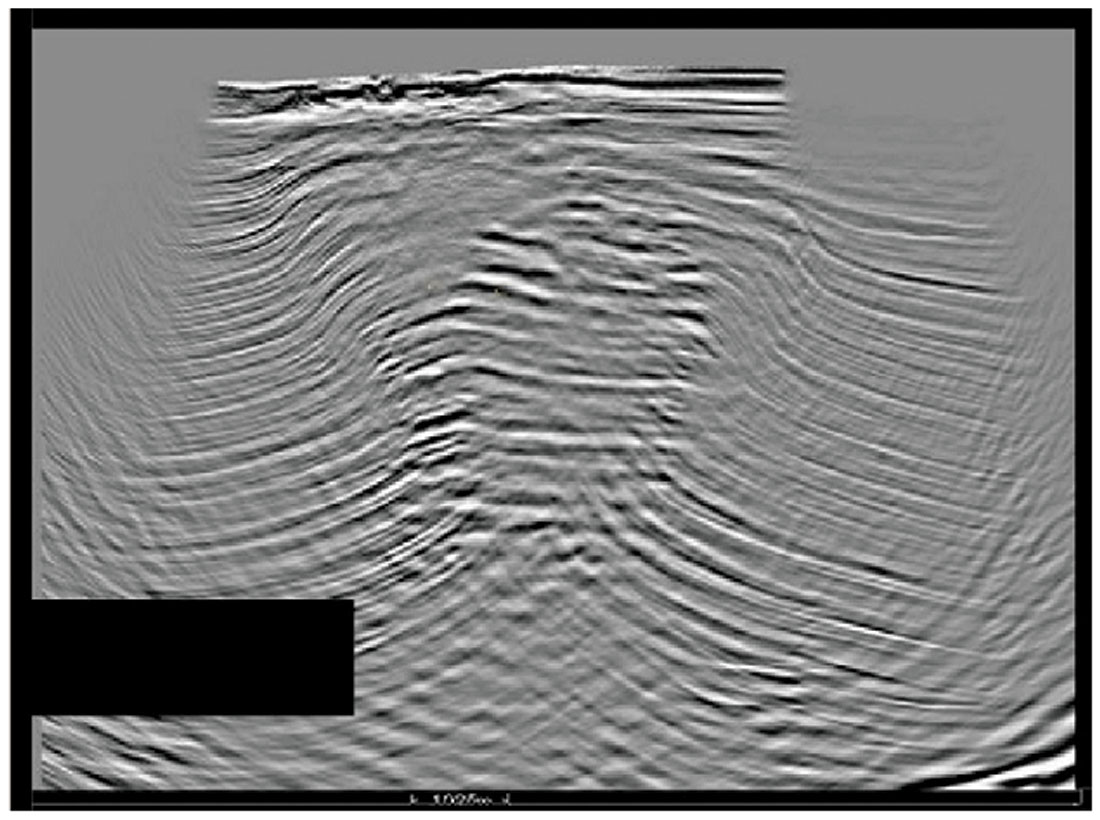
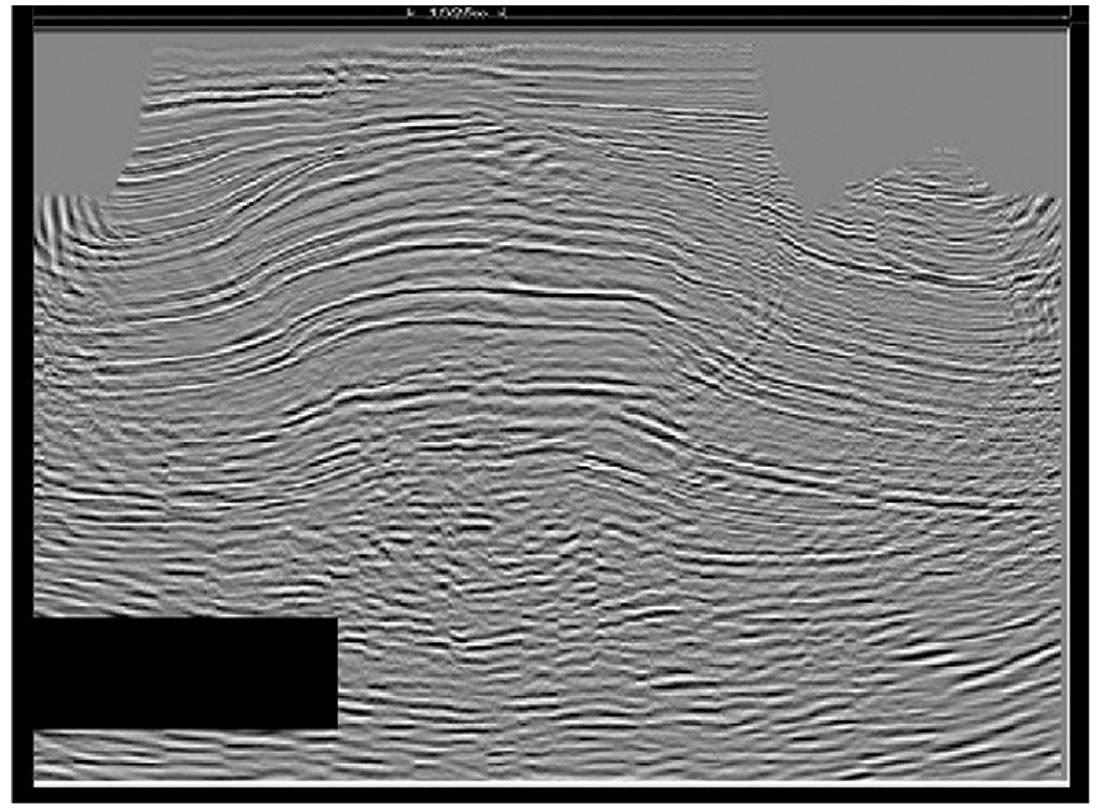
Bouska and Johnston (2005) concluded that the OBS (ocean bottom seismic) data has provided a breakthrough technical solution to the problems associated with zones of poor seismic data quality in these structures in the Caspian Sea. This is attributed to a combination of many factors with using OBS data, including wide azimuth and regularly sampled acquisition, but also optimized approaches to noise attenuation, signal enhancement, velocity estimation, and pre- stack imaging. In some places the PZ images from the OBS data provide an improvement compared to the towed seismic. This could be a combination of a wide azimuth and the low frequencies often seen in OBS data. In such complex structures the wide azimuths illumination gives more data to constrain the imaging, and provides undershooting of localized imaging problems. The PS image has provided the best image where the S-waves have been less affected by the gas and other velocity anomalies. There has always been some concern that these same problems near the seabed would hinder the S-waves from even reaching the OBS sensors on the seabed but this has never proven to be a problem.
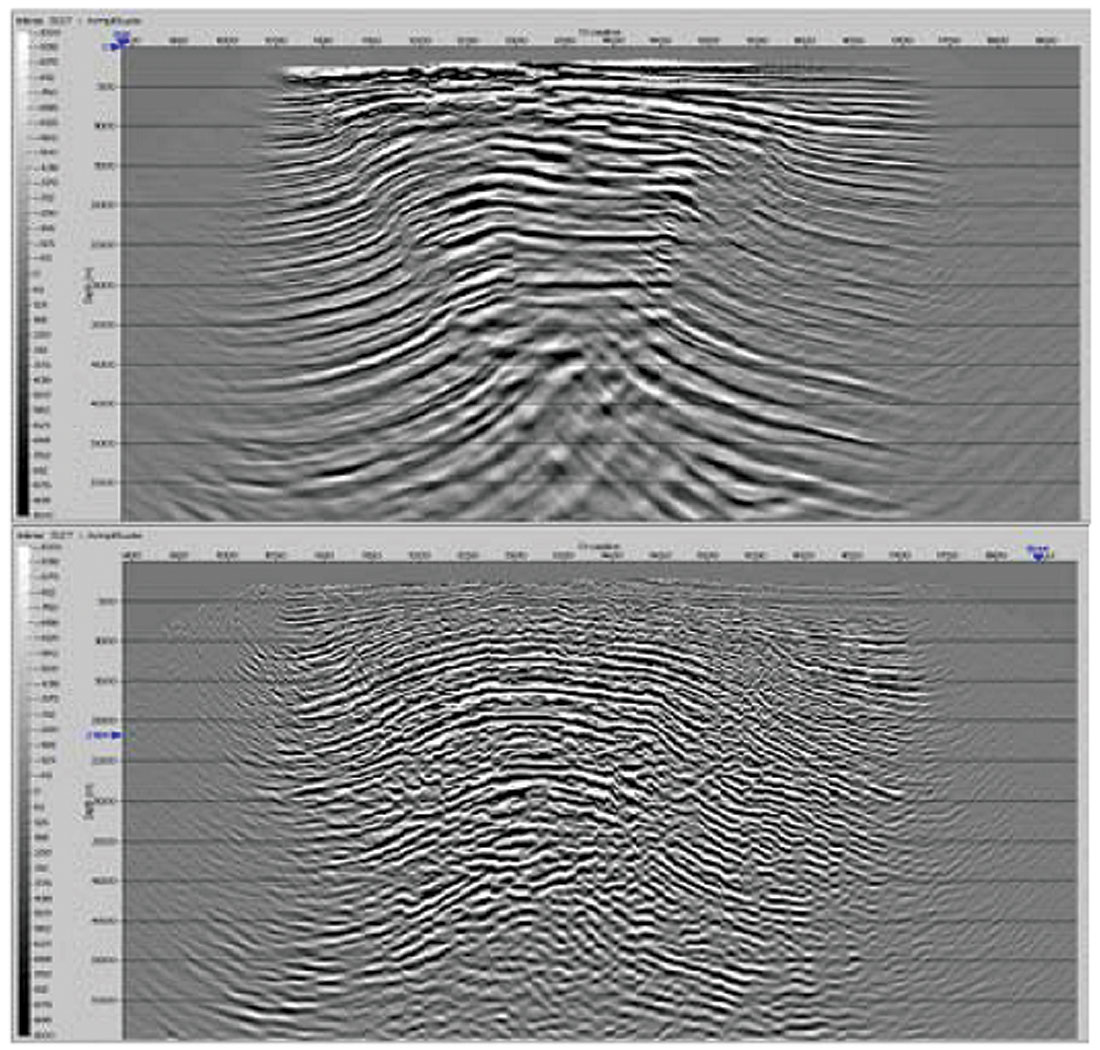
Figure 10, from Crompton et al. (2005), shows a comparison of the PSDM images for the PZ and PS at Gunashli. In this area the PS shows a more continuous dome-shaped anticline and the P-wave image shows signs of gas pushdown. It is interesting to note that the two images also appear to have similar vertical resolution. This is something that is being observed more often in other PS-wave projects after accurate PSTM and PSDM. It is easy to imagine that any defocusing or imaging problems can only lower the resolution of the PS images.
Future Directions
Although we are confident that PS-waves are giving us images of subsurface stress variations, the fracture scale is largely unknown, and finer resolution is needed. These are important areas of research: establishing the relationship between fracture size and frequency dependent S-wave splitting, and developing fine layer stripping algorithms. Another important area of research is obtaining azimuthal anisotropy of seismic attenuation. This may be an order of magnitude larger than the velocity anisotropy (Zhu and Tsvankin, 2006) and could lead to developing a better understanding of permeability.
The most important multicomponent processing development for PSDM will be to include the effects of azimuthal anisotropy. Proper downward continuation of the fast and slow split shear S-waves is essential for unraveling the complex waveforms and providing more accurate shear velocity models. Without handling shear S-waves properly in PSDM we won’t be able to accurately utilize time lapse monitoring for reservoir stress changes, or perform joint inversion of PP and PS-wave data.

Acknowledgements
We would like to thank Werner Heigl with the Colorado School of mines for his help in processing/migrating the synthetic data examples and with the velocity model building.


Join the Conversation
Interested in starting, or contributing to a conversation about an article or issue of the RECORDER? Join our CSEG LinkedIn Group.
Share This Article