The following derivations and equations describe anisotropic, “Transversely Isotropic” (VTI and HTI) Poisson’s ratios to obtain realistic in-situ estimates of Minimum Horizontal Closure Stress and its relation to Thomsen’s δ, and Sayers’ K0 and χ terms (Thomsen 1986; Sayers 1995, 2010).
VTI anisotropy
In the past seismic imaging and AVO were driven by isotropic models of the Earth. More recently the use of quantitative interpretation attributes to characterize unconventional reservoirs has continued within this isotropic assumption. However, at the 2013 SEG convention, Leon Thomsen argued that industry has been doing AVO wrong for 30 years, and doing geomechanics wrong for 5 years, by ignoring anisotropy in seismic methods that are increasingly being applied to extract geomechanical properties of the Earth (Goodway et al., 2006, 2010, and 2012). In his presentation Thomsen showed a VTI stiffness matrix in terms of anisotropic λ, μ parameters leading to a conclusion that λ13 is a simple expression of P-wave modulus M0, and Thomsen’s polar anisotropy parameter δ (Thomsen 2013).
However, the very same anisotropic VTI stiffness matrix showing the connection of δ to λ13 and λ⊥ (vertical or perpendicular to layers) in terms of a stress strain matrix was previously derived by Bill Goodway, as shown below, and published in the CSEG RECORDER nearly 15 years ago (Goodway, 2001).
Thomsen initially developed his parameters for TI media with a vertical symmetry axis (Thomsen, 1986). This layer induced anisotropy, subsequently renamed VTI, is formulated as a stress-strain tensor matrix relationship (Matrix A, below) and contains five independent anisotropic stiffnesses instead of the two for the familiar isotropic case.
Matrix A
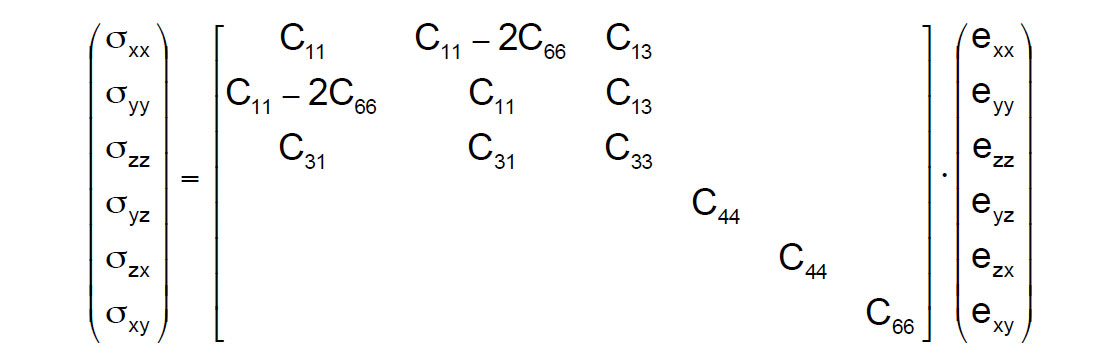
This matrix can be represented in Lamé moduli terms as Matrix A’ below modified from Sheriff’s Dictionary of Geophysics (Sheriff 1991, p 99) as a simpler more common representation of VTI media,
Matrix A'
where ≡ is measured parallel to layering and ⊥ is perpendicular to layering, while λ13 (= λ31) and λ33 (with λ33 being equivalent to λ⊥) are contained in stiffnesses C13 and C33.
With this version of Sheriff’s matrix Thomsen’s δ is represented in Lamé terms as:
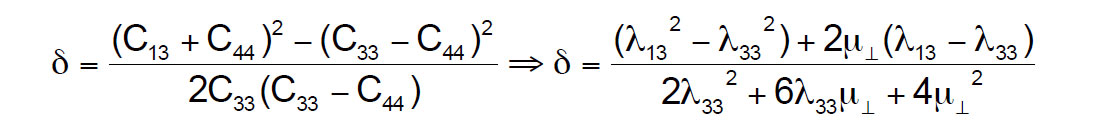
These equations reveal δ as being a function of the difference between λ13 and λ33 and their squares.
To obtain a physical sense of the difference between these anisotropic lambdas, consider a VTI version of Hooke’s law for axial stress in the vertical z-direction given as:

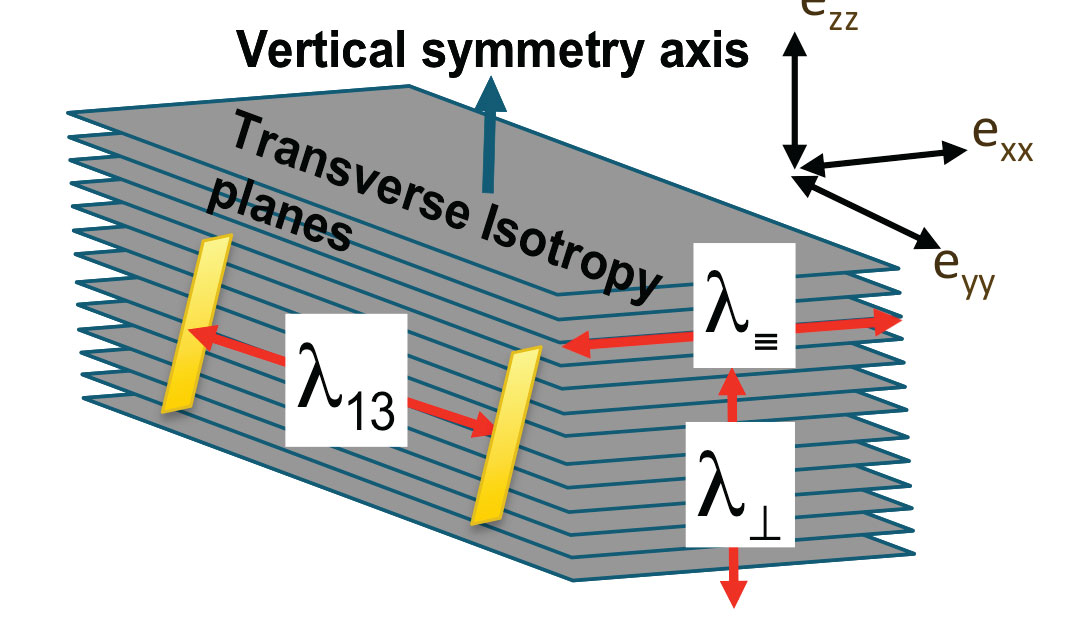
The difference between λ13 and λ33 can be seen as contributing to a difference in axial strain ezz to transverse strains exx and eyy, from lambda terms alone, unlike the isotropic case where the contribution is equal. This suggests that δ is influenced more by variations in lambda due to both the solid planes and fluid or kerogen fill between the planes, in both VTI (see figure 1) and HTI models (Berryman et al., 1999).
The recent interest in hydraulic fracturing of unconventional reservoirs requires an estimate of minimum stress, since this determines the downhole pressure required to propagate a hydraulic fracture.
Neglecting terms involving horizontal strains, the Minimum Horizontal Closure Stress σh may be written in terms of the vertical stress σV and pore pressure p as:

where αh and αV are poroelastic coefficients, and K0 = C13/C33 (Sayers, 2010), with K0 being equivalent to the bound Poisson’s ratio ν* as defined in the next section.
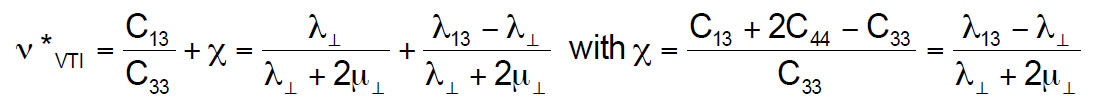
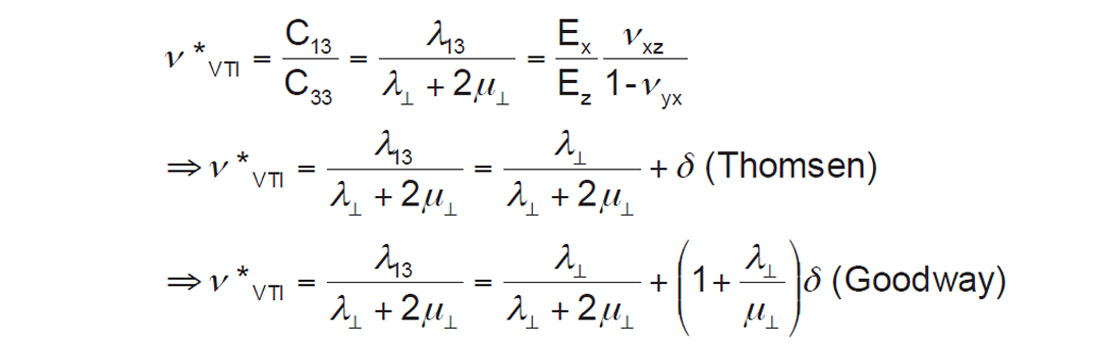
The impact of VTI anisotropy on the Minimum Horizontal Closure Stress is well documented as being a function of Thomsen’s δ (Sayers, 1995 and 2010; Goodway et al., 2006; Thomsen, 2013). As δ is almost always positive (NMO velocity > vertical velocity), λ13 > λ⊥ implies stiffer lambda values parallel to than across layers (figure 1). This difference in lambda can be used to derive the anisotropic VTI bound Poisson’s ratio ν*VTI (Sayers’ K0VTI) from the isotropic form ν* (Sayers’ K0ISO) within the Minimum Horizontal Closure Stress equation and is equivalent to a quantity termed χ from Sayers’ 2010 SEG DISC notes (page 120) as shown in the following derivations,
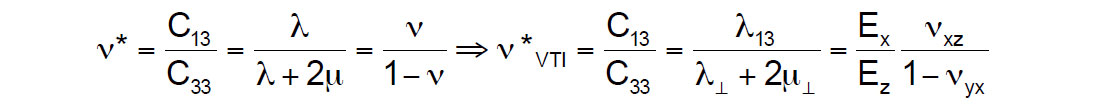
where Ex and Ez are the horizontal and vertical Young’s moduli, and νxz and νyx are the Poisson’s ratios that quantify the horizontal strain resulting from a vertical and horizontal stress respectively.
It follows from Sayers (2010) that the equality K0VTI = K0ISO + χ (or ν*VTI = ν* + χ in the notation used here) implies that
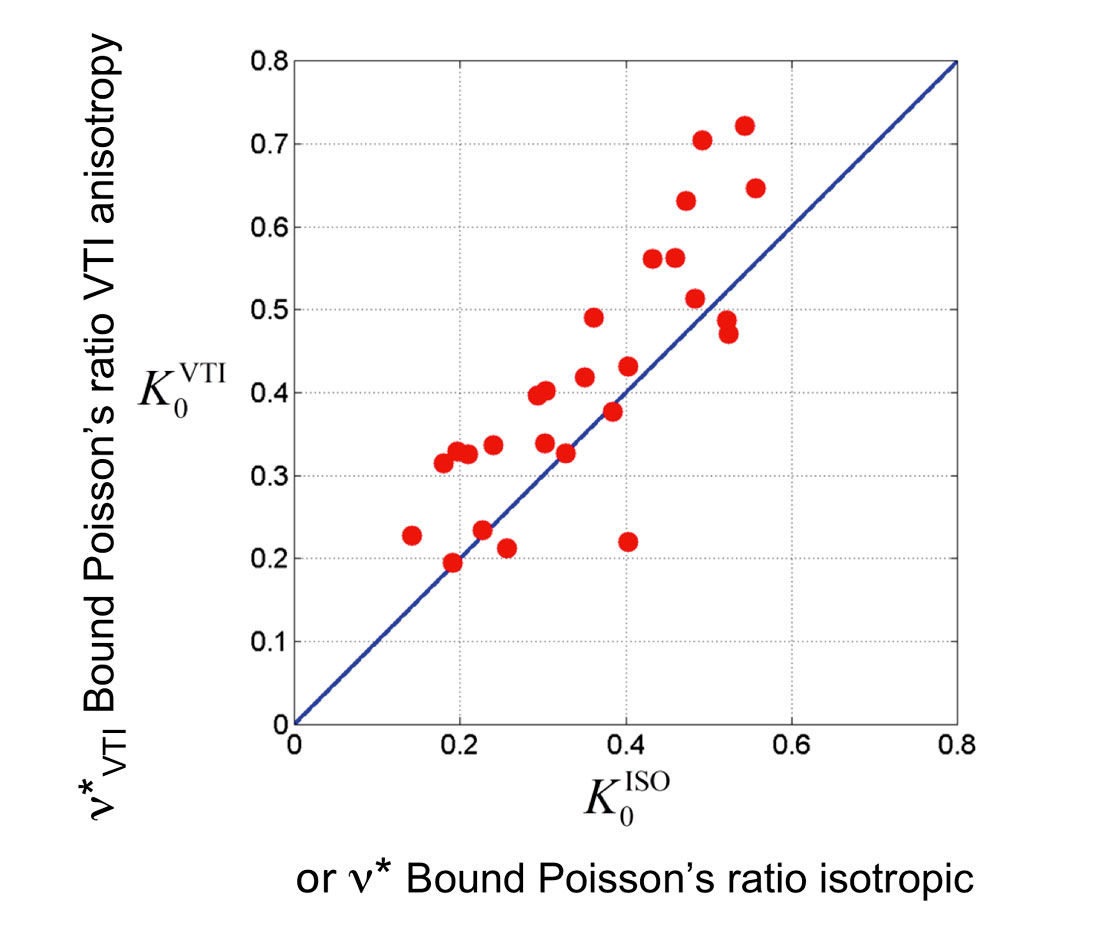
From this it is seen that the same difference between λ13 and λ⊥that controls the sign of Thomsen’s δ parameter is also the controlling factor that results in K0VTI > K0ISO (or ν*VTI > isotropic ν*) for most of the points shown in figure 2 below.
This connection to Thomsen’s δ parameter, expressed in Lamé terms from the VTI stress strain tensor matrix A’, is identical to the relationship shown by Sayers (2010) for χ, since:

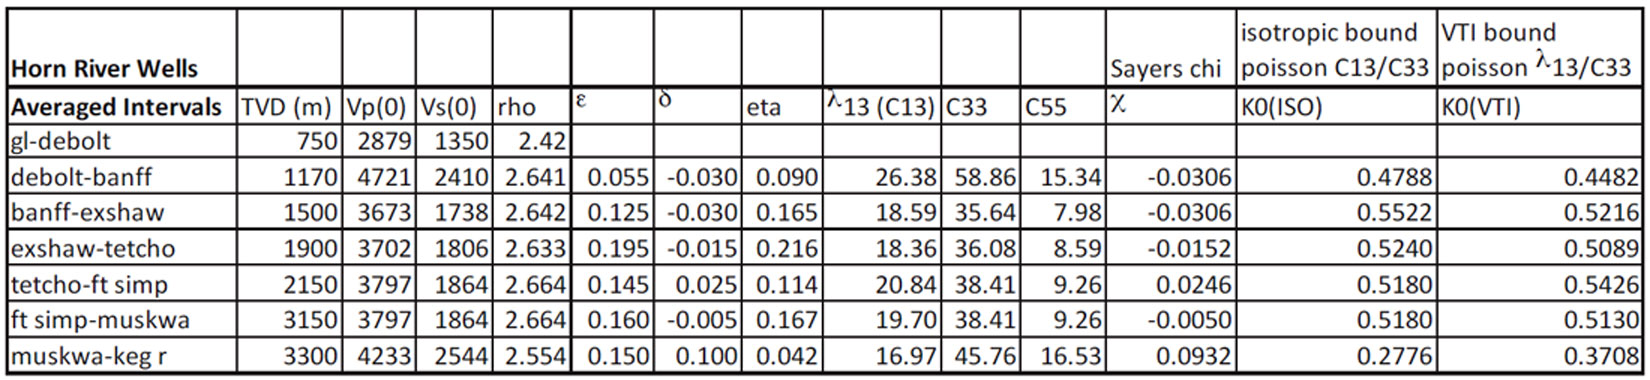
These results show that estimates of δ, or C13 and C33, from sonic logs measured in wells of different deviation, or from surface seismic can be used to calculate the increase of K0VTI over the standard, vertical log based estimated K0ISO. Table 1 shows the effect of this additional term on the standard isotropic calculation of K0, using χ values extracted from sonic logs measured in a vertical and deviated well from the Horn River (Sayers et al., 2015).
For completeness, the relevant equation from Thomsen’s 2013 SEG convention talk (mentioned above) is reproduced below and compared to a similar formulation based on the matrices and derivations above.
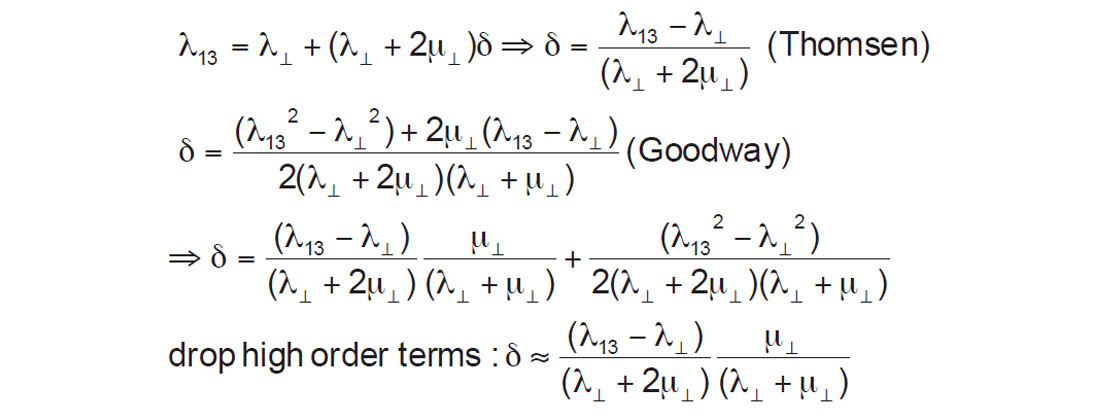
From this, one can see that Thomsen’s delta differs by a μ⊥/(λ⊥+ μ⊥) term leading to a different result for anisotropic VTI bound Poisson’s ratio ν*VTI as presented by Thomsen compared to the original Goodway formulation of δ in Lamé terms as follows:
HTI anisotropy
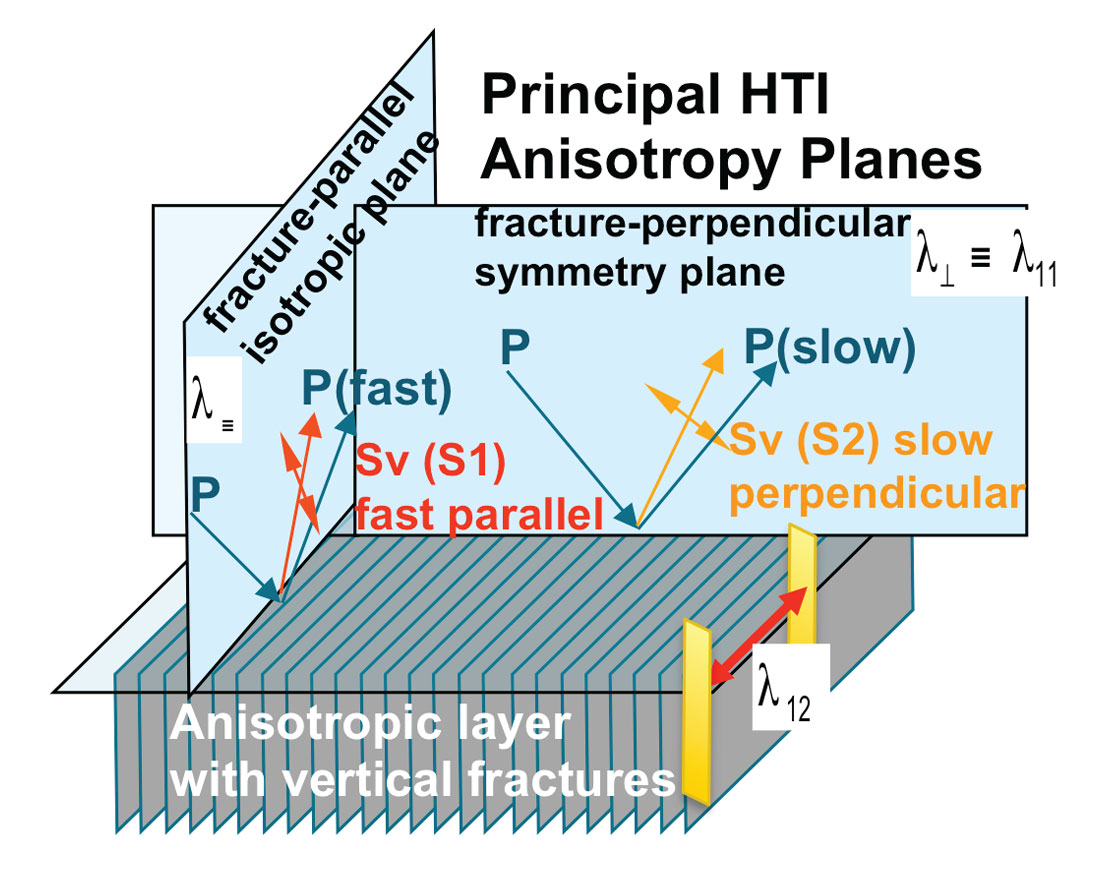
The effects of λ and μ on Minimum Horizontal Closure Stress for an anisotropic HTI model of vertical fractures is not well documented, but can be understood by analogy to the VTI case described above. Matrix B for HTI is a stiffness tensor matrix represented in Lamé terms equivalent to the VTI Matrix A’ and shown for a P-wave incident on a layer of vertical fractures in figure 3.
Matrix B
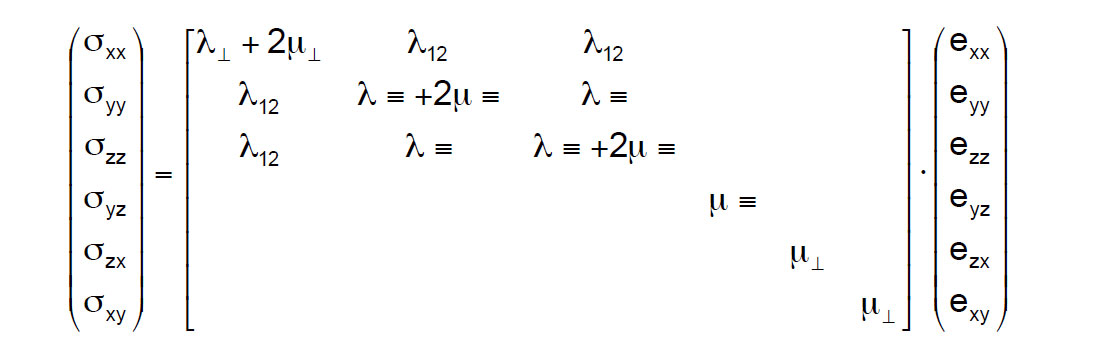
From Matrix B and by extension from the equations derived above for the VTI case, the Minimum Horizontal Closure Stress for an anisotropic HTI model of vertical fractures can be given as:

An interesting conclusion from this result, contrary to the VTI case, predicts a decrease in the bound HTI Poisson’s ratio ν*HTI over the isotropic ν* and the VTI equivalent ν*VTI, as λ≡ + 2μ≡ is greater than both isotropic λ + 2μ and the equivalent λ⊥ + 2μ⊥ for VTI, and as λ12 ≈ λ13 < λ isotropic.


Join the Conversation
Interested in starting, or contributing to a conversation about an article or issue of the RECORDER? Join our CSEG LinkedIn Group.
Share This Article