Abstract
Since their introduction in the early 1970’s, Complex Seismic Trace Attributes have gained considerable popularity, first as a convenient display form, and later, as they were incorporated with other seismically-derived measurements, they became a valid analytical tool for lithology prediction and reservoir characterization. In recent decades, over 600 papers have been published on the application of neural networks for geophysical exploration. The most recent papers have concentrated on Reservoir Characterization. While no direct relationships have been established between all of the attributes and the physical and geological characteristics of the earth, almost all of the articles describe various uses of seismic attributes as effective discriminators for the purpose of classification. In this article I will discuss the Complex Trace Attributes, their classification and their characteristics.
Introduction
The Oxford Dictionary defines an attribute as:
“A quality ascribed to any person or thing”. We have extended this definition to: “Seismic Attributes are all the information obtained from seismic data, either by direct measurements or by logical or experience-based reasoning”.
Thus, the computation and the use of attributes actually goes back to the origins of seismic exploration methods. The arrival times and dips of seismic events were used in geological structure estimation. Frank Rieber in the 1940’s introduced the Sonograms and directional reception. This method was extensively used in noise reduction and time migration. The introduction of auto-correlograms and auto-convolograms (Anstey and Newman) led to better estimates of multiple estimation and more accurate use of the subsequently developed deconvolution process. NMO velocity analysis gave better interval velocity estimates and more accurate subsurface geometries. Bright spot techniques led to gas discoveries, as well as to some failures. This was improved by the introduction of AVO technology. Each of these developments has helped our understanding of the subsurface and has reduced uncertainty and risk. Unfortunately, one of the principal failures of any of the individual techniques was our implicit dependence on it. More recently, the power of multi-attribute combinations is being recognized and successful techniques are being introduced. The attributes discussed in this paper are the outcome of the work relating to the combined use of several attributes for lithology prediction and reservoir characterization.
In this paper I will confine my comments to the complex trace attributes and their relationship to the physical properties of the earth.
Complex seismic trace attributes were introduced around 1970 as useful displays to help interpret seismic data in a qualitative way.
Balch of Marathon published the first article in the 1971 issue of Geophysics under the title of “Color Sonograms”. At the same time Nigel Anstey of Seiscom-Delta published “Seiscom 1971” and introduced the reflection strength and mean frequency attributes. He also showed color overlays of interval velocity estimates for lithological differentiation. The new attributes were computed in the manner of radio wave reception. The reflection strength was the result of a low-pass filtered, rectified seismic trace. The color overlays showed more information than was visible on the black and white seismic sections. Realizing the potential for extracting useful instantaneous information, Taner, Koehler and Anstey turned their attention to wave propagation and simple harmonic motion. This led to the recognition of the recorded signal as representing the kinetic portion of the energy flux. Based on this model, Koehler developed a method to compute the potential component from its kinetic part. Dr. Neidell suggested the use of the Hilbert transform. Koehler proceeded with the development of the frequency and time domain Hilbert transform programs, which made possible practical and economical computation of all of the complex trace attributes. This work was summarized in two basic papers by Taner et al (1979a, b). In the mid-70’s the three principal attributes were quite well established. Over the years many others have added. Chen and Sidney (1997) have defined more than 300 attributes.
The study and interpretation of seismic attributes provide us with some qualitative information of the geometry and the physical parameters of the subsurface. It has been noted that the amplitude content of seismic data is the principal factor for the determination of physical parameters, such as the acoustic impedance, reflection coefficients, velocities, absorption etc. The phase component is the principal factor in determining the shapes of the reflectors, their geometrical configurations etc. One point that must be brought out is that we define all seismically-driven parameters as Seismic Attributes. They can be velocity, amplitude, frequency, and the rate of change of any of these with respect to time or space and we have developed a classification scheme for all attributes that is based on their computational characteristics. The principal objectives of the attributes are to provide accurate and detailed information to the interpreter on structural, stratigraphic and lithological parameters of the seismic prospect..
The Classification of Attributes
Attributes can be computed from prestack or from poststack data, before or after time migration. The procedure is the same in all of these cases. Attributes can be classified in many different ways. Several authors have given their own classification. Here we give a classification based on the domain characteristics of the attributes:
Pre-Stack Attributes
Input data are CDP or image gather traces. They will have directional (azimuth) and offset related information. These computations generate huge amounts of data; hence they are not practical for initial studies. However, they contain considerable amounts of information that can be directly related to fluid content and fracture orientation. AVO, velocities and azimuthal variation of all attributes are included in this class.
Post-Stack Attributes
Stacking is an averaging process which eliminates offset and azimuth related information. Input data could be CDP stacked or migrated. One should note that time migrated data will maintain their time relationships, hence temporal variables, such as frequency, will also retain their physical dimensions. For depth migrated sections, frequency is replaced by wave number, which is a function of propagation velocity and frequency. Post-stack attributes are a more manageable approach for observing large amounts of data in initial reconnaissance investigations. For detailed studies, pre-stack attributes may be incorporated.
Attributes may be further classified by their computational characteristics:
Instantaneous Attributes
Instantaneous attributes are computed sample by sample, and represent instantaneous variations of various parameters. Instantaneous values of attributes such as trace envelope, its derivatives, frequency and phase may be determined from complex traces.
Wavelet Attributes
This class comprises those instantaneous attributes that are computed at the peak of the trace envelope and have a direct relationship to the Fourier transform of the wavelet in the vicinity of the envelope peak. For example, instantaneous frequency at the peak of the envelope is equal to the mean frequency of the wavelet amplitude spectrum. Instantaneous phase corresponds to the intercept phase of the wavelet. This attribute is also called the “response attribute”. (Bodine, 1984).
These attributes may be sub-classified on the basis of the relationship to the geology:
Physical Attributes
Physical attributes relate to physical qualities and quantities. The magnitude of the trace envelope is proportional to the acoustic impedance contrast; frequencies relate to bed thickness, wave scattering and absorption. Instantaneous and average velocities directly relate to rock properties. Consequently, these attributes are mostly used for lithological classification and reservoir characterization.
Geometrical Attributes
Geometrical attributes describe the spatial and temporal relationship of all other attributes. Lateral continuity measured by semblance is a good indicator of bedding similarity as well as discontinuity. Bedding dips and curvatures give depositional information. Geometrical attributes are also of use for stratigraphic interpretation since they define event characteristics and their spatial relationships, and may be used to quantify features that directly assist in the recognition of depositional patterns, and related lithology.
Most of the attributes, instantaneous or wavelet, are a function of the characteristics of the reflected seismic wavelet. That is, we consider the interfaces between two beds. However, velocity and absorption are measured as quantities occurring between two interfaces, or within a bed.
Therefore, we can further sub-divide the attributes into two categories, as follows:
Reflective Attributes
Attributes corresponding to the characteristics of interfaces. All instantaneous and wavelet attributes can be included under this category. Pre-stack attributes such as AVO are also reflective attributes, since AVO studies the angle dependent reflection response of an interface.
Transmissive Attributes
Transmissive attributes relate to the characteristics of a bed between two interfaces. Interval, RMS and average velocities, Q, absorption and dispersion come under this category.
Because individual attributes may be representative of several possible conditions we attempt to minimize this inherent uncertainty, or non-uniqueness, by combining multiple attributes in a logical fashion. Individual attributes measuring only one quantity are termed “Primitive” attributes. These primitive attributes may be logically, statistically or mathematically combined to form “Hybrid” attributes. The most common tool for performing this combination is through the use of Artificial Neural Networks.
Some Basic Attribute Characteristics
The Trace Envelope is a physical attribute and it can be used as an effective discriminator for the following characteristics:
- Mainly represents the acoustic impedance contrast, hence reflectivity,
- Bright spots, possible gas accumulation,
- Sequence boundaries,
- Thin-bed tuning effects
- Major changes in depositional environment,
- Spatial correlation to porosity and other lithologic variations,
- Indicates the group, rather than phase component of the seismic wave propagation.
The First Derivative of the Envelope (time rate of change of the envelope) shows the variation of the energy of the reflected events. Events with a sharp relative rise also imply a wider bandwidth, hence less absorption effects. This attribute is also a physical attribute and it can be used to detect possible fracturing and absorption effects.
The Second Derivative of the Envelope provides a measure of the sharpness of the envelope peak. It can be used to identify all reflecting interfaces within the seismic bandwidth.
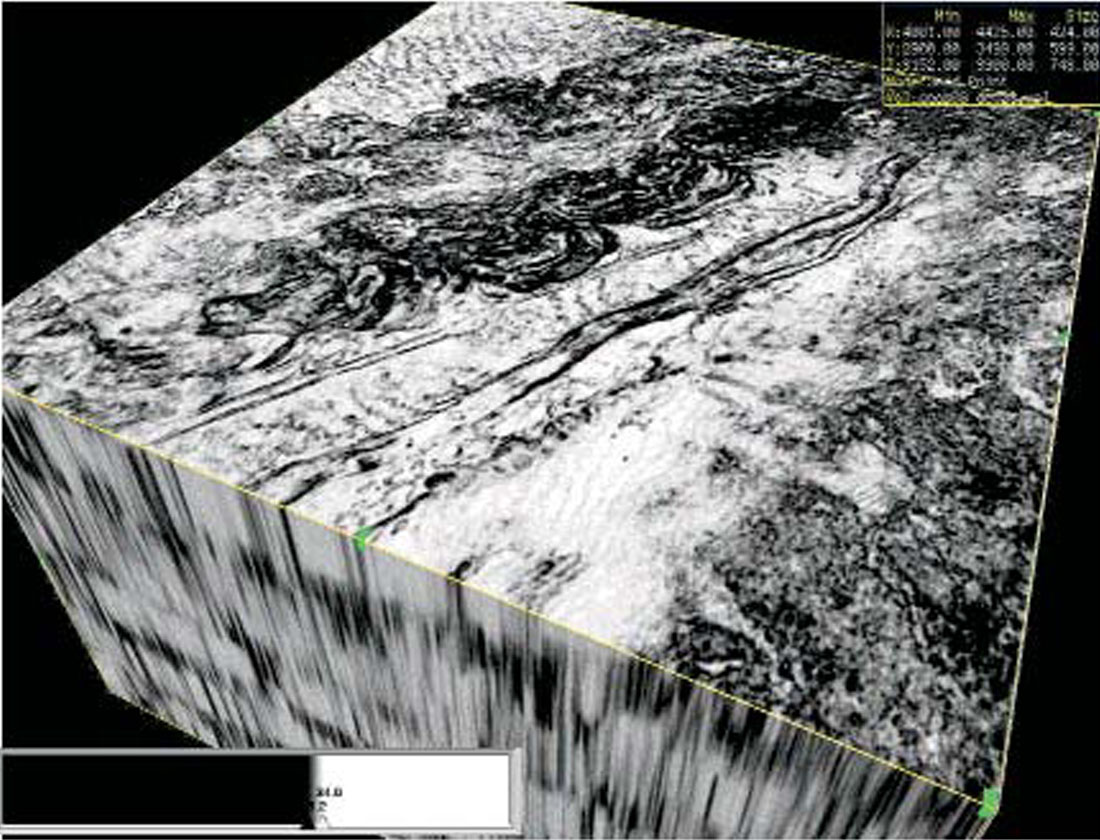
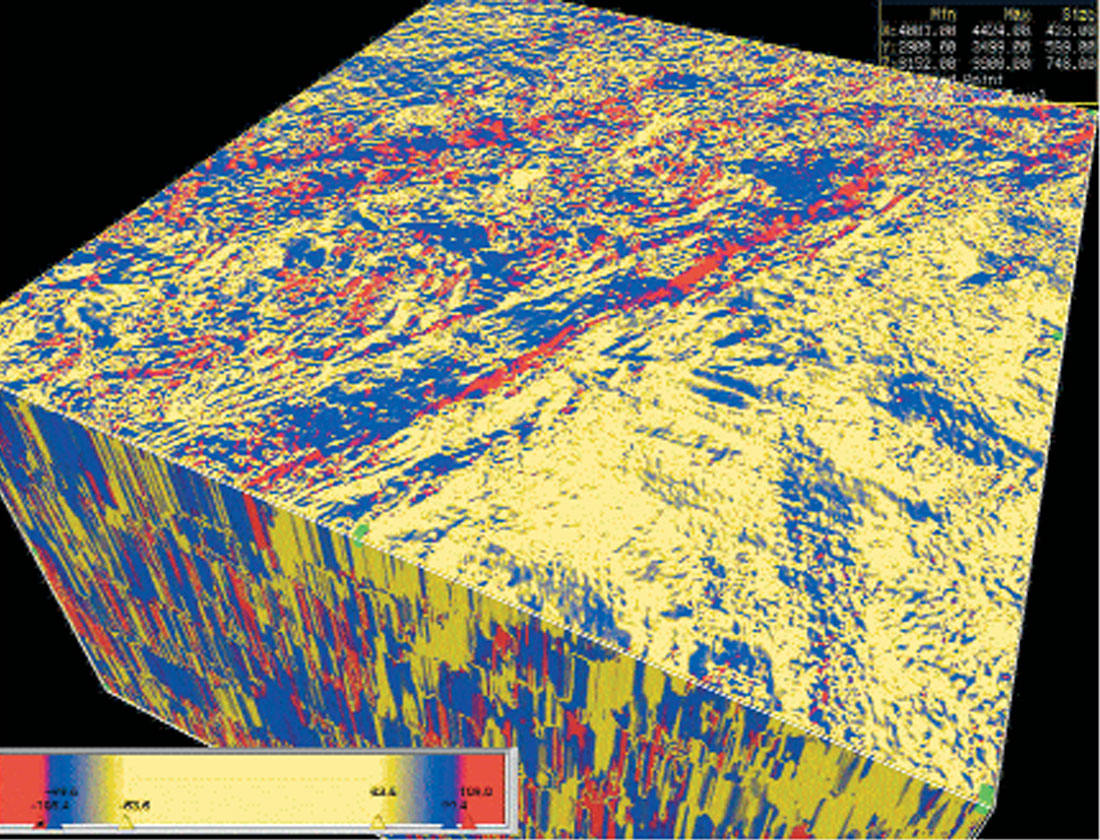
Instantaneous Phase. Because wave fronts are defined as lines of constant phase, the phase attribute is also a physical attribute and can be effectively used as a discriminator for geometrical shape classifications: Figure 1 shows a 3-D section display of original seismic data. Figure 2 is the corresponding instantaneous phase display. Instantaneous phase is:
- Good indicator of lateral continuity,
- Relates to the phase component of wave-propagation.
- Used to compute the phase velocity,
- Devoid of amplitude information, hence all events are represented,
- Detailed visualization of stratigraphic elements.
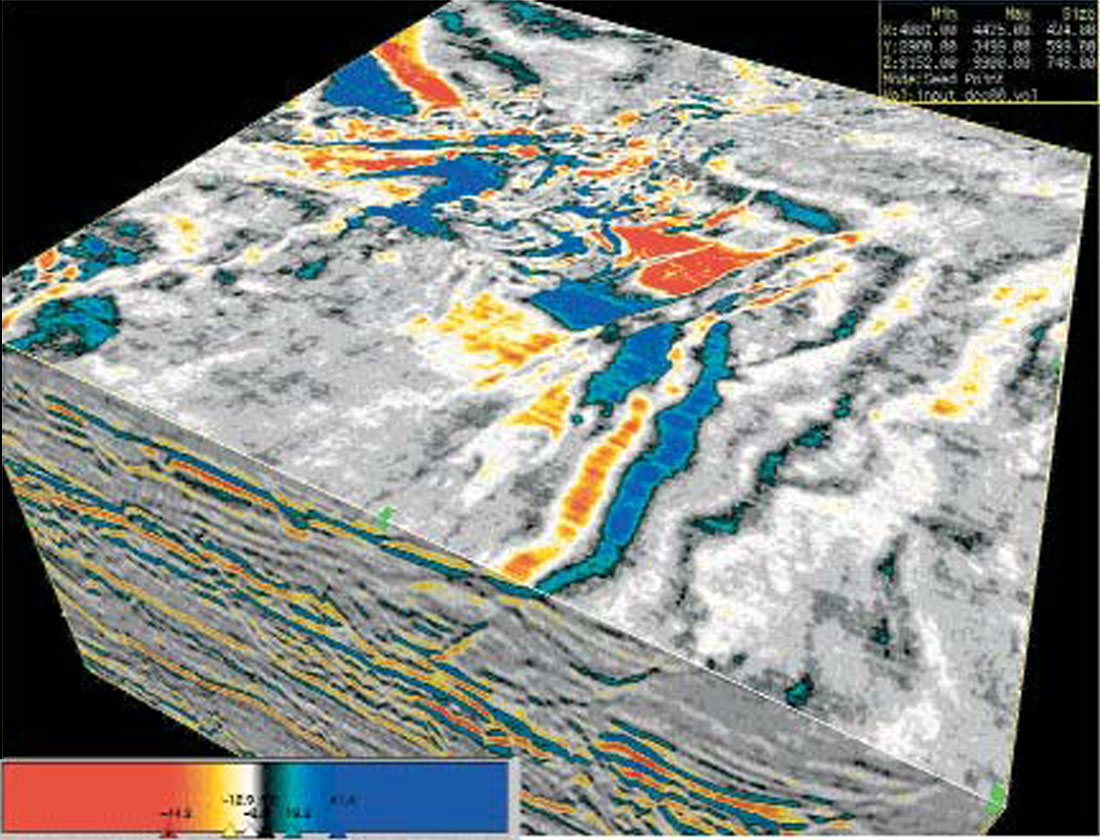
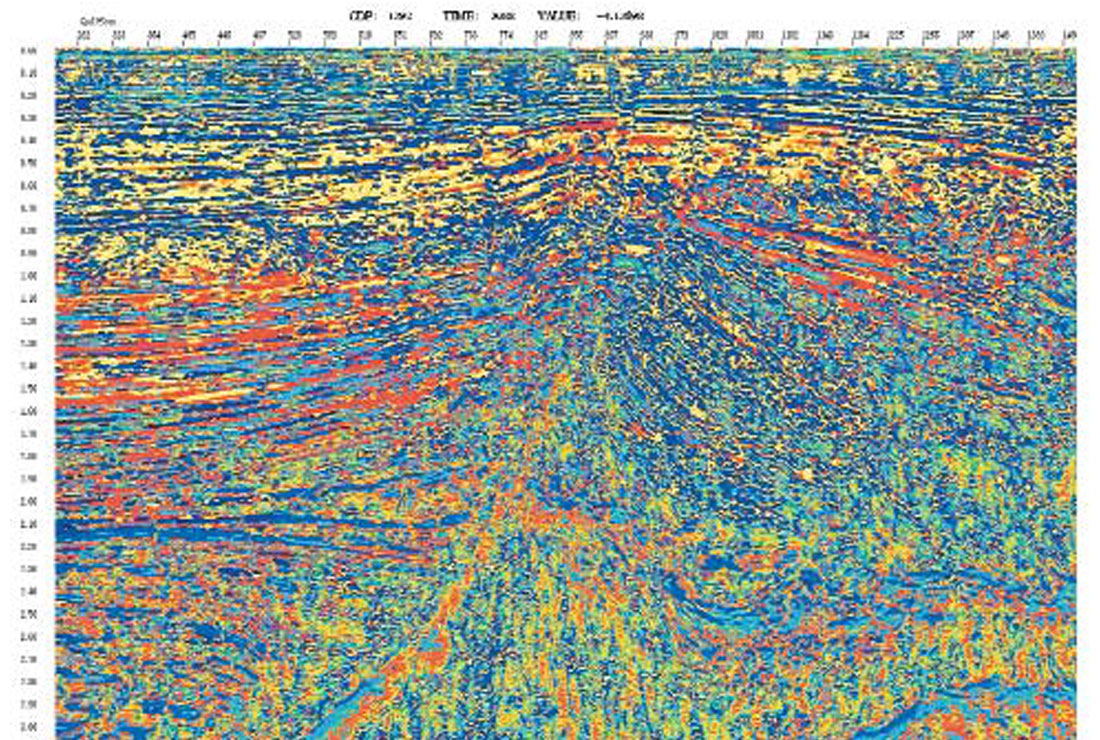
Instantaneous Frequency. The computation of instantaneous Frequency as the time derivative of phase, and its meaning have been the subject of a number of papers. (Cohen, 1995, Barnes, 1991, 1992) It has been shown that the instantaneous frequency attribute relates to the centroid of the power spectrum of the seismic wavelet. (Figure 3). The instantaneous frequency attribute responds to both wave propagation effects and depositional characteristics, hence it is a physical attribute and can be used as an effective discriminator. Its uses include:
- Hydrocarbon indicator by low frequency anomaly. This effect is sometimes accentuated by unconsolidated sands due to the oil content of the pores.
- Fracture zone indicator, since fractures may appear as lower frequency zones.
- Bed thickness indicator. Higher frequencies indicate sharp interfaces such as exhibited by thinly laminated shales, lower frequencies are indicative of more massive bedding geometries, e.g. sand-prone lithologies.
Another piece of information we can extract from the seismic data are the locations where instantaneous frequencies jump or exhibit a negative sign. These sign reversals are caused by closely-arriving reflected wavelets. Therefore, the time derivative of the phase function will contain the indicators for thin beds, in the form of large variations of instantaneous frequency. Its smooth variation will relate to bedding characteristics.
A Gabor-Morlet type joint Time-Frequency analysis allows us to study frequency-varying attributes. Instantaneous spectra, spectral ratio and phase differences provide measurements for bed thickness variation, absorption and dispersion estimates. (Gabor, 1946, Morlet, et al 1982, Cohen, 1995).
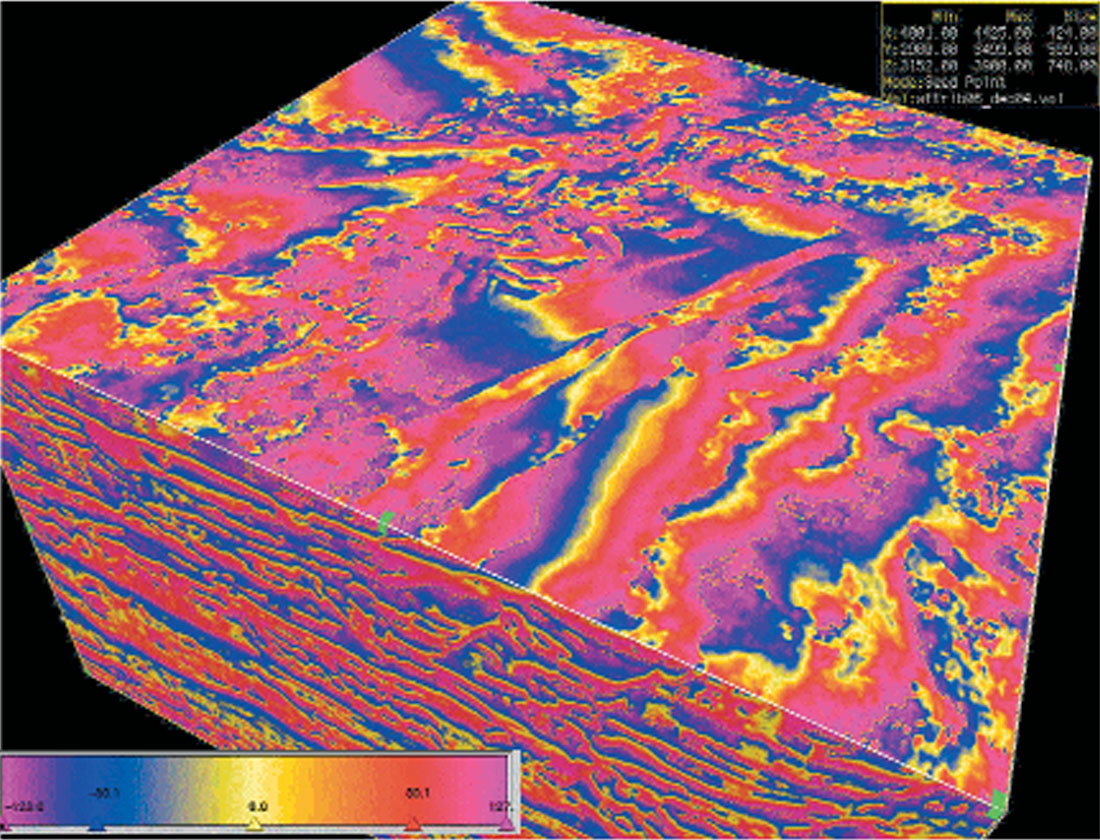
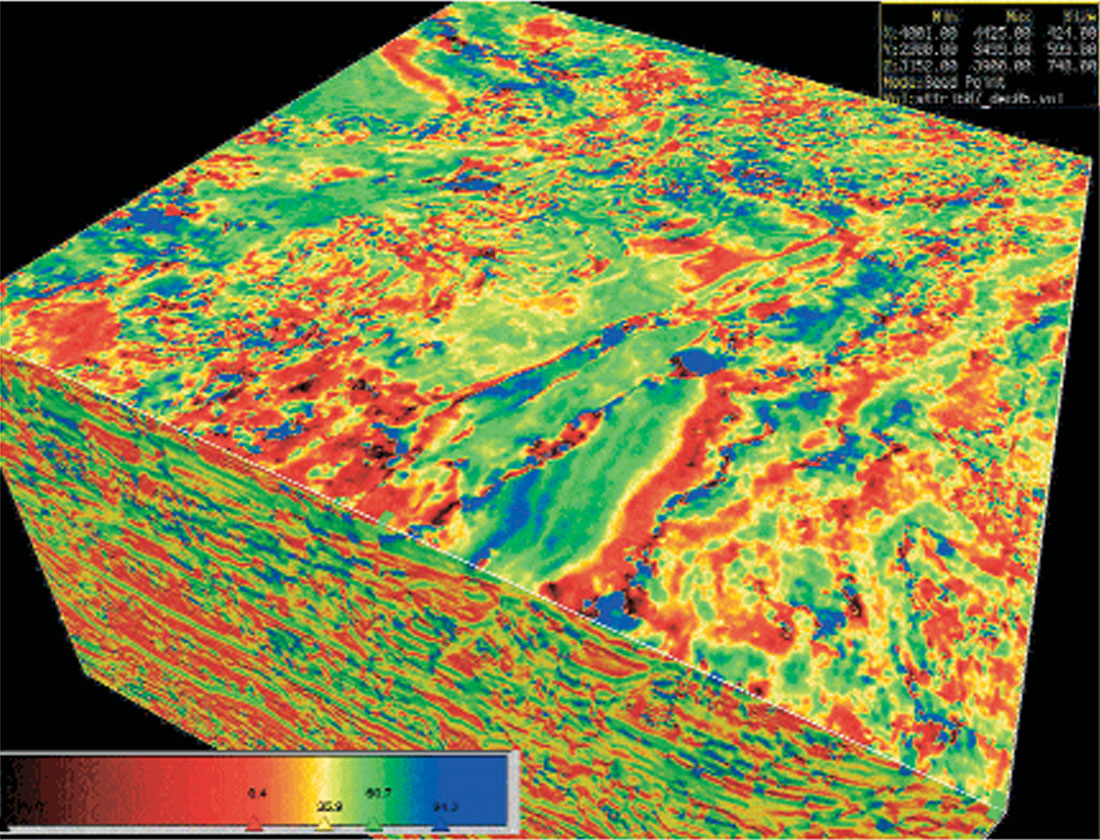
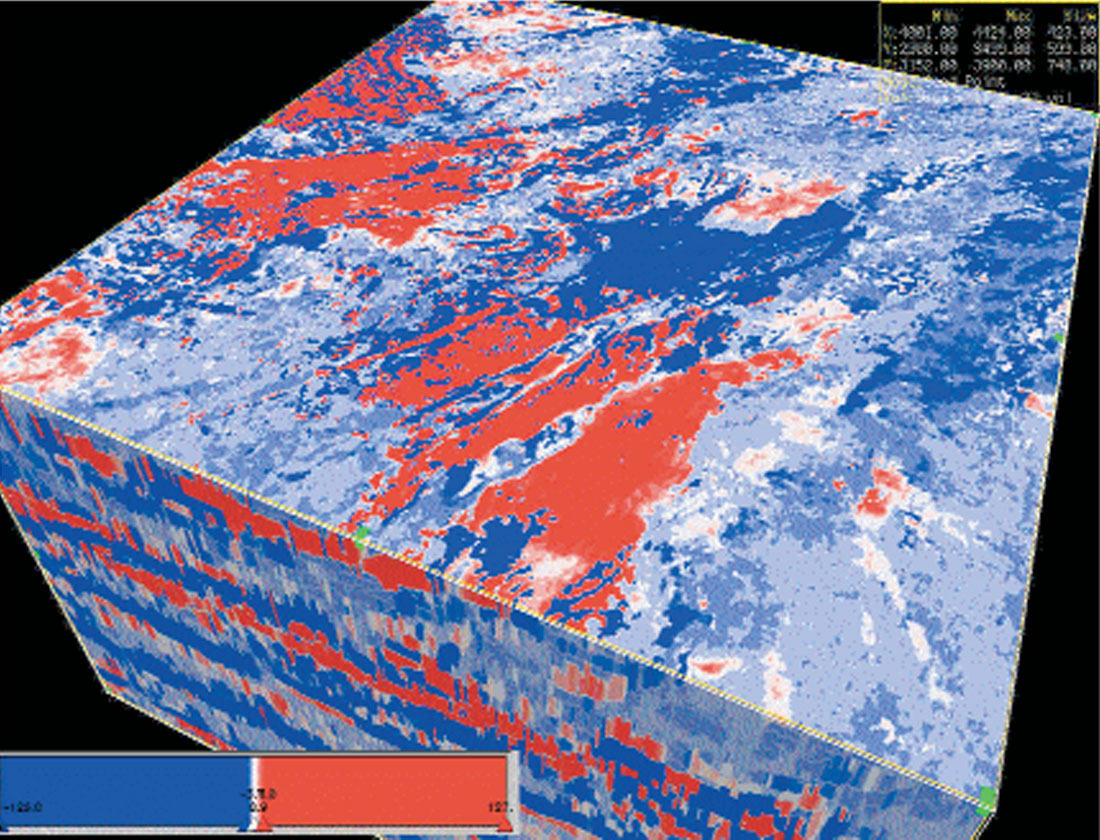
Figure 4 shows one of the geometrical attributes which measure the lateral continuity of events, by computing semblance. The lighter colors show a high degree of continuity. Another geometrical attribute, instantaneous dip azimuth is shown in Figure 5. The colors indicate various dip azimuths as measured from North. A wavelet attribute example, the apparent polarity is shown in Figure 6. Red shows the positive and blue shows the negative apparent polarities.
Classification and Calibration Methods
Attribute classification helps define the attribute combinations to be used for optimum lithology and fluid prediction and reservoir classification. As we have seen above, there are many different ways of computation and many different classes of attributes available. Their utilization in quantitative interpretation is the main proof of their significance. At this time, we have defined four different methods of classification and calibration. Here we provide a short description of the methods involved. I have provided some useful references for readers requiring more detailed information.
Knowledge-based Expert systems
This method uses knowledge-based combinations and calibrations of groups of attributes with fuzzy logic to reflect the interpreter’s experience. This type of classification can be used for large data sets for a quick “look-see” type of interpretation, or when looking for a specific condition.
Statistics of Attributes, Geostatistics
These represent more conventional and well-established methods. Cross plotting, with linear and various non-linear scales, measuring various statistics has been used as a viable tool for a number of years. Interpolation and extrapolation between and beyond wells have been improved by the introduction of Kriging. Incorporating the seismic and other soft information led to the development of Co-Kriging. However, these methods strongly depend on the availability of properly sampled data sets.
Linear Discrimination Analysis and PCA
Principal Component Analysis (PCA) shows the principal projections where the data has the largest variance, hence the best possible discrimination. Linear discrimination works satisfactorily when two classes are involved and the classification boundary is not very complicated. However, PCA is a very useful analytical tool to determine the most important attribute components to be used in the non-linear discrimination using Neural Networks.
Unsupervised Classification and Calibration
This type of approach seeks structure in the data. Kohonen’s Self-Organizing Map (K-SOM) method is one the most practical and commonly used methods in the Neural Network field. A dataset may be defined by any combination of attributes and KSOM generates topologically related clusters. If the selected attributes are geometrical, then the clusters are based on geometrical variation. The method generates coordinates of cluster centers with given attribute coordinates. However, it does not relate the cluster to any physical or reservoir condition. This has to be done in the calibration stage.
Supervised Training of, and Classification by, Neural Networks
There have been a number of Neural Networks developed within the last couple of decades. Supervised trainable networks are used in many different fields. In this case, the user provides some examples for the neural network to learn, and then the network is tested with another dataset to check the success of training. One important point to remember is that the network, if trained properly, will recognize and correctly classify only those cases included in the training set. Any new conditions not included in the training set will be misclassified or not recognized. The feed forward, fully-connected Multi-Layer Perceptron (MLP), Learning Vector Quantization (LVQ), Probabilistic Neural Networks (PNN), and Radial Basis Function Networks (RBF) are some of the most widely used networks.
Each of the methods has its advantages and limitations.
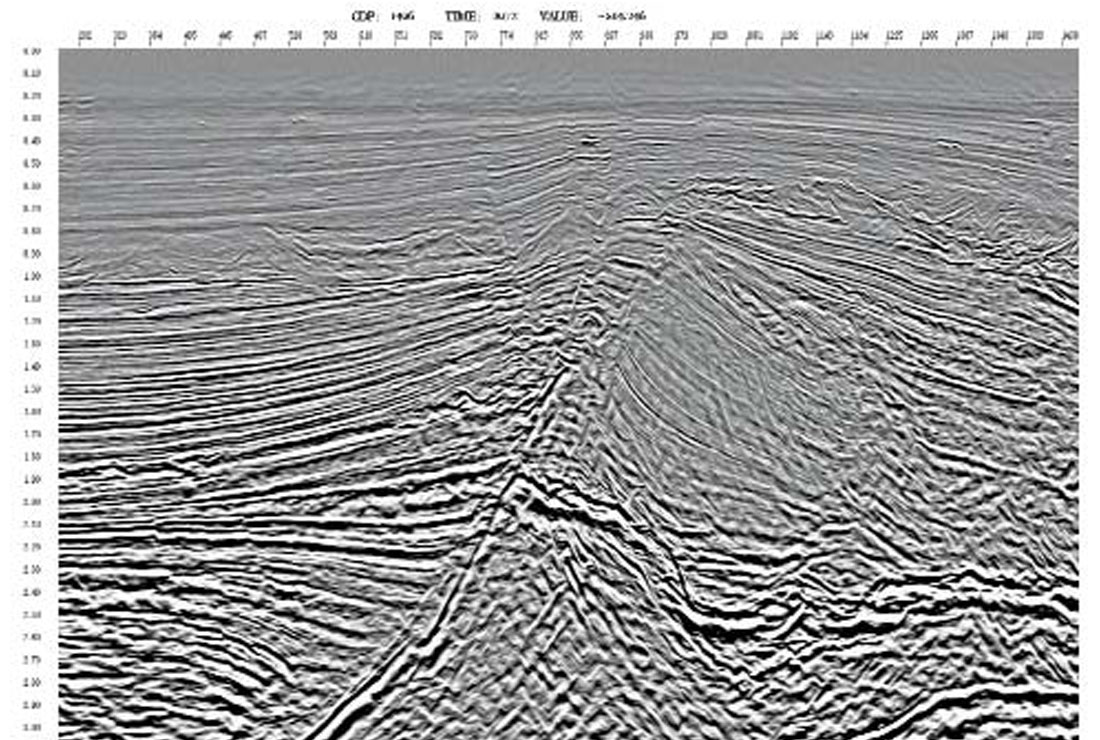
An unsupervised classification example is given in Figures 7 and 8. Figure 7 shows the seismic cross section with clastic deposition above a salt pillow. A combination of physical and geometrical attributes were used as input for Self Organizing Map clustering. The results are shown on Figure 8. Similar colors are indicative of like lithological estimates.
Conclusion
Complex seismic trace attributes have become important qualitative and quantitative measures for geophysical exploration. Attributes have made it possible to define seismic data in a multidimensional form and neural network technology enables us to unravel the complex nonlinear relationships between seismic data and rock and fluid properties. Recently published case histories clearly show that multiple attributes overcome the failures associated with single attribute usage. Combined attributes translated by neural networks are becoming principal tools for lithology prediction and reservoir characterization. It is not too unreasonable to expect considerable improvement in the accuracy of predictions in the near future.

Acknowledgements
I would like to thank Magic Earth l.l.c. for the use of GeoProbe visualization interpretation system.


Join the Conversation
Interested in starting, or contributing to a conversation about an article or issue of the RECORDER? Join our CSEG LinkedIn Group.
Share This Article