Introduction
The capability of providing regional information cheaply on the structure of sedimentary basins makes gravity and magnetic maps, in conjunction with seismic and geological information, potentially powerful tools in hydrocarbon exploration.
In the Phanerozoic rocks of the Alberta Basin, significant magnetization is rare, and most magnetic anomalies are sourced in the underlying Precambrian crystalline basement. Small anomalies may nevertheless occur due to local intrasedimentary magnetite-rich placers, secondary hydrothermal mineralization, and minor igneous rocks above the basement. Whereas magnetic anomalies in the Alberta Basin mostly reflect basement structure and composition, gravity anomaly maps reflect lateral density variations in both the crystalline basement and the sedimentary cover.
With the shift of exploration focus in mature hydrocarbon provinces like the Alberta Basin to the search for subtle traps, a need has arisen to develop predictive techniques to help locate such elusive targets. High cost requires limiting seismic surveys to the most prospective areas. Consistent with growing evidence that some hydrocarbon traps may be systematically controlled by networks of steep faults in the basement (e.g., Jones 1980; Greggs and Greggs 1989; Misra et al. 1991; Gay 1994), we offer a new and relatively cheap regional approach to their prediction using horizontal-gradient vector (HGY) maps of gravity and magnetic data.
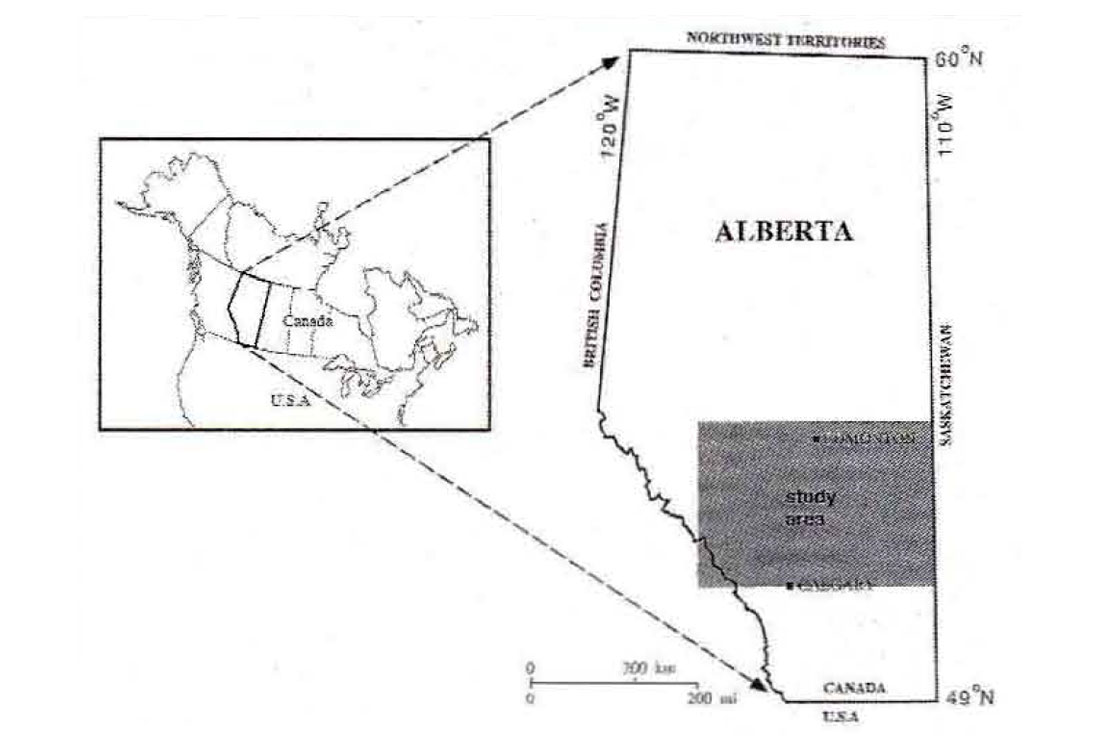
Many obvious magnetic anomalies probably represent Early Proterozoic orogenic structures in the basement, which are predominantly ductile and are not likely to have been reactivated in the Phanerozoic. To find post-orogenic, brittle, steep faults that could have been active in the Phanerozoic, we use subtle lineaments in gravity and magnetic maps. The HGV method is one of a number of anomaly enhancement techniques that we have used successfully to extract these lineaments. We outline the HGV method and illustrate its effectiveness in detecting lineaments that may correspond to basement faults in the Alberta Basin, and then relate possible faults networks in the crystalline basement to the distribution of Phanerozoic hydrocarbon traps. The study area in central Alberta (Figure 1) contains large oil and gas pools and is extensively drilled, as well as having regional coverage by Geological Survey of Canada gravity and magnetic data. The usual magnetic flight-line spacing in Alberta is 800 to 1500 m, whereas the gravity data have been recorded at little more than one station per township. These data can be obtained for a nominal cost.
Based on the available coverage, the gravity data are gridded at a 5-km interval, and the magnetic data at 2 km. With a depth to basement around 2-3 km in the study area, a 2-km grid of the aeromagnetic data is well suited to sample anomalies sourced at the basement level. The available gravity data were recorded, and therefore resampled, more sparsely, with a corresponding loss of resolution.
The horizontal-gradient vector method of gravity and magnetic anomaly enhancement
Horizontal-gradient techniques are among the most intuitive derivative methods. Vertical geological boundaries separating two homogeneous blocks give rise to homogeneous blocks give rise to horizontal gradients in gravity and pseudogravity (magnetic) data that are steepest directly over those boundaries. Because western Canada lies at a high magnetic latitude (inclination> 70°), it can also be assumed fairly realistically that this is also roughly true for aeromagnetic data, even without application of the pseudogravity transform or reduction to the pole.
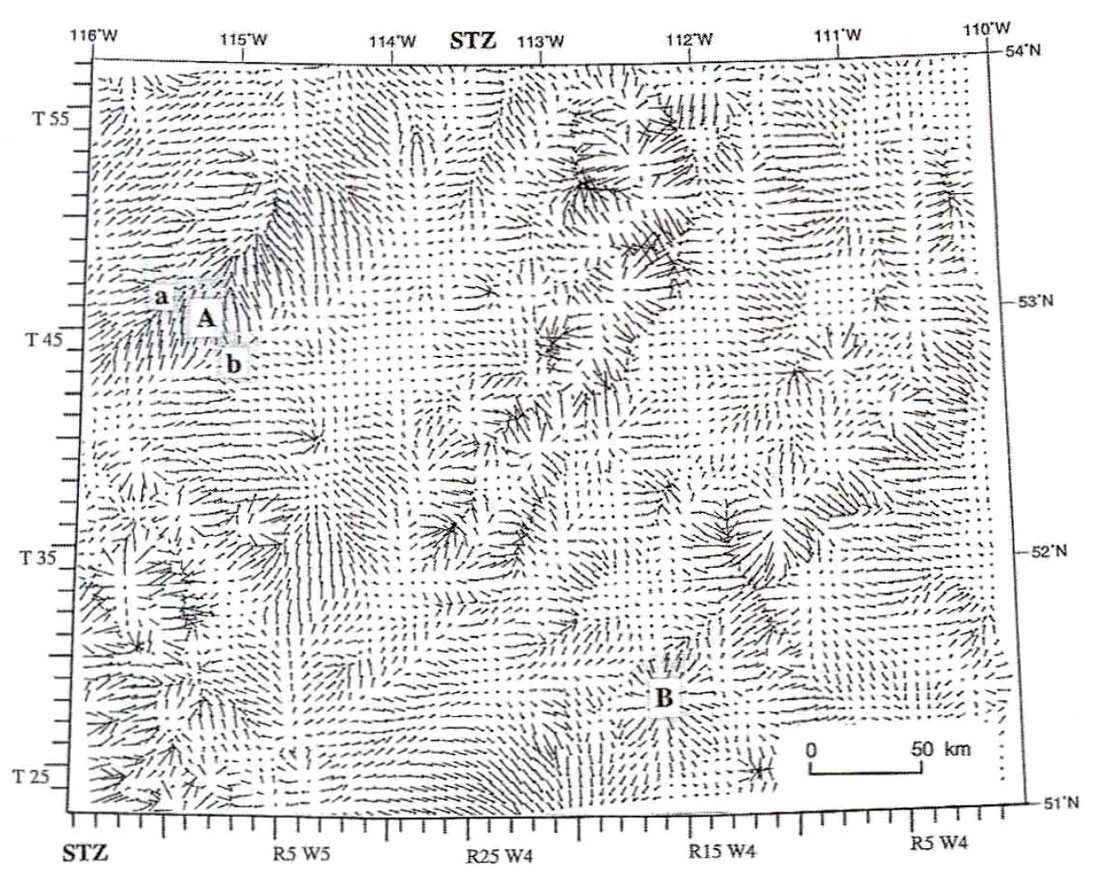
Previous workers generally dealt with the magnitude of the horizontal gradient only, i.e. a scalar quantity, and maps were often generated simply by contouring or colour coding gradient magnitudes (e.g. Sharpton et al. 1987). But the horizontal gradient, being a two-component vector quantity, possesses direction as well as magnitude. Thinking in terms of elevation (Lyatsky et al. 1992) instead of field strength, the direction of the gradient is that of steepest change of elevation, which is perpendicular to elevation contours. The gradient magnitude is greatest where the contour spacing is least, i.e. where the ascent or descent is steepest, and vice versa. At any point on a map, a horizontal-gradient vector (HGV) can be displayed as an arrow whose orientation represents the direction of the gradient and whose length is proportional to the magnitude of the gradient. In our scheme, arrows originate at grid nodes and point away from local maxima in the potential field. Detailed discussions of our HGV computation methods were provided by Lyatsky et al, (1992) and Thurston and Brown (1994).
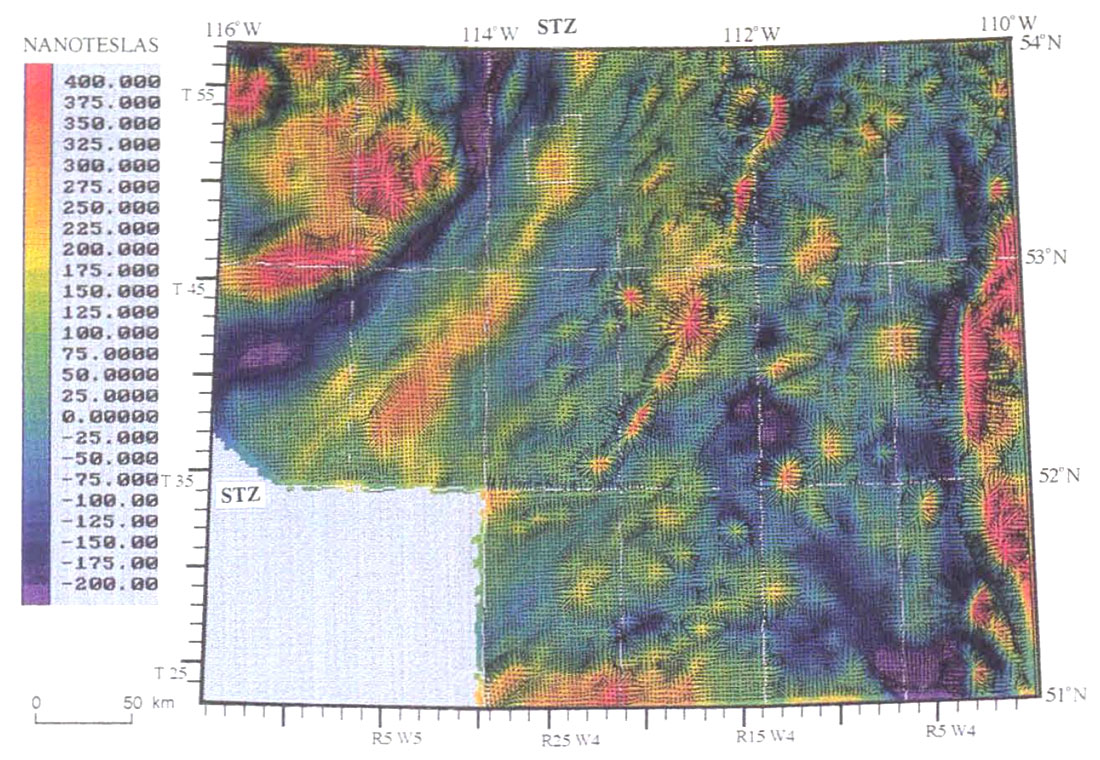
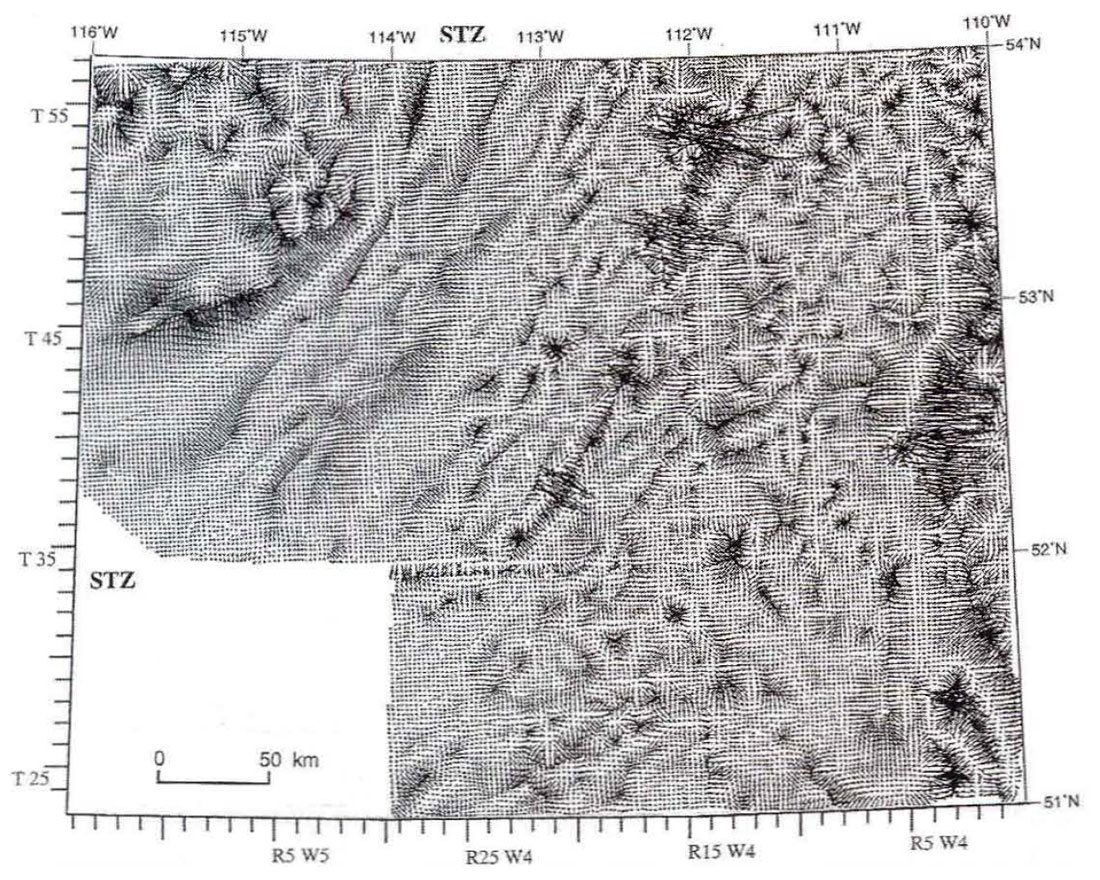
We have generated HGV maps for both aeromagnetic and gravity data (Figures 2 to 5) in central Alberta. The horizontal gradient is calculated by estimating the parameters of a best-fit third-order polynomial to a window of 5 x 5 grid points centered on the node for which the gradient is being computed. Arrow lengths are normalized and linearly scaled for map production. Vector arrows are longest, and the density of shading due to plotted arrows greatest, in zones of steepest ascent or descent.
Alberta Basin: geological background
The Alberta Basin consists of a predominantly marine, carbonate-shale Cambrian to mid-Jurassic succession, and a mid-Jurassic to Holocene succession of mainly continental clastic rocks. Both packages contain numerous oil and gas accumulations. Two recent volumes, The Geological Atlas of the Western Canada Sedimentary Basin (Mossop and Shetsen 1994) and The Western Canada Sedimentary Basin, A Case History (Ricketts 1989), provide comprehensive overviews of the basin's geological history and structure. Earlier publications have generally underestimated basement control on basin development (see Lyatsky 1994 for a recent review), but more recently, the relationship between basement faults and the geology of various basins is receiving considerable attention (e.g. Greggs and Greggs 1989; Schmidt et al. 1993).
In the Alberta Basin, sedimentation at most times appears to have been strongly influenced by regional epeirogenic movements (Greggs and Greggs 1989). More local influences, such as those outlined by Sikabonyi and Rodgers (1959), Wright et al. (1994) and others, were provided by recurrent movements on basement faults. However, when basement controls on local basin structure are acknowledged, it is usually done in fairly general terms. Allen and Allen (1990) suggested that faults propagate steeply upsection through sedimentary cover by episodic reactivation induced by changes in the regional stress field. Steep faults bounding rigid blocks may have accommodated alternating pulses of uplift, subsidence, tilting, or strike-slip motion (Edwards and Brown 1993). Many workers (e.g. Jones 1980) infer that minor vertical faults, difficult to detect with seismic data, may have affected depositional paleoenvironments and controlled subsequent rock deformation and alteration.
Fault-block interpretation of potential-field data
Orthogonal geophysical lineament patterns
Lineaments are apparent in both magnetic and gravity HGY maps (Figures 2 to 5), forming a primary NW and NE conjugate set. Other trends, such as N-S and E-W, also appear. This pattern emerges regardless of data-point grid orientation, implying that this is not a processing artifact.
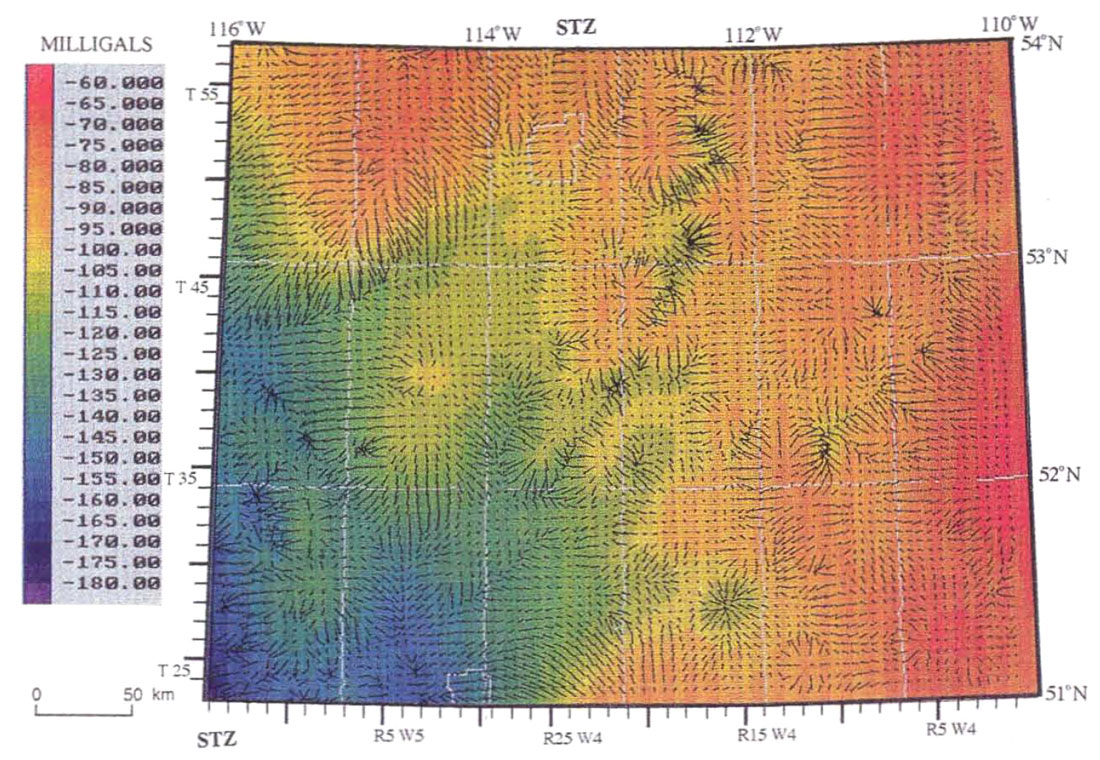
The NW/ NE rectangular grid of orthogonal lineaments is well expressed in the gravity and magnetic HGY maps (Figures 2 to 5). Some blocks are defined by arrows converging or diverging at their perimeters. Gravity domains, defined by consistent orientations and lengths of arrows, are bounded by sharp, commonly linear breaks in the arrow pattern. Where HGY gravity arrows within a domain have a consistent orientation, one interpretation is that the block may be tilted in the direction of the "downhill" arrows.
The "tilted" HGY gravity domain labelled A in Figure 5 is tens of kilometers long. Breaks in the vector pattern on its flanks mark its boundaries (such as those labelled a and b). Suggesting a tilt direction, arrows in this domain point south in "downhill" maps. In feature B, the HGY arrows radiate from its center in the "uphill" map and converge towards it in the "downhill" one. Such a local gravity low can arise due to the presence of a granitic stock in the basement.
Differences between gravity and magnetic maps occur because these maps reflect different physical rock properties, and faults may affect variations of these properties differently. Some faults may have no potential-field signatures at all, but have still affected the sedimentary cover. On the other hand, mineralization of fracture zones by fluids may results in strong magnetic signatures, even without significant fault displacement. The dipolar nature of the magnetic field complicates the anomaly pattern further. Another factor is the unequal gravity and magnetic grid spacing: the magnetic anomalies are more densely recorded and sampled.
Geological confirmation of fault interpretation
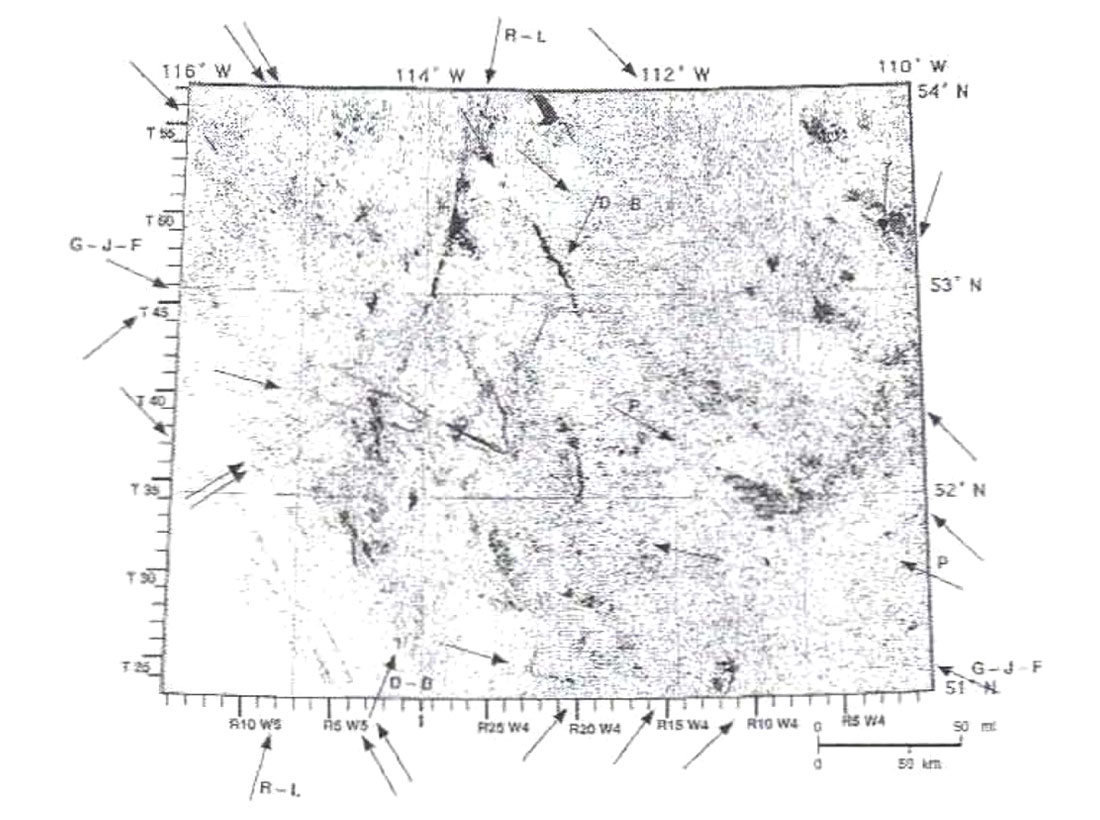
Some linear features in magnetic and gravity maps of western Canada are broad and regional. One such feature in central Alberta trends NE to NNE (Figures 2 to 5) and coincides with the extension of the Snowbird Tectonic Zone (STZ) from the Canadian Shield. There, geological field mapping has revealed the STZ consists of a number of dip-slip and strike-slip shear sub-zones of Late Archean age (Hanmer et al. 1994), forming part of a complex transcontinental crustal boundary. This geological check confirms the interpretation of some potential-field lineaments as faults.
Aeromagnetic maps in central Alberta (Figures 2, 4) show the STZ is represented by several parallel strands, each in turn consisting of a number of smaller lineaments. This anomaly zone is broad and complex, with an overall width of 50-75 km. Within it, the regional orthogonal arrangement of magnetic anomalies is poorly expressed, and only relatively weak lineaments oriented NW-SE and E-W cut across this NE/N E-trending zone. The STZ is marked by a NE- to NNE-trending positive Bouguer gravity anomaly in Figure 3, obscured towards the south-west by the strong gravity low over the eastern Cordillera. In the HGV gravity maps (Figures 3, 5), this zone changes from a set of several parallel lineament strands with a total width of about 50 km in the north-east, through a complex centra l section, to a single linear element in the south-west. This southern STZ strand intersects the Cordilleran deformational front and continues into the Foothills and Front Ranges of the Canadian Cordillera.
The fact that different strands of the STZ are revealed differently in gravity and magnetic maps illustrates the need for joint interpretation of these data.
Basement fault control on Phanerozoic stratigraphy
Productive reservoir trends in central Alberta
Reservoir trends in central Alberta are indirectly indicated in the map in Figure 6, which shows all wells penetrating at least the shallow, mid-Cretaceous Base of Fish Scales Zone, as of February 1995 (cp. Misra el al. 1991). On viewing this map obliquely, like a seismic section, and slowly rotating it, numerous well alignments become apparent. Since most local targets were defined independently of one another, such trends reflect genuine alignments of reservoirs, perhaps along faults. Some of these suspected faults are reflected in magnetic and gravity maps.
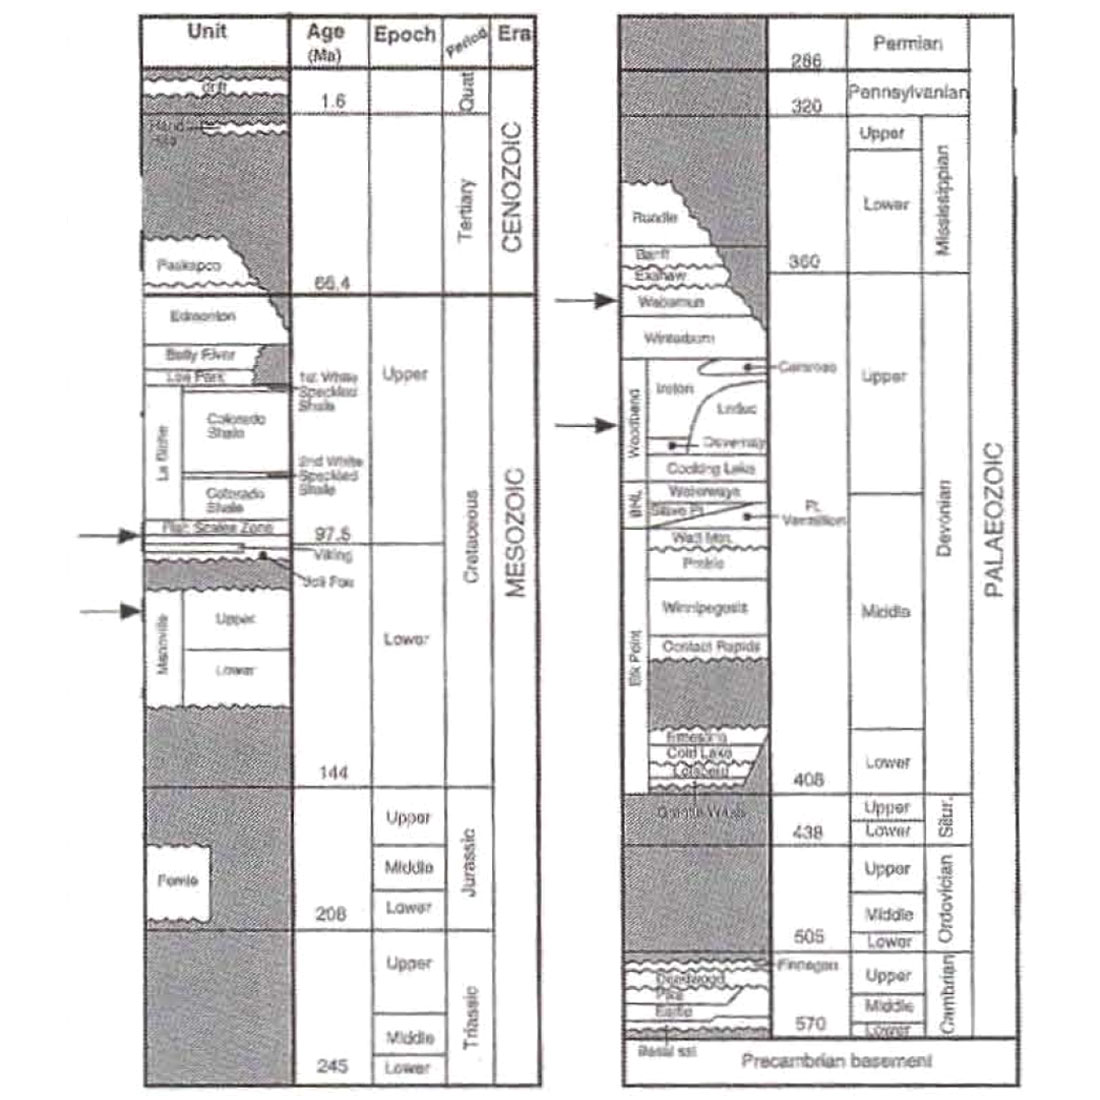
To better assess the impact of basement faults on basin evolution, several Phanerozoic stratigraphic units are briefly considered . They are marked in the stratigraphic column in Figure 7. Activity of different faults at different times appears to have affected many productive intervals in the Alberta Basin.
Devonian Leduc reef trends in relation to basement faults
The Upper Devonian Leduc Formation in central Alberta (Figure 8) contains elongated reefal complexes on a broad carbonate platform (Switzer et al. 1994). These reefs, encased in Ireton shale, have been prolific oil and gas producers. Most reef complexes and embayments have a distinct NNE-orientation.
A number of HGV lineaments in potential-field maps om along these reefal complexes. Such a correlation seems to suggest partial control on reef growth by basement faults. A gravity lineament related to the STZ coincides with the eastern side of the Morinville reef. To the south, along this lineament lie several smaller buildups.
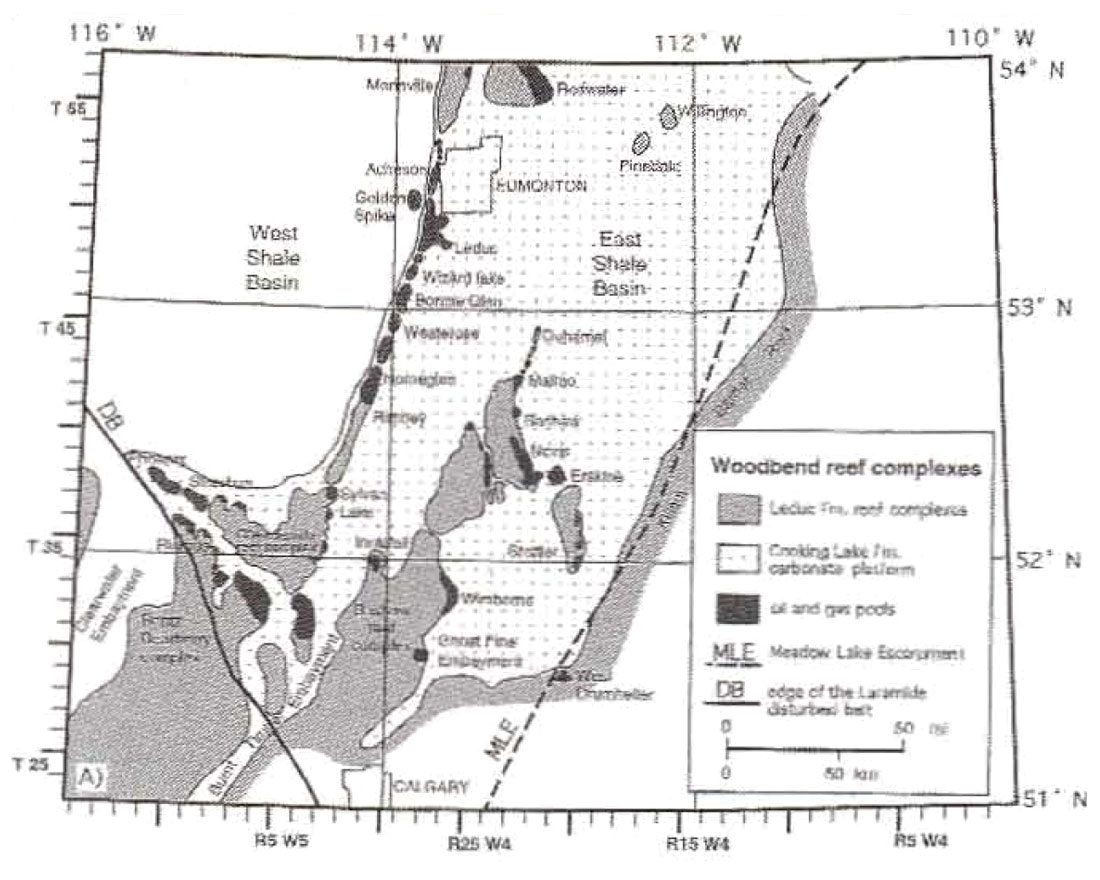
The Cheddarville reef complex has boundaries trending NW, N-S and NE, consistent with gravity lineaments there. Some reef boundaries and embayments in the Bashaw area also seem to match regional gravity lineaments.
Only local correlations of the Rimbey-Leduc reef chain with magnetic HGV lineaments are recognized, but NE-oriented magnetic lineaments are partly aligned with the eastern edge of the Bashaw complex.
To the east, the Leduc carbonate shelf ends at an abrupt, linear, NE-trending edge known as the Killam Barrier. This edge partly overlies the Meadow Lake Escarpment (MLE), a pre-Devonian erosional and structural feature thought to have influenced Middle Devonian sedimentation (Switzer et al. 1994). Between 52° 30' Nand 53° N, a deviation of the shelf edge from the MLE trend follows NE oriented magnetic lineaments. In the south, around 51° 30' N, the Leduc shelf edge follows ENE-oriented gravity lineaments.
Dissolution patterns of Upper Devonian salt in relation to basement faults
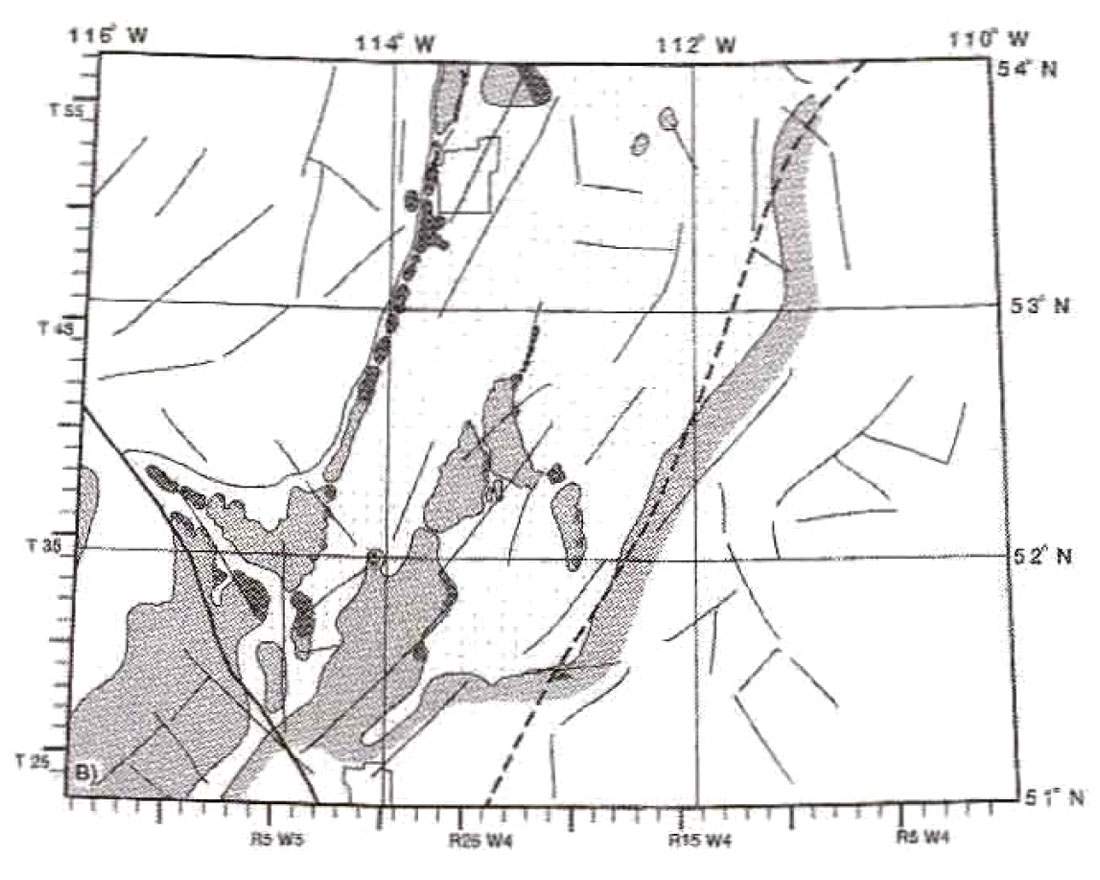
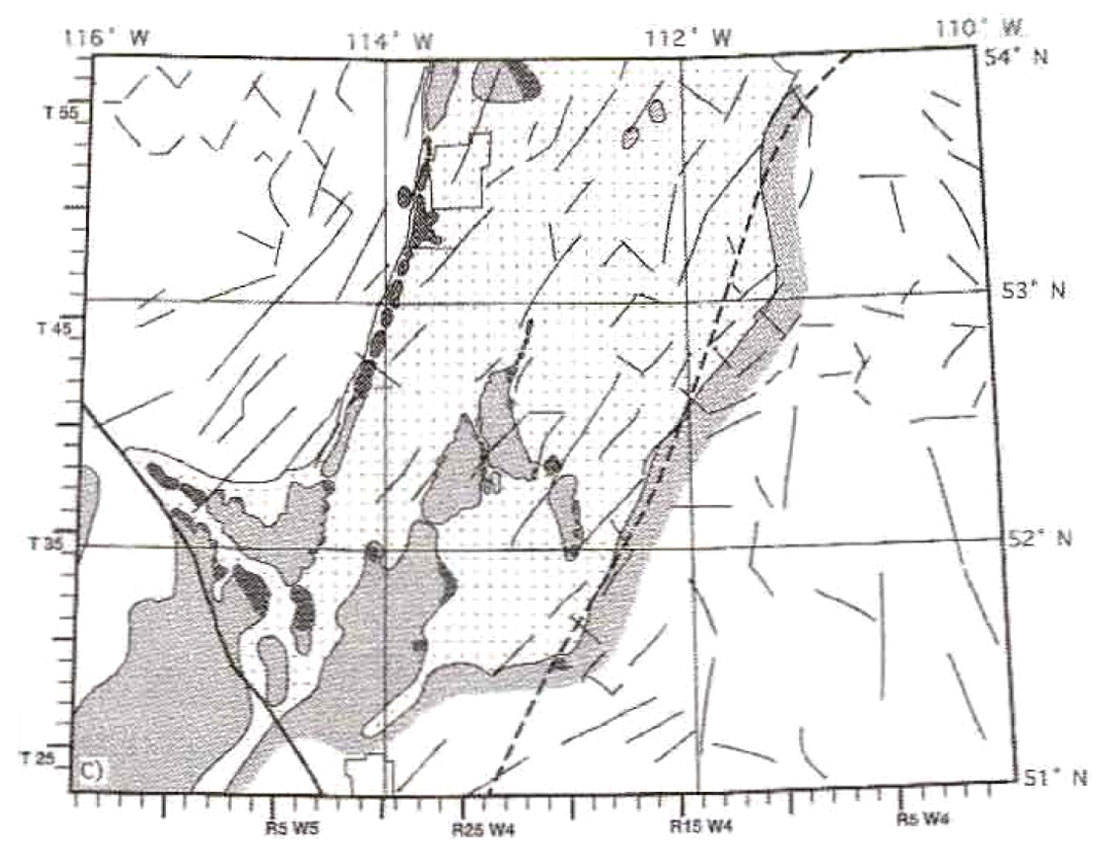
Removal of Paleozoic salt through dissolution is well recognized in Alberta and Saskatchewan (Bishop 1954; Oliver and Cowper 1983; Meijer Drees 1986). Some workers have linked the zones where salt removal is initiated to basement faults (e.g. Parker 1967). Comparison of magnetic HGV lineaments with salt dissolution maps of Anderson and Brown (1991) suggest fault control on dissolution of the uppermost Devonian Wabamun Group salt in the Stettler area of east-central Alberta (Figure 9).
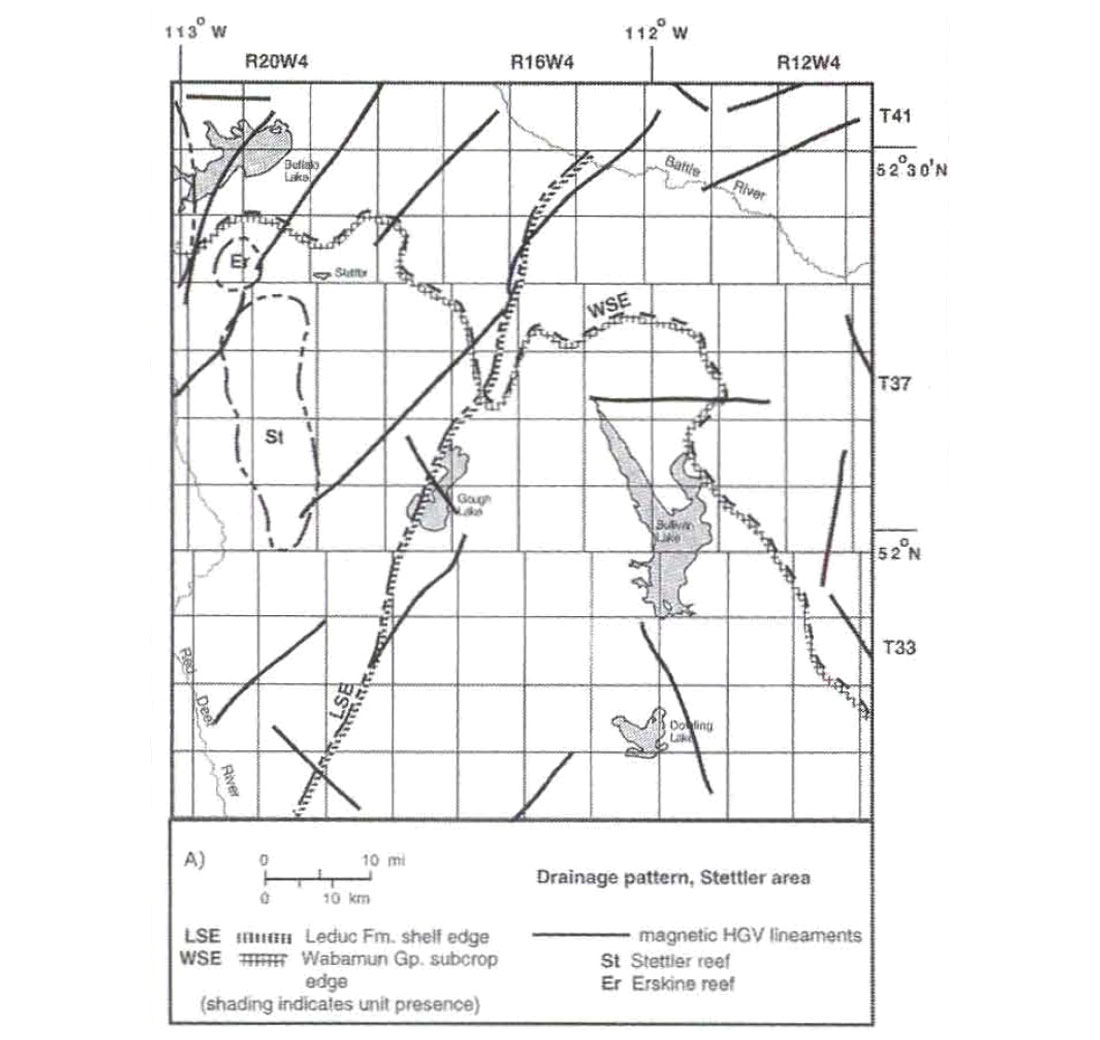
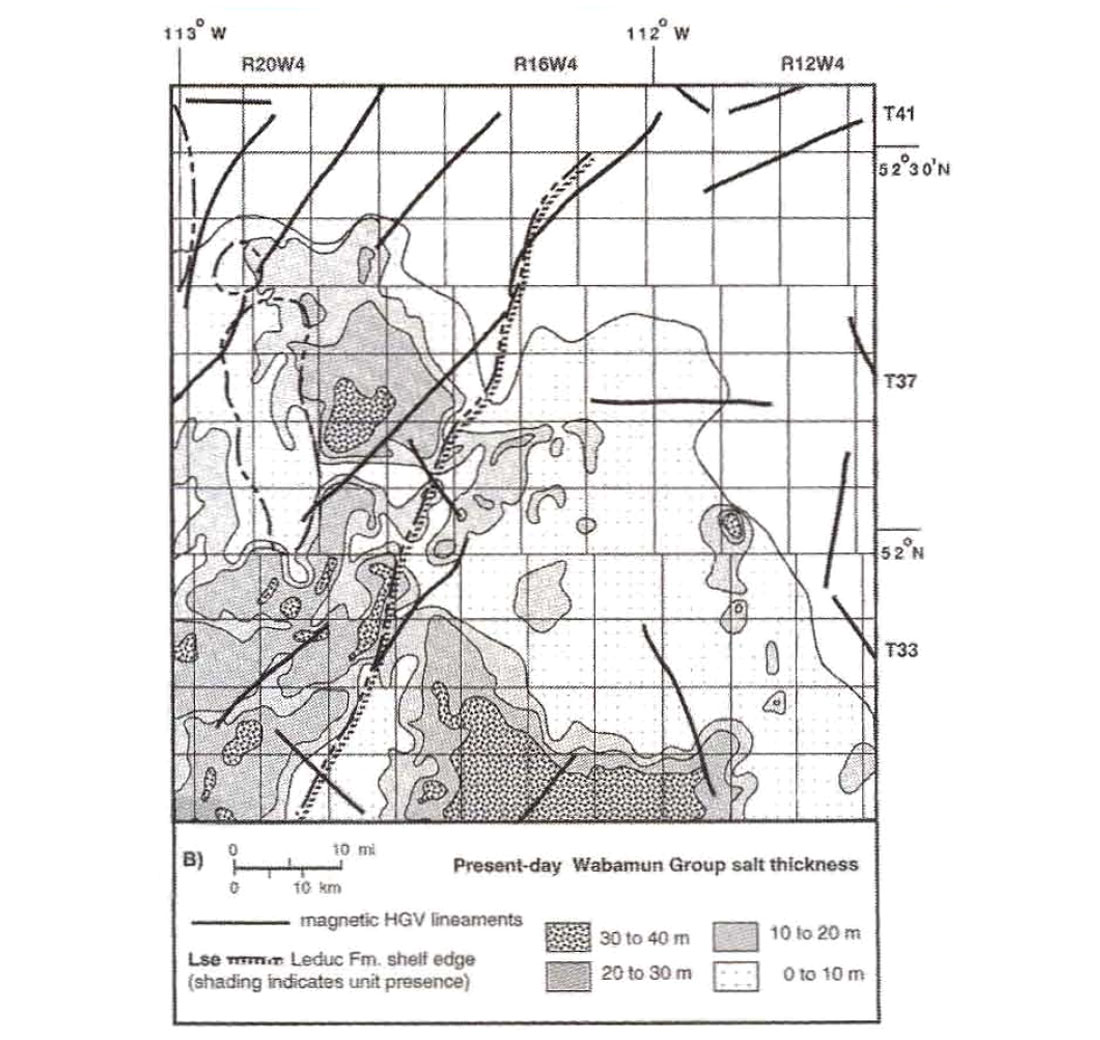
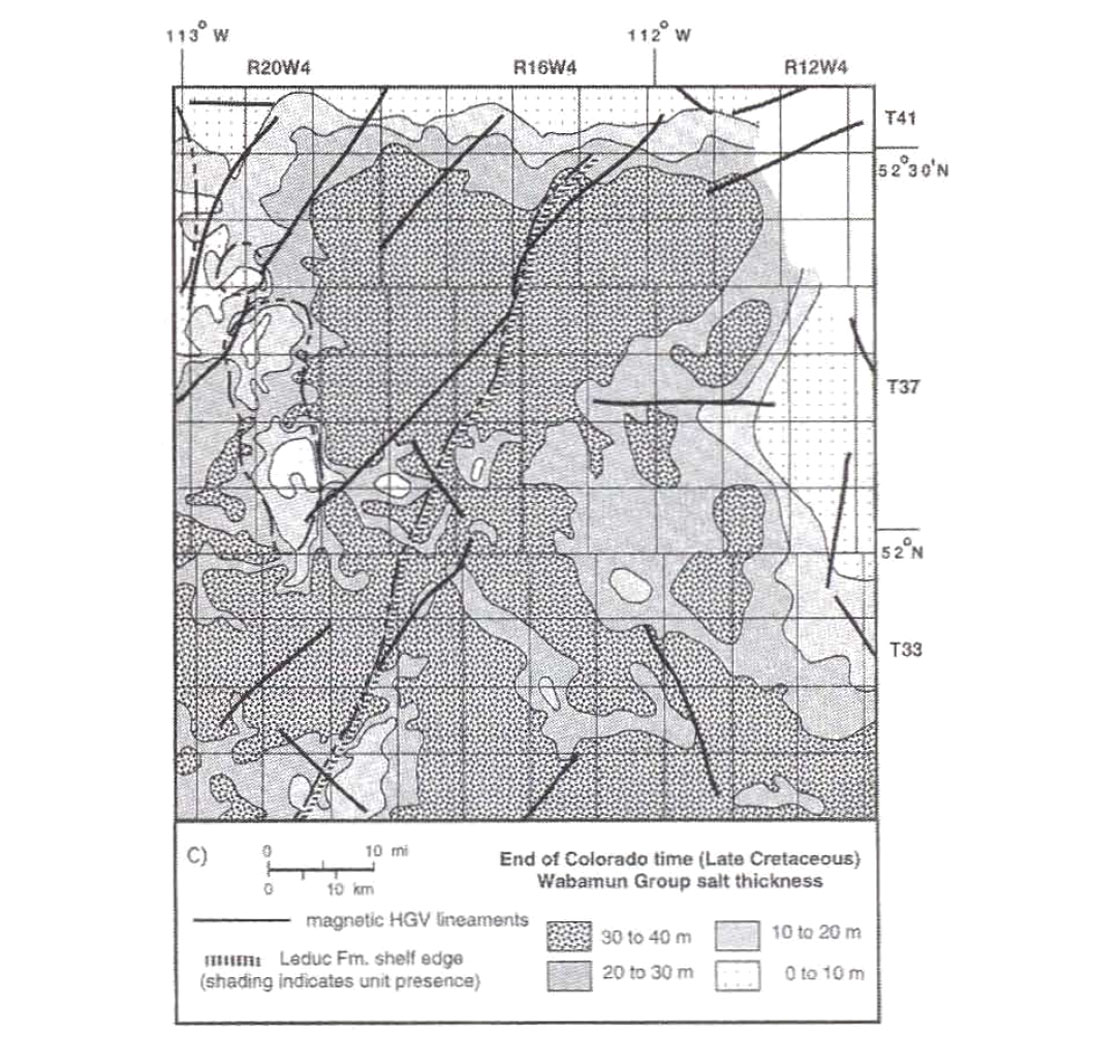
Beneath the salt interval in this area lie the Leduc shelf edge and several Leduc-age reefs. The Wabamun subcrop edge crosses the area NE-SW. Wabamun halite salt, initially widespread in a 40-m-thick layer, is now largely dissolved; where preserved, it forms bodies of various shapes (Anderson and Brown 1991).
Since regional magnetic maps in this area probably reflect the structure of the crystalline basement without significant contamination from shallower sources, magnetic data were used to study basement fault control on salt dissolution. The resolution of the available gravity maps was found to be too low for such detailed work.
Salt-dissolution fronts run NE, NW, N-S and E-W, consistent with the pattern of regional magnetic trends and inferred basement faults (Figure 9). Emphasizing dissolution patterns in the Holocene, modem lakes are elongated NW and NE. The probable role of faults was to provide conduits for undersaturated fluids that dissolved and removed the salt. Significant movement on faults cannot be ruled out, but is not necessary. Besides faults, other conduits for salt-dissolving brines were porous Devonian reefs, over which salt thickness is reduced. Some salt-thickness variations also follow the underlying Leduc shelf edge.
Cretaceous stratigraphic traps in relation to basement faults
During the Cretaceous, salt dissolution probably affected local paleo-environments in a lowland setting that existed at that time in Alberta (for review, see Leckie et al. 1994).
To illustrate the local applicability of our technique, we used the example of the productive Lower Cretaceous Sparky interval from the Lloydminster area of west-central Saskatchewan. It lies adjacent to our central Alberta potential-field map area, and was chosen because of the availability of detailed local litho facies maps in the public domain (e.g. Robson 1980). The Sparky interval is dominated by thin sheet sands tones and productive ribbon-shaped fluvial sands tone deposits. Figure 10 illustrates that these bodies lie on trend with NW-oriented magnetic lineaments.
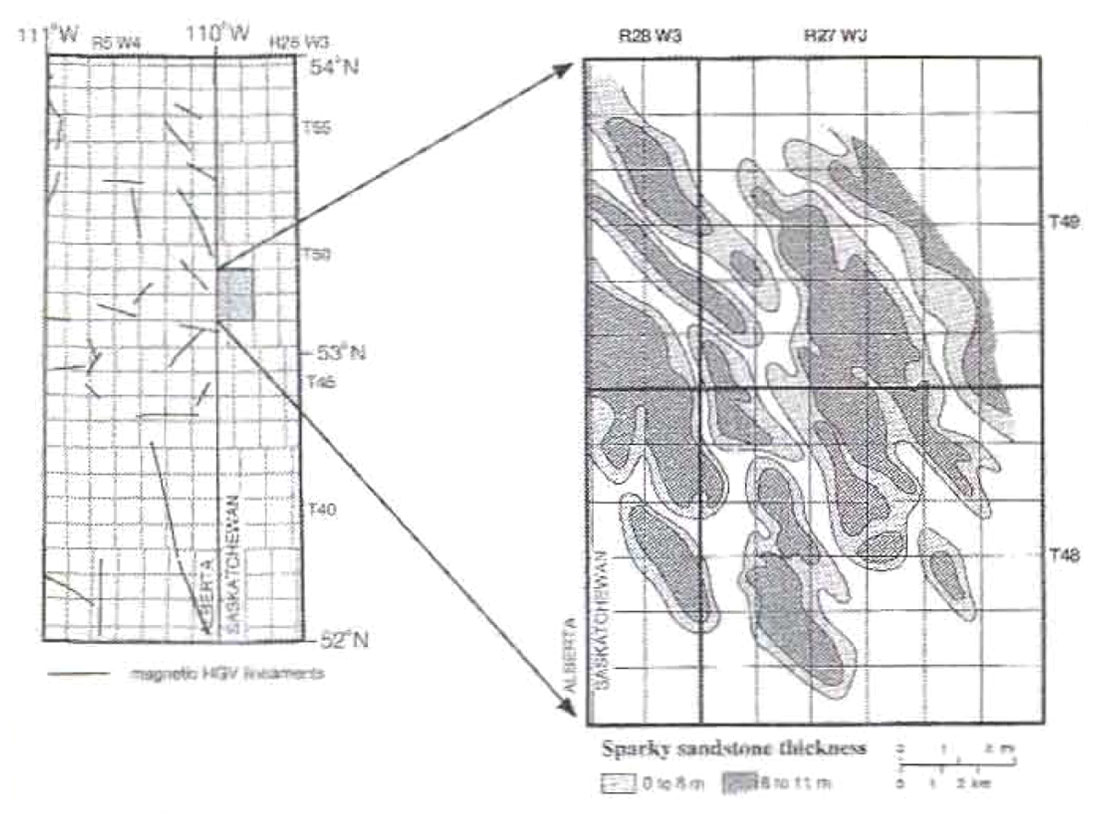
These sandstone bodies developed in lows or gullies which may have been products of fracture-controlled dissolution of underlying Paleozoic salt or syndepositional faulting (Putnam 1982; Hopkins 1987; Stauffer and Gendzwill 1987). If the correlation between Cretaceous ribbon sands tones and detectable basement fractures proves to be a regional phenomenon, a new tool might become available in the search for these attractive but elusive exploration targets.
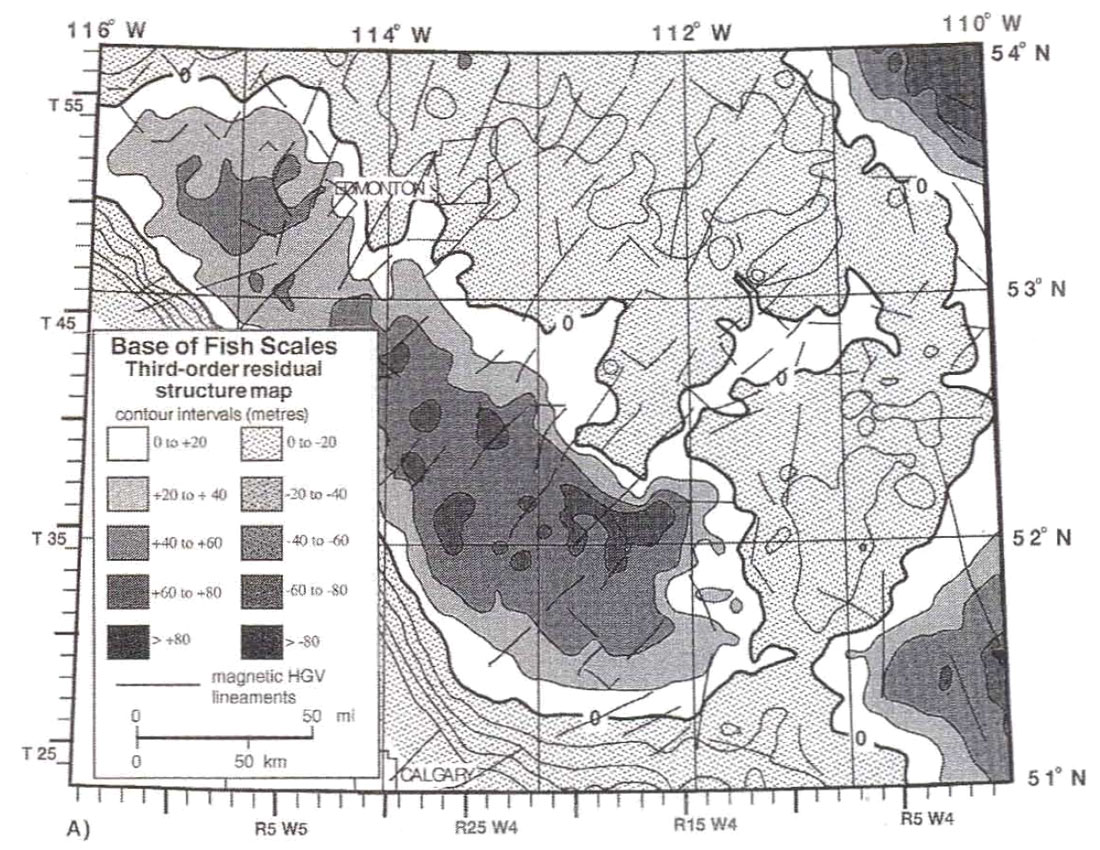
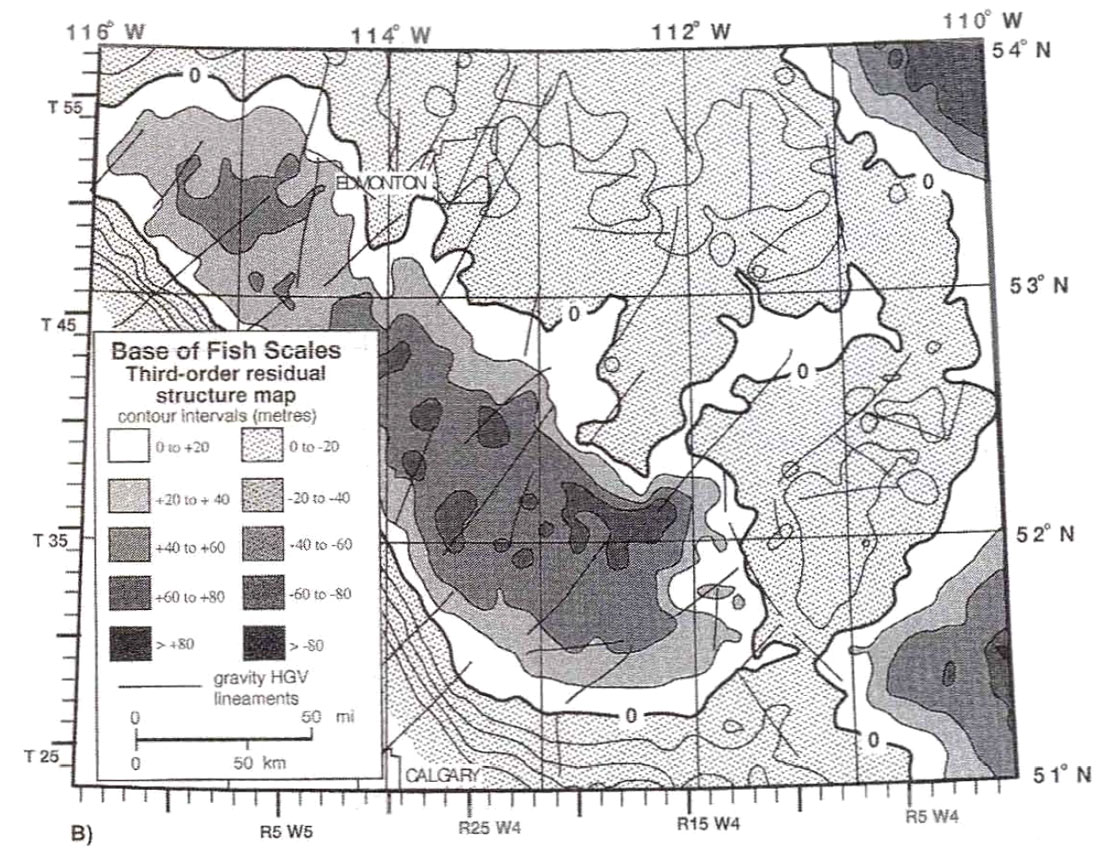
On a more regional scale, the base of Fish Scales Zone is a Widespread well log marker at the Albian/Cenomanian boundary (Lower/Upper Cretaceous). To distinguish subtle structural variations, a third-order residual formation-top map was compared with HGV magnetic and gravity lineaments (Figure 11). This revealed a number of large, polygonal highs and lows with amplitudes of tens of meters. Boundaries of these highs and lows often run NE and NW, and in places follow potential-field lineaments.
Conclusions
The horizontal-gradient vector (HGV) technique of potential-field anomaly enhancement takes into account both magnitude and directional information. Such maps, in conjunction with geological data, can be used to infer the locations of steep faults in the basement and the sedimentary cover.
Magnetic and gravity HGV maps in the central part of the Alberta Basin show distinctive NE-NW and N-S/E-W lineament systems. In the gravity HGV maps, consistent-arrow domains may represent tilted blocks in the basement.
By incorporating surface and subsurface geological data, we have related some of the potential-field lineaments to proposed basement faults which may have controlled deposition and deformation of sedimentary units throughout the Phanerozoic. This aspect of basin evolution is often underestimated, in part because many steep faults are poorly resolved with seismic data. Importantly, faults seem to control many exploration targets, which gives our HGV method practical predictive possibilities.

Acknowledgements
At the request of the Canadian Society of Exploration Geophysicists, this paper is reprinted, in a shortened form, from our 1996 paper in First Break. The HGV maps presented here were produced with a recently updated version of the HGV procedure, as described by Lyatsky et al. (1998) and used by Edwards (1997). The public-domain gravity and magnetic data were supplied by the Geological Survey of Canada.


Join the Conversation
Interested in starting, or contributing to a conversation about an article or issue of the RECORDER? Join our CSEG LinkedIn Group.
Share This Article