Introduction
Carbonates make up about half of the sedimentary rock in the Western Canada Sedimentary Basin (WCSB), ranging from Cambrian to early Jurassic in geologic age, in which large oil and gas reserves exist in the Devonian and Early Carboniferous formations. Middle and Upper Devonian carbonate rocks alone have a known reserve of about 15 billion barrel of oil and 35 trillion cubic feet of natural gas. A variety of carbonate reservoirs exist in the WCSB, mostly reef and platform types. These reservoirs are formed by porous limestones or platforms that were dolomitized prior to basin-wide hydrocarbon maturation and migration. Fractured reservoirs were formed by natural fractures due to regional or local stress regimes or by local overpressure.
Until recently, the seismic analysis of data from carbonate reservoirs relied mainly on interpreting zero-offset (stacked) seismic volumes. Common knowledge within the world of AVO suggests that zero-offset information is often insufficient to differentiate shale from carbonate porosity, or to discriminate gas-saturated from brine-saturated reservoirs. In the last few years, great efforts have been made to apply AVO analysis to carbonate reservoir characterization.
In investigating the feasibility, potential and sensitivity of carbonate rock properties in responding to porosity and fluid, several issues must be addressed. First, a lack of carbonate rock property information is considered as one of the obstacles in applying AVO to carbonate reservoir characterization. Second, the differences between clastic AVO and carbonate AVO need to be clarified. Third, procedures and calibration in seismic data processing and interpretation need to be developed. Recently, the situation in association with carbonate rock properties has been greatly improved due to a significant acquisition of dipole sonic logs, sampling a variety of reservoirs and formations directly associated with carbonates. This newly acquired information provides in-situ reservoir and non-reservoir measurements beyond laboratory and theoretical rock property predictions. On the seismic side, experience in AVO processing and interpretation, and from amplitude analysis and inverted rock property analysis, has also been growing. In this article, we review and discuss some issues facing the application of AVO to carbonate reservoirs: physical relationships between rock properties, fluid sensitivity of the carbonate rock properties, data processing, and calibration and interpretation.
Carbonate Rock Properties
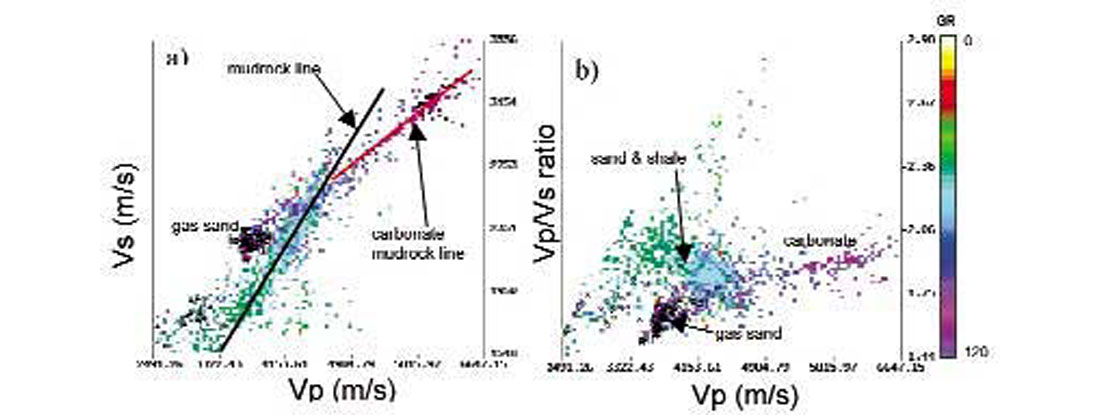
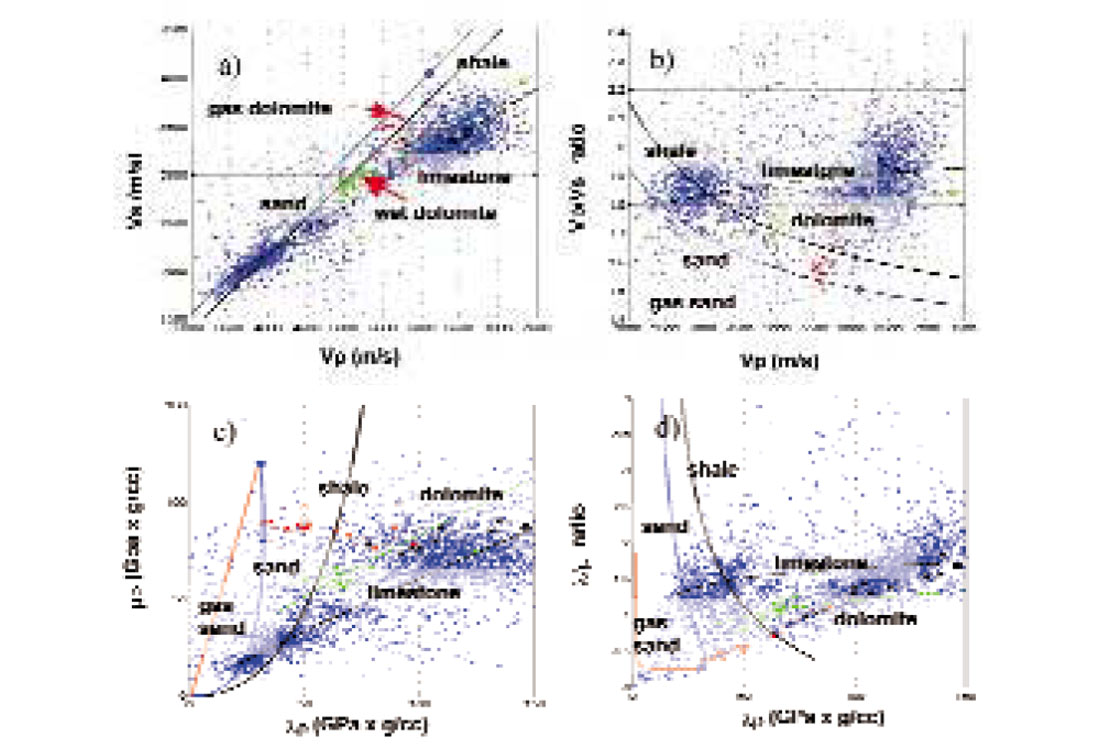
Figure 1 shows a general description of carbonate rock properties and their velocity domain relationship to clastics from a set of dipole well logs measured in the Foothills region of the WCSB. A mudrock line close to Castagna’s 1985 relationship can be established for clastics with Vs = 0.862Vp - 1172.4. Another linear relationship of Vs = 0.4878Vp + 230.0 is fitted to the carbonate lithology cluster. Analogous to Castagna’s definition, we call this linear relationship a carbonate line. It can be seen that carbonate line deviates from clastic mudrock line with a slope significantly less than that of clastic rocks. Notice that in contrast to clastic rocks, Vp/Vs ratio experiences an increase with increasing velocity or decreasing porosity. For this typical log data set, the carbonate rocks consist mainly of brine-saturated limestone. In Figure 1, as is usually observed for gas sands, the data points from the gas sand are shifted away from the clastic rock cluster and have a relatively low Vp and low Vp/Vs ratio in comparison with brine-saturated sandstone.
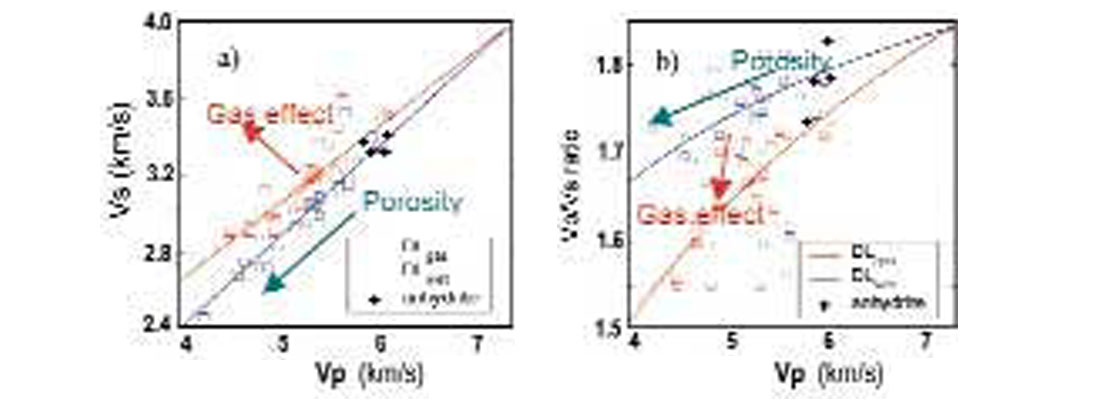
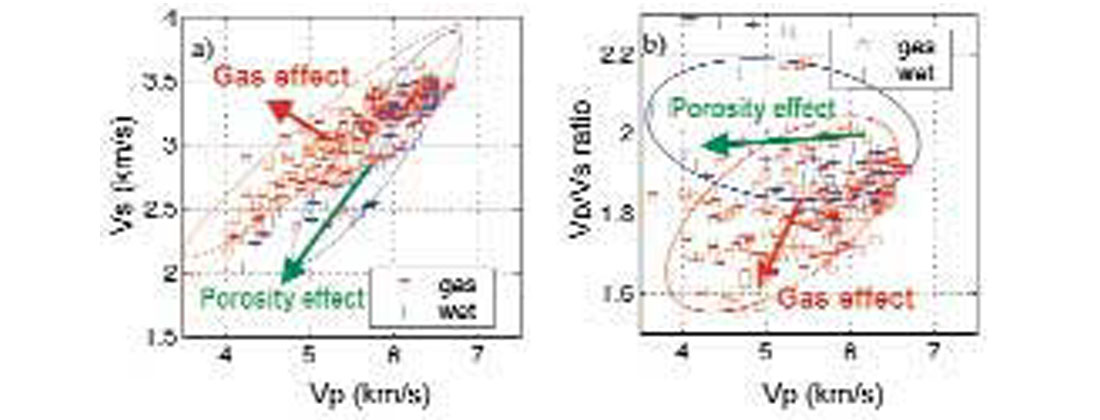
Fluid effects in carbonates, especially the gas effect, are contentious but of great interest. Common wisdom is that fluids have little or no effect on carbonate rock properties as these rocks have very high elastic moduli. Put another way, the high velocity of the carbonate rock matrix causes seismic waves to travel primarily through the matrix with less influence from pore fluids. However, an analysis by Rafavich (1984) of the dolomite data from the Williston Basin indicates that gas does influence carbonate rock properties and its effect is significant (Figure 2). Further evidence of this can be seen in an analysis of a large data of lab measurements conducted by Core Lab in the early 1990s on carbonate rocks from the WCSB as shown in Figure 3. This data set includes limestones and dolomites. It represents a wide range of carbonate reservoirs and non-reservoirs. An analysis of this data set indicates that the result is consistent with the data set of the Williston Basin. Notice that the behavior of dolomite rocks due to gas saturation is similar to that of sandstones. Namely, P-wave velocity and Vp/Vs ratio decrease, and S-wave velocity increases slightly due to decrease of density. In addition, sensitivity to fluid increases with increasing porosity. The results of limestone are not shown. In general they are similar to dolomites except less sensitive to fluid.
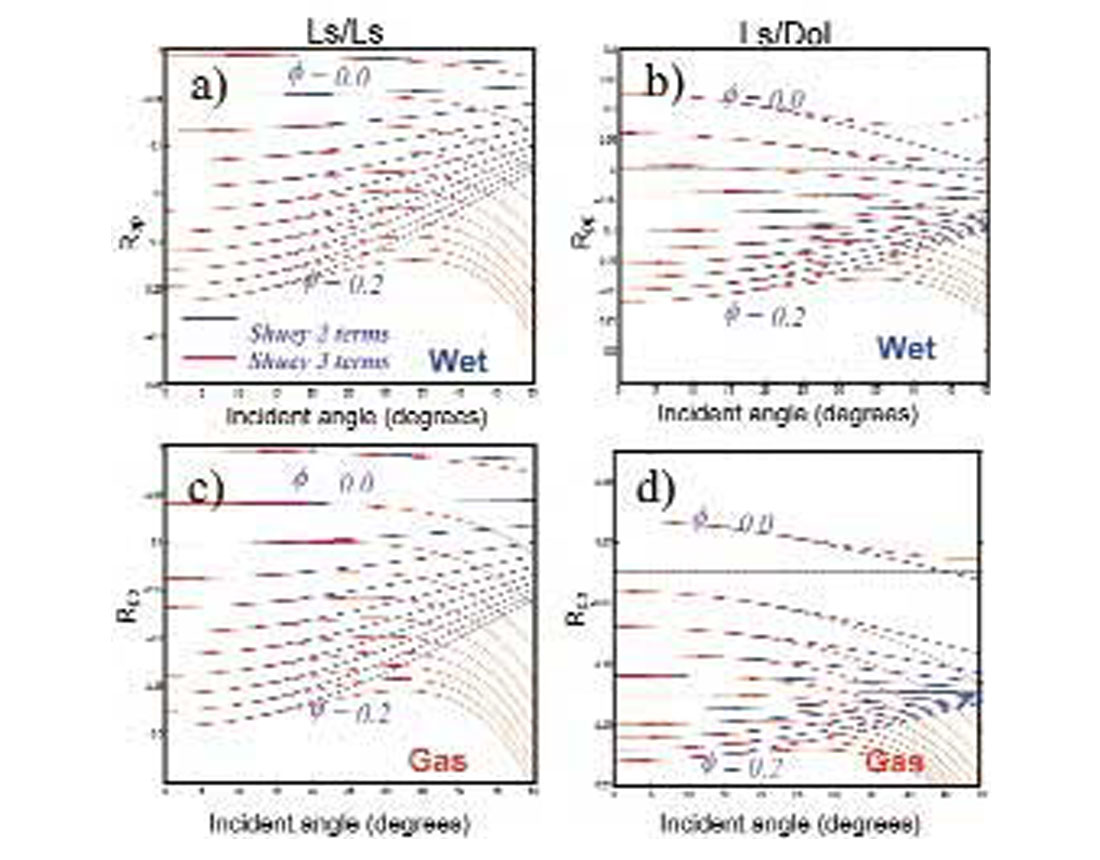
The influence of fluid on carbonate rock properties described above implies that the AVO responses to gas- and brine-saturated carbonates should be different. Theoretical calculations to examine this for commonly encountered reservoir types, porous limestone and porous dolomite encased by tight limestone, are given in Figure 4. First, for limestone reservoirs encased by tight limestone, the AVO gradient responses are similar for both gas and brine cases. So one might think that the zero offset amplitude would be the attribute to differentiate gas from brine. However, as porosity could produce similar zero-offset responses as fluids, so zero-offset amplitude is ambiguous in determining a fluid effect in a carbonate reservoir. By contrast, the fluid effect on offset amplitude or “gradient” in a dolomite reservoir encased by tight limestone is significant. Increasing gas filled porosity from 0 to 20% produces AVO class I through to class IV accordingly. More specifically, class III AVO is the predominant AVO type that corresponds to porosities from 6% to 20% (Figure 4d). In the WCSB, most carbonate reservoirs are in this porosity range. In addition, these AVO responses are accompanied by correspondingly weak positive to strong negative zero offset reflectivity. In Figure 4, Shuey’s two term AVO and three term AVO calculations are shown in blue and red lines, respectively. One can thus see that significant information in the inflection of the AVO curve may be lost if a two-term equation is used.
Due to the complexity of clastic reservoirs, making a one-to-one comparison between clastic AVO and carbonate AVO is rather difficult. An apparent difference is that class I AVO represents a tight reservoir in carbonates, whereas in clastics it represents the wet “mudrock” background or a reservoir with higher impedance. Another unique character is that amplitude for brine-saturated reservoirs has little variation until at large offsets. These unique characters of the AVO response in carbonate reservoirs remind us that clastics and carbonates should be treated differently. This may affect data processing and interpretation on CDP gathers, attributes, and elastic property inversion. First, CDP gather analysis for carbonate prospects should not be ignored and one needs to pay the same attention as in clastic reservoirs. Second, shear wave velocity information needs to be used correctly, such as in AVO modeling and the rock property inversion stage. As mentioned above, the carbonate reservoir types given in Figure 4 are those most commonly encountered. However, other types of interfaces and reservoirs associated with carbonates are frequently encountered in the WCSB. These include dolomite encased in anhydrite, limestone-to-shale interface, sand encased by carbonate, and sand overlying carbonate. As the lithologic complexity increases, so do the AVO responses. In these situations, often AVO modelling is a means to determine which type of AVO anomaly represents a specific geological setting. For fractured carbonate reservoirs other techniques such as azimuthal P-wave AVO and converted shear wave acquisition may contribute significant corroborative information.
Case Studies
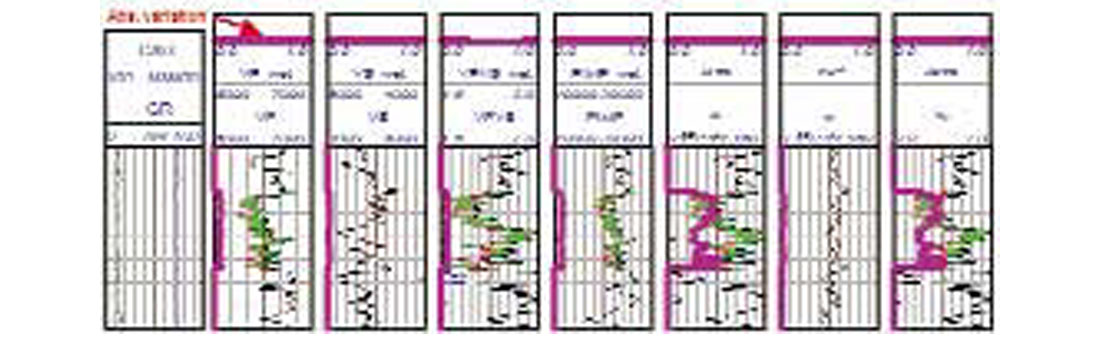
Selected dipole well logs representing a gas saturated dolomite reservoir at the depth of about 3700 m and a brine-saturated dolomite reservoir at a depth of 3000 m were analyzed (Figure 5). The gas-saturated reservoir has a thickness of 30 m with an average P-wave velocity of 5400 m/s, density of 2.5 to 2.6 g/cc, and porosity of 8% to 16%. In Figure 5, the gas and wet dolomites are highlighted as green and red squares respectively, tight limestone data points are highlighted as black squares, and small blue dots represent the entire well log. A set of empirical lab data relationships for sand, shale, and carbonates are overlain on these crossplots to establish a background template to locate and separate the major lithologies. These crossplots serve a critical purpose in understanding the relationships between different lithologies and fluid effects. There are no gas sand intervals in these wells to match the empirical relationships but one can refer to Figure 1. The observations made from Figure 5 are: a) the gas effect is apparent and is magnified in the Vp/Vs ratio, λ/μ ratio, and λρ domains, where λ is the Lamé constant, μ is shear modulus and ρ is density; b) Wet dolomite or wet limestone can be used as the background reference in order to quantitatively determine the degree of the gas effect; c) the shear modulus of carbonates are higher than that of shale; and d) shale and porous carbonates can be distinguished as they occupy different spaces in the λρ and μρ crossplot domains.
To have a quantitative assessment of the influence of fluid on carbonate reservoir rocks, brine substitution was performed for the gas charged dolomite in Figure 5. The sensitivity of rock properties in various domains within the reservoir interval is compared in Figure 6. From the gas case to brine-substituted case, the density, velocities, Vp/Vs ratio and impedances change by a magnitude of about 10 percent. The λρ and λ/μ ratio, however, increases as much as 50 percent. This is consistent with what is observed in clastic reservoirs. Consequently, just as in clastic reservoirs, for carbonate reservoir characterization, one may use λρ and λ/μ ratio as fluid indicators.
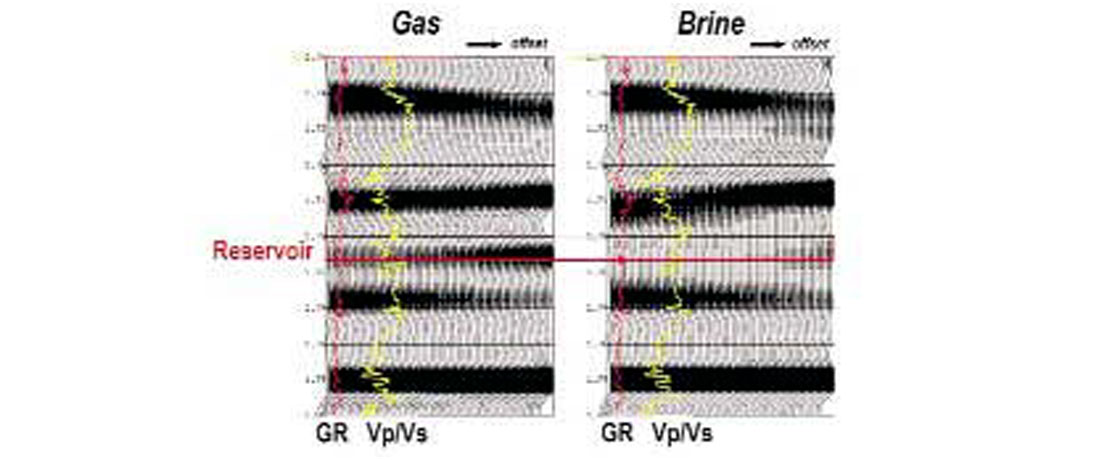
Synthetic gathers for the gas charged reservoir and its brine-substituted case were then generated and shown in Figure 7. There is a class III AVO response at the base of the gas charged reservoir that changes to a weak class II AVO after brine substitution. This is consistent with the theoretically calculated AVO response shown in Figure 4.
Areal data example of a CDP gather at a dolomite gas well location is shown in Figure 8. The reservoir is at a depth of about 3000 m with a thickness of 20 m and porosity of 12% to 14%. Figure 8a is the Ostrander gather and Figure 8b is the re-constructed gather using P- and S- reflectivities (Rp and Rs) which were extracted using Fatti’s AVO equation

Similar to the synthetic gather for the gas case in Figure 7, there is a class III AVO at the base of this reservoir. This again confirms that a gas charged dolomite reservoir does produce an AVO anomaly where amplitude brightens at far offsets. At this specific well location, another class III AVO expression appears underneath the penetrated reservoir. It suggests a potential reservoir may exist at a deeper location.
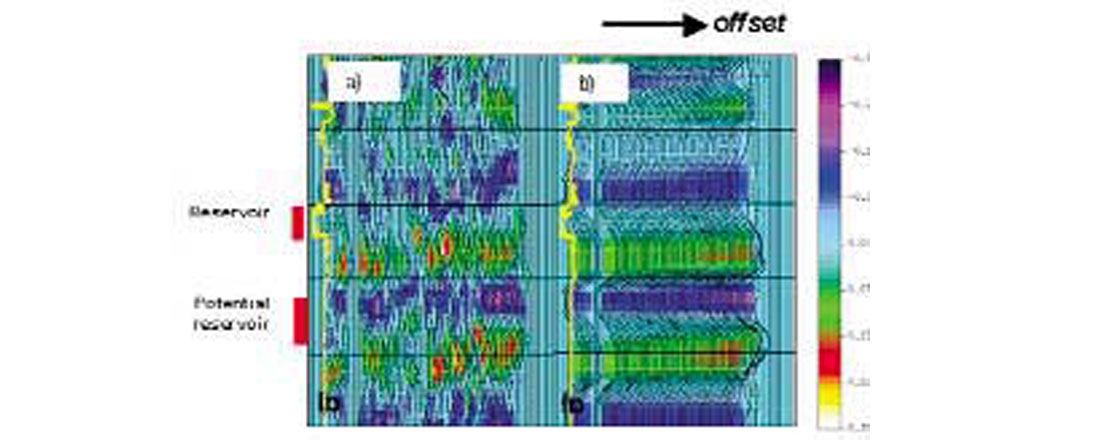
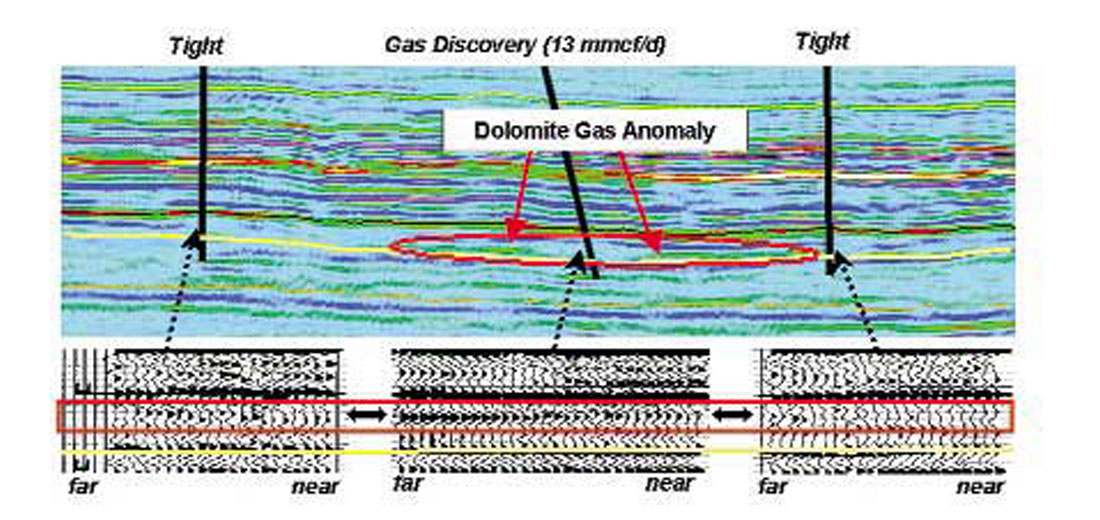
Figure 9 gives an example of a 2-D stacked section with three CDP gathers corresponding to two tight wells and one gas well. The gas dolomite discovery well produces 13 mmcf gas per day. The reservoir manifests itself as a bright spot as highlighted. Without examining pre-stack gathers, this bright spot may be interpreted either as porosity, a shale-filled channel, or gas charged reservoir. However the CDP gather at the gas well location shows a class III AVO anomaly. In contrast, the seismic responses on the CDP gathers at the two tight well locations are quiet. This example demonstrates that far offsets can contribute significantly to the amplitude anomaly of bright spots on stacked section and amplitude variation with offset does provide additional information for defining carbonate reservoirs.
To define a carbonate reservoir with more information, elastic property inversion developed by Goodway et al. (1997) was used in this study. The procedure of this technique is: first, extract P- and S-reflectivities (Rp and Rs) from CDP gathers by using Equation (1); then invert these reflectivities into P- and S-impedances (Ip and Is) by combining the low frequency background of P- and S-impedances. Finally the modulus attributes, λρ, μρ and λ/μ ratio were calculated using μρ = Is2 and λρ = Ip2 - 2Is2. This technique has been widely used in clastic reservoirs in the WCSB. The effectiveness of this technique is based on the fact that λρ and λ/μ ratios are sensitive to fluid as shown in Figure 5.
As an example, λρ and μρ sections for a carbonate gas play are shown in Figure 10. There are three wells drilled on this section shown as tight, good gas and marginal gas. Direct observation on Figure 10 indicates relatively low λρ values at the good gas well location, and higher λρ values at the tight and marginal gas well locations. However, μρ has little variation within the reservoir zone. This is usually explained as μρ is only slightly affected by fluids: shear modulus, μ, is unaffected by the presence of fluid and represents the rigidity of the rock matrix. As we know, shale zones may manifest as a good amplitude anomalies in stacked section and low impedance in P-impedance inversion. So the hope is that using shear wave information via AVO analysis would help to differentiate shale from carbonates.
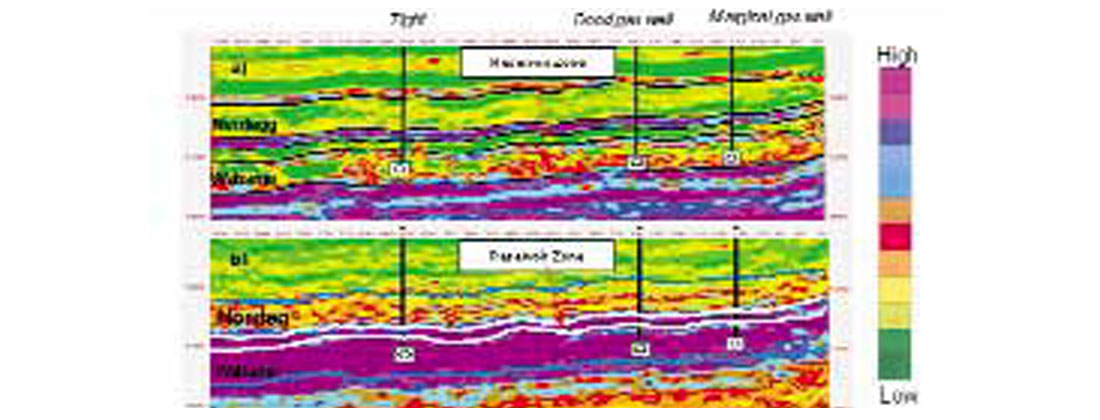
In Figure 10, there is low λρ and μρ in the shale zone underlying the reservoir zone. It can be seen that the ambiguity between the shale and reservoir prevents one from defining either a low λρ or μρ zone alone as a reservoir. However, we can use cross-plotting to solve this problem. This is because the shear modulus of reservoir carbonate is higher than that of shale. To demonstrate this, the λρ and μρ sections in Figure 10 were cross-plotted and are shown in Figure 11. As expected, there is good separation between shale and carbonates in cross-plot space. Furthermore, for reservoir and non-reservoir carbonate rocks a space filled with data points from the gas well in Figure 11b is almost empty for tight and marginal gas wells in Figure 11a. This cross-plotting approach is routinely used in rock elastic property interpretation in clastic reservoirs and has also proven effective in discriminating gas charged carbonate reservoirs.
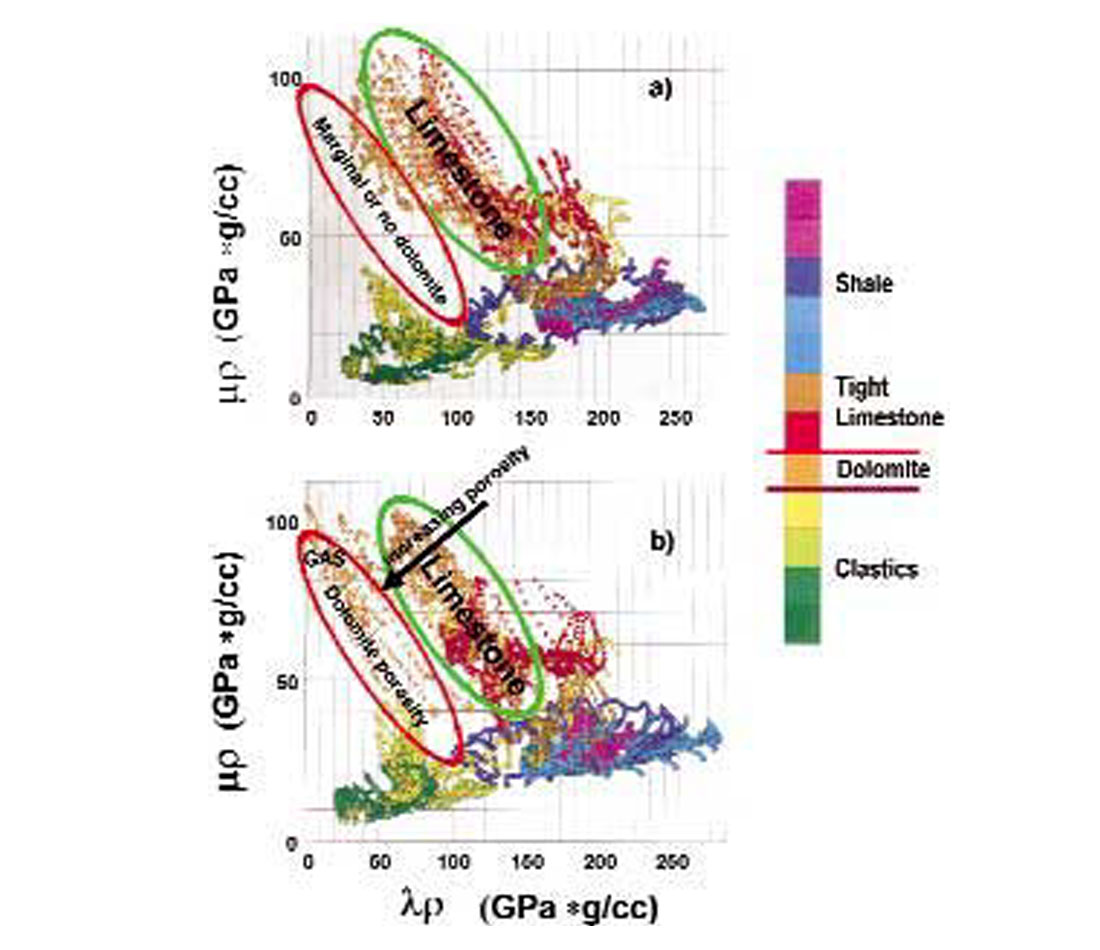
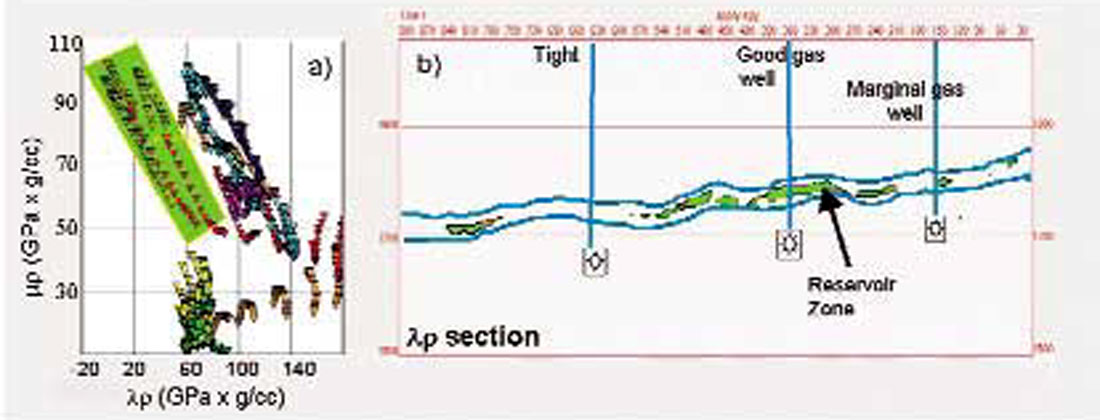
Figure 11 demonstrates that the gas charged dolomite reservoir has a good separation from tight limestone and marginal gas well. One can thus isolate the reservoir from non-reservoir rocks by projecting data points within a polygon in the cross-plot domain back to the 2D section or 3D volume. A polygon for the reservoir rocks indicated in Figure 11 was drawn in Figure 12a and the projected result in the λρ section is shown in Figure 12b. Up to this stage the reservoir has been successfully isolated. It can be seen that the good gas well is isolated at the centre of the most continuous low λρ zone, the marginal well is near a small gas zone but misses the target, and the location corresponding to the tight well has no λρ, μρ cross-plot polygon anomaly. Furthermore, Figure 12b suggests that two potential drilling locations may exist at CDP 500 and CDP 810.
Calibration
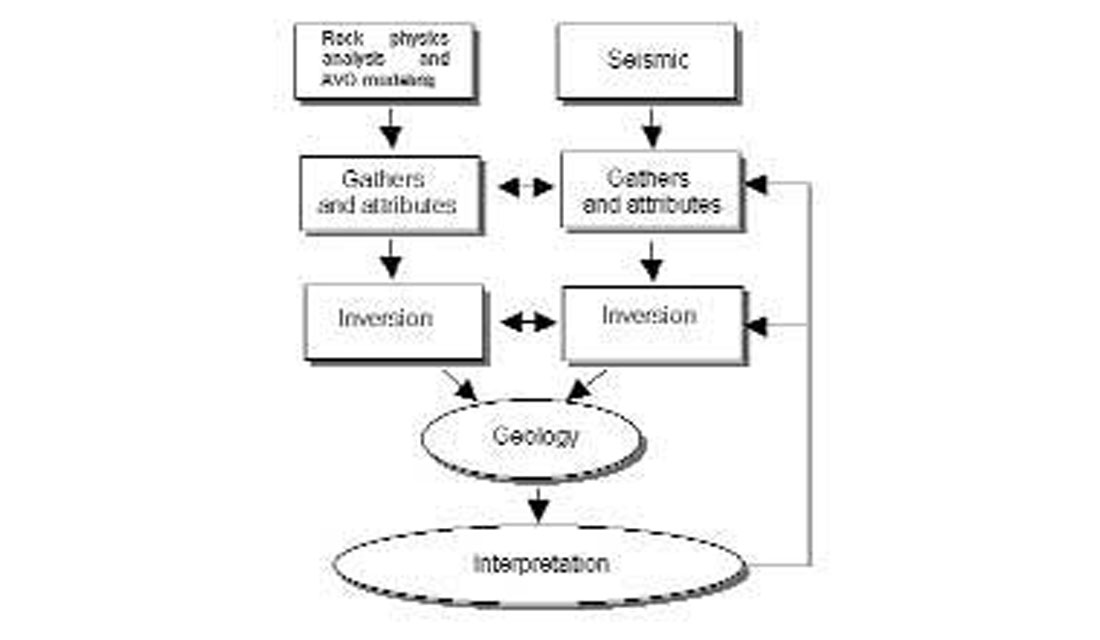
Calibration is a cross-examination between petrophysical rock properties, seismic rock properties, recorded seismic data, and inverted seismic rock properties. A flow chart for the calibration and interpretation in carbonate reservoirs using AVO is given in Figure 13, showing two main branches: one for rock physics analysis and AVO modeling, and the other for seismic processing. Seismic interpretation should start from stacked seismic data in which a seismic amplitude anomaly and/or phase anomaly may already be seen. AVO anomalies can often be determined by analyzing Ostrander or super-gathers and AVO modeling can be conducted at this stage to assist in determining whether an observed seismic AVO anomaly corresponds to a reservoir. The elastic rock property inversion provides P- and S-impedance, λρ, μρ, and λ/μ ratio. As P-impedance alone cannot solve the ambiguity between shale and carbonate porosity, so λρ, μρ, and λ/μ ratio information become crucial in discriminating reservoir from non-reservoir. In the stage of elastic rock property inversion, the relationship of P- and S-reflectivity trends may be used in checking whether offset dependent amplitudes have been properly preserved by the pre-stack processing. The relationship between P and S-impedances may also be used to check whether the inversion step was performed with a correct low frequency background. Well log ties to inverted rock properties are often used for further quantitative calibration. When dipole logs are not available, a known thick tight limestone interval, which is often the lithology overlying or underlying a reservoir, may be used for calibration. This is because limestone has relatively stable P-wave velocity and Vp/Vs ratio. Other well-defined background geologic units such as thick shale may also be used. Geological information needs to be used in the interpretation and the final QC calibration stages. This is because carbonate depositional environments and diagenetic environments are unique. A correct geological model should provide valuable information for eliminating any seismic anomalies that are inconsistent with the geological interpretation.
Conclusions
With better understanding of carbonate rock properties and advances in seismic data processing, carbonate reservoir characterization using AVO becomes more practical and less contentious. The fluid does affect carbonate rock properties and with significant magnitude given the rock property interpretation, the high shear modulus of reservoir carbonate rocks may be used to differentiate against shale intervals. Low λρ in combination with low λ/μ ratio or Vp/Vs ratio may be used to define a gas charged dolomite reservoir. Rock physics analysis, seismic modeling, geologic input all are useful in constraining interpretation. Utilizing AVO techniques with correct data processing, geologic input, and awareness of pitfalls, the risk of carbonate reservoir exploration may be reduced.

Acknowledgements
The authors would like to thank EnCana Corporation and Core Laboratories Reservoir Technologies Division for supporting this work. The authors also like to thank Jan Dewar and Satinder Chopra for their comments.


Join the Conversation
Interested in starting, or contributing to a conversation about an article or issue of the RECORDER? Join our CSEG LinkedIn Group.
Share This Article