Introduction
Over the past several years, significant advances have been made in the acquisition, processing and analysis/interpretation of converted-wave (PS) multicomponent seismic data resulting in renewed enthusiasm for use of this technology. The development of purpose-built multicomponent data acquisition systems based on MEMS (Micro Electro Mechanical System) digital accelerometers has resulted in improved data quality, more efficient field operations and diminished multicomponent acquisition costs.
Garotta et al. (2002) suggest that more widespread acceptance of multicomponent seismic will occur when shear-wave (Swave) information can be easily extracted and incorporated into the interpretation workflow and that the accrued benefit will “far outweigh the acquisition cost.” Currently, the effort of many in the industry is directed toward the development of analysis/interpretation tools, the effective integration of multicomponent information into the interpretation workflow, and the demonstration of value from such integration.
At the same time, converted-wave acquisition costs are much more favorable now than in the past. Both Garotta (1987) and Kendall (1996) estimated PS acquisition costs to be at least 35% larger than costs for comparable P-wave acquisition. Some of these estimates were for static receiver patches associated with small surveys and, in all likelihood, the reported costs would have increased for larger projects with a moving receiver template.
We are now observing an ongoing effort to lower multicomponent acquisition costs while simultaneously integrating PS data into the interpretation workflow. This paper focuses on the issue of cost and the important cost drivers for the acquisition of converted-wave data. Before discussing cost, let us consider the issue of value.
Value of Multicomponent Information
Currently, the value of S-wave information derived from PS seismic data is often poorly understood. It has been documented that, in certain instances, the use of S-wave information reduced drilling risks (e.g., gas cloud imaging problems). However, in other situations, risk reduction has been more difficult to demonstrate. Meanwhile, the increased cost of acquiring multicomponent data is quantifiable and highly visible, occurring early in an exploration project. This results in a focus on the increased cost of multicomponent data and not on the potential value of the S-wave information. S-wave information is converted to value by producing a decrease in exploration and development risk.
Current industry opinion regarding the use of multicomponent data is very similar to that towards P-wave 3D in the early 1980s. The theoretical basis for 3D imaging was in place, although existing acquisition and processing methods needed refinement. There had been demonstrations that 3D data provided value. It was generally understood that 3D seismic should reduce risk, but it was unclear as to whether it would be economical for a particular reservoir or play concept. Like multicomponent today, the cost of 3D relative to 2D was highly visible, and the use of 3D was suppressed. This was not so much due to the perceived high cost, but rather to the lack of understanding of value provided by 3D. Once there were clear indications of the value of 3D, its usage became the norm.
Analogously, the use of S-wave information is “in the 80s” today. The theoretical basis for the value of S-wave information is in place. The ability to record, process and interpret is available, although in need of further refinement. There is a critical need for clear demonstrations of value through the reduction of risk associated with exploration for, and development of, hydrocarbons.
What is the value of the S-wave information provided by a converted-wave project? This is somewhat difficult to answer and certainly difficult to quantify. It is most useful to think of the additional information as falling along a continuum, ranging from simply corroborating the accompanying P-wave information to providing a solution unattainable by the Pwave data alone. All along the continuum, the S-wave information adds value by further reducing risk.
Regard the additional information derived from multicomponent data as being a “halo” around the information provided by conventional P-wave data (Figure 1). In an area where the P-wave data provide essentially a complete structural picture, the S-wave information may simply corroborate that structural image (point A on A-B). For a gas cloud problem, the Swave structural information from a converted-wave survey may well provide the solution (point B). In this case, the PS data provide a large “halo” of new information.
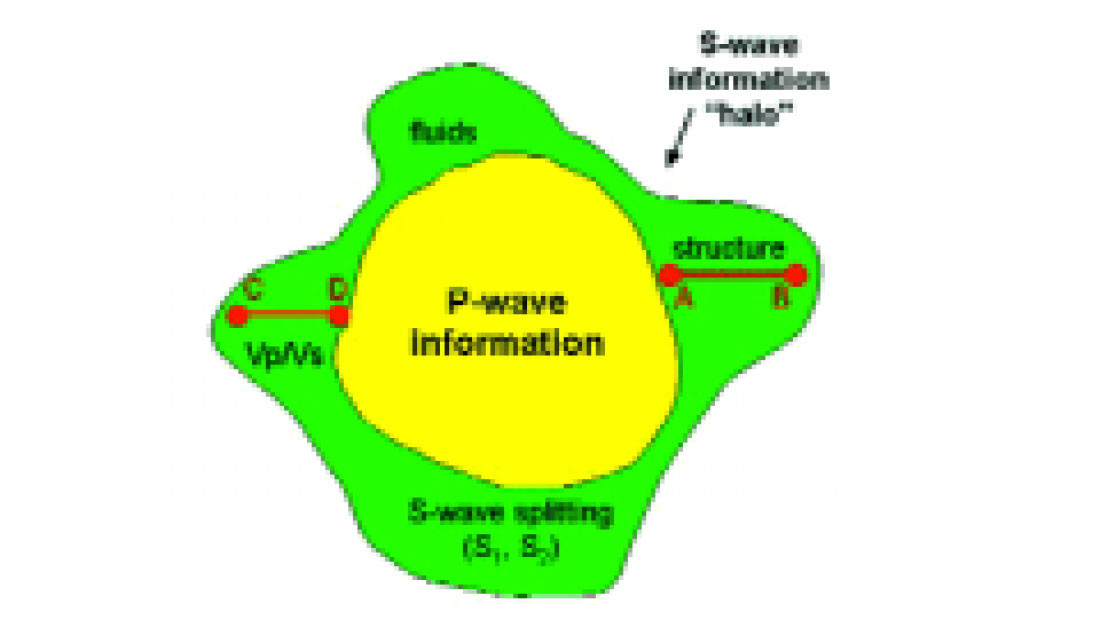
Now consider profile C-D in Figure 1. If the S-wave information simply confirms rock property information derived from P-wave AVO analysis, there would be a small halo (point D). In other cases, the S-wave data may provide the more complete solution and a large halo of added value results, such as when using S-wave data to detect anisotropy due to fractures (point C). This is particularly intriguing since fracturing can be related to relative permeability.
The additional information provided by multicomponent data will always reduce risk, even if by only corroborating information derived from the P-wave data. Also, S-wave data are often better suited for addressing certain problems (birefringence, gas cloud imaging, low P-wave impedance contrasts) than P-wave data. We propose that any given exploration or development play should be evaluated from the basic reservoir rock physics. Would the application of both P-wave and S-wave data serve to reduce risk and improve the play economics?
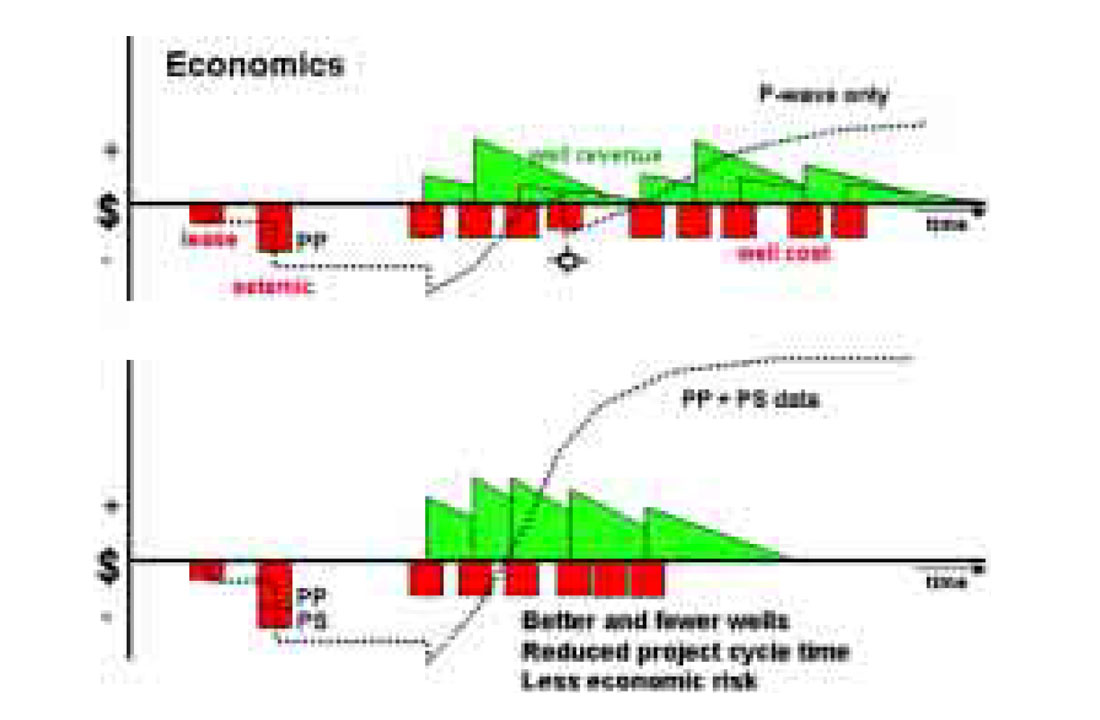
Figure 2 outlines hypothetical project economics for two cases, one using only P-wave seismic data and the second using both P-wave and S-wave data. Ideally, the additional information would result in fewer wells being drilled with greater reserves per well. Also, the wells would be drilled earlier, thus reducing the project cycle time. There would be less uncertainty in the second project as opposed to the first, where uncertainties are often discovered during the drilling phase, creating delays and the need for reevaluation of the data. The dotted lines represent project cash flow and show more favorable cash flow for the project utilizing P-wave plus S-wave information. Even with an increase in the cost of acquiring the multicomponent seismic data, the second case results in better economics.
The New Generation of Recording Equipment
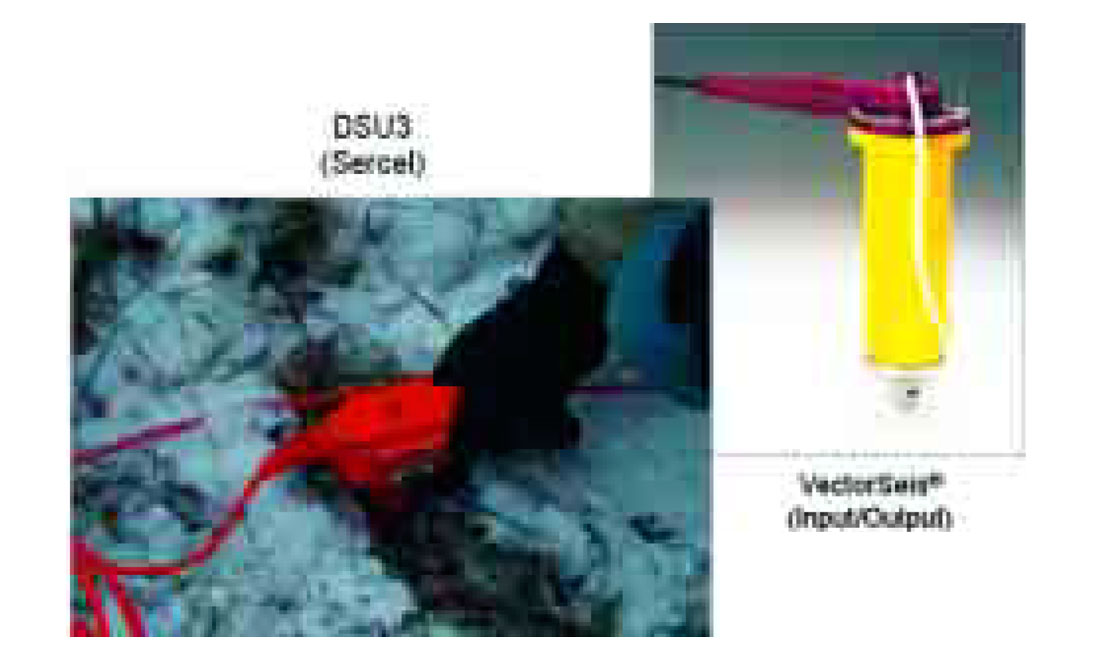
At the heart of modern multicomponent acquisition systems are MEMS-based digital accelerometers. Versions of these sensors provided by Sercel and Input/Output are shown in Figure 3. These devices provide some decided advantages over prior multicomponent sensors. System attributes include:
- Direct digital output
- Excellent vector fidelity
- Broadband linear phase and amplitude response
- Low distortion
- Correction for sensor tilt
The overall complexity and physical attributes of modern multicomponent acquisition systems are vastly reduced from previous generations. Figure 4 shows a comparison of the system configurations for conventional geophone array, conventional multicomponent (3C) and MEMS 3C recording.
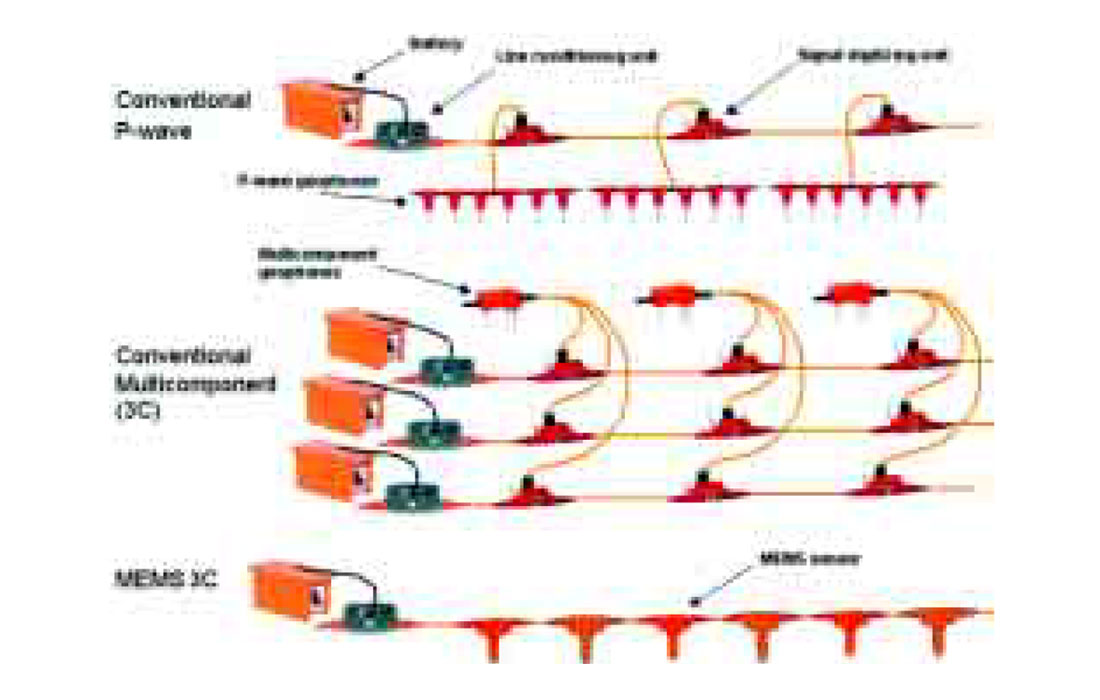
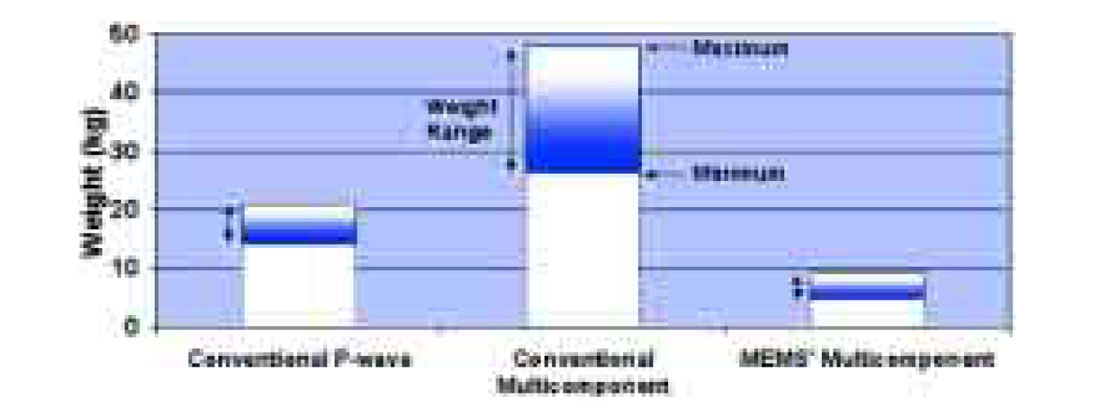
Figure 5 provides a comparison of system weights per station. Similar comparisons can be made regarding cable requirements, number of electrical connections, and battery and box requirements. The new multicomponent systems allow for more efficient field deployment and the reduction of errors (and corresponding loss of data) often experienced with connecting three-component geophones to a conventional P-wave recording system. Reduction in processing cycle time results from the more accurate mapping of receiver station/receiver component to recording channel.
MEMS-based 3C digital sensors are currently deployed in shallow drill holes in order to assure good ground coupling, particularly for the horizontal elements. These sensors are able to accurately measure and record the Earth’s gravity vector for subsequent correction of vertical tilt. As a result, there is no need for the traditional “field leveling” that compromises sensor coupling and adversely impacts crew productivity.
Modern multicomponent acquisition systems can efficiently and reliably accommodate large station counts (one station = three channels) and feature lightweight equipment with low power requirements. Further, these systems can provide for telemetry redundancy and automated quality control of the equipment. As noted earlier, these new systems are purpose-built for recording multicomponent data and thus properly address performance. Prior systems are somewhat of an acquisition kluge as evidenced by the complexity in wiring (Figure 4).
In sum, the new multicomponent acquisition systems allow for more productive crews and this, in turn, provides leverage against the increased costs associated with the new equipment. Such productivity increases have been demonstrated on a number of Canadian multicomponent 3D projects.
Cost Drivers for Multicomponent Projects
On any seismic project there are a number of factors that drive cost. These include parameter selection, project size and shape, the impact of terrain and culture and the time of year during which recording takes place. As Garotta (2003) observes, P-wave acquisition designs may not be appropriate for converted-wave recording. For example, denser receiver spacing may be desirable in addressing noise issues associated with point receiver recording. Design modifications that provide more complete offset and azimuth distributions may also be necessary. Additionally, increased source effort via larger charge size, increased sweep length or number of sweeps could be required for signal enhancement. Design changes can impact the economics of all aspects of a project, from permitting through recording and data processing.
The economics of the recording phase of a seismic project are determined by the cost of both equipment and personnel, and by the length of time they are required to be in the field. A conventional multicomponent recording system is comprised of three times the amount of ground electronics of a P-wave system. This necessitates additional personnel to move extra equipment, and results in more time spent in the field. MEMS-based systems, like conventional multicomponent systems, are more expensive than standard Pwave systems, but may allow for increased operational efficiency by reducing the amount of personnel and time in the field. This increased efficiency often offsets some of the additional costs associated with multicomponent recording.In order to realize increased operational efficiency, acquisition planners must balance the source to receiver ratio of seismic projects to optimize crew productivity. Increased productivity results in less time spent in the field, thereby reducing cost. Depending on the environment, single station MEMS-based systems can provide more than a twofold increase in station movement relative to conventional six element geophone arrays. This will increase productivity, provided the project is not “source-limited”. Asourcelimited project is one that restricts the crew’s ability to consistently move receiver stations. Take, for example, a Vibroseis project with a one to one receiver to source ratio. If the crew is capable of “rolling” (picking up and laying out) 300 stations a day, it is theoretically possible to record 300 source points per day. However, if due to sweep length and listen time, it is only possible to actually record 200 source points per day, the crew misses the opportunity to record 100 additional points. Project economics suffer accordingly. Extended listen time required for converted-wave recording may also hinder the ability to reduce field time on certain Vibroseis operations. If a P-wave project has a five second listen time, converted-wave recording will require approximately eight seconds of listen time. The additional three seconds of listen time, on a project with 10,000 source points and eight sweeps per point, will increase the project length by approximately 67 hours of recording time.
When acquisition planners are calculating crew productivity, they consider the number of stations an individual will move in a day. This can vary dramatically due to terrain conditions, the number of geophone array elements, array complexity, and other factors. A single MEMS sensor deployed in a pre-drilled hole will require less time and effort to move than a geophone array. This can result in a reduction of geophone layout and pickup crew personnel, thus lowering exposure and offsetting cost.
The following section will provide evidence that it is typically the ratio of P-wave recording cost to overall project cost that is most informative in determining what the percentage increase in price will be for converted-wave acquisition on a given project.
The “Acquisition Pie”
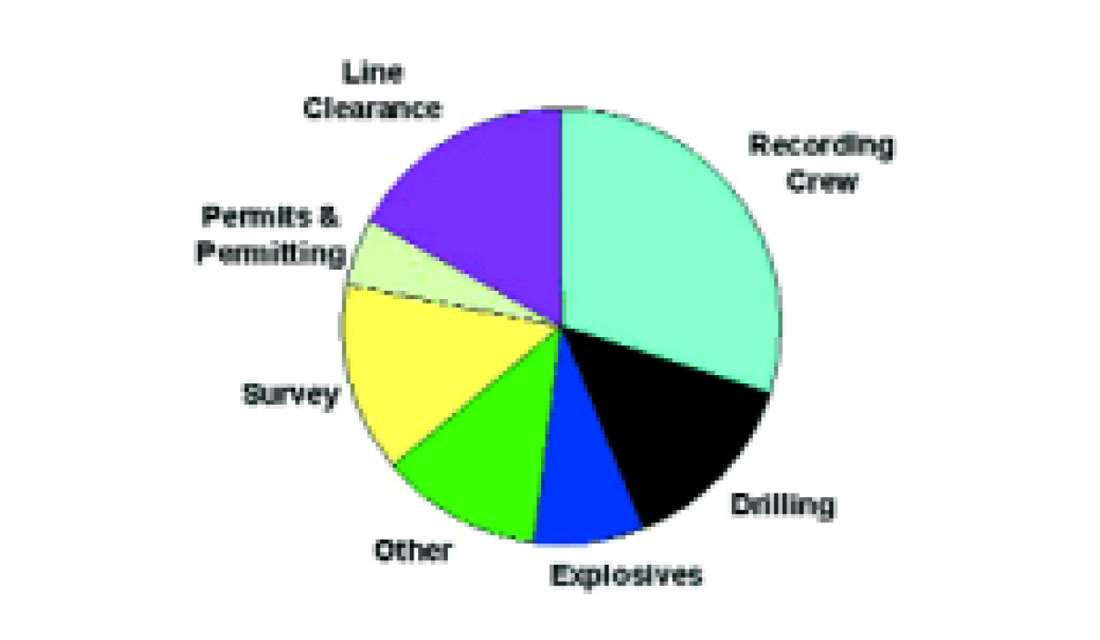
Figure 6 provides a pictorial representation of the typical constituent activities for a seismic acquisition project using a dynamite source. We’ll refer to this as an “acquisition pie”. The size of each component reflects its percentage of the total project cost. Subsequent figures provide specific percentage distributions showing the cost breakdown of two acquisition projects.
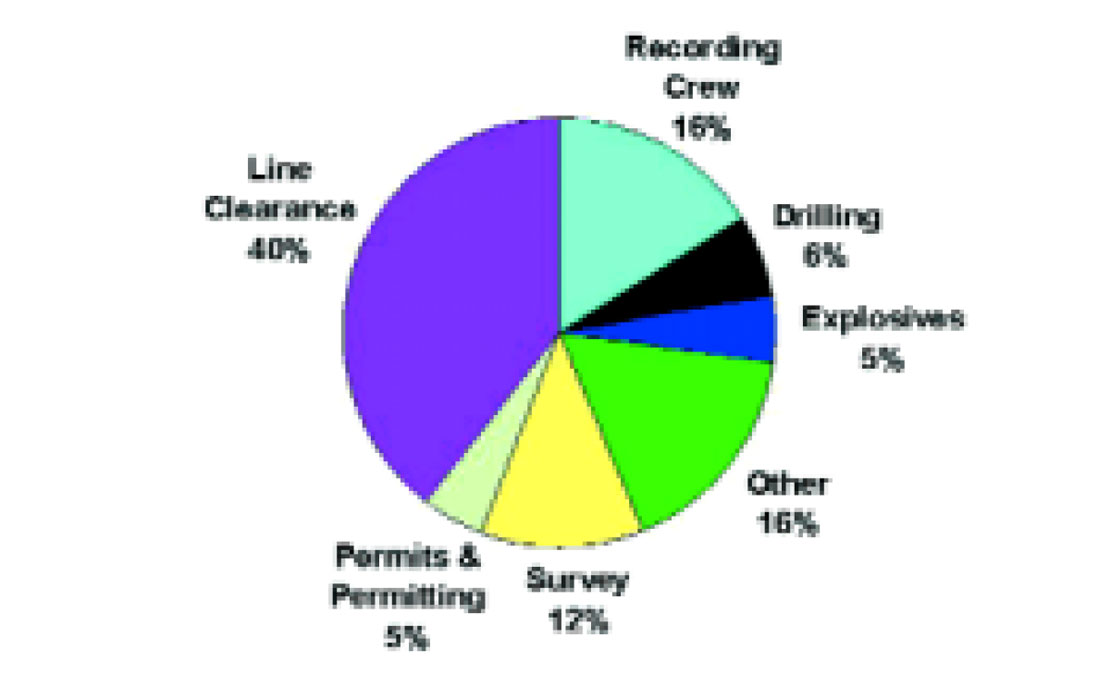
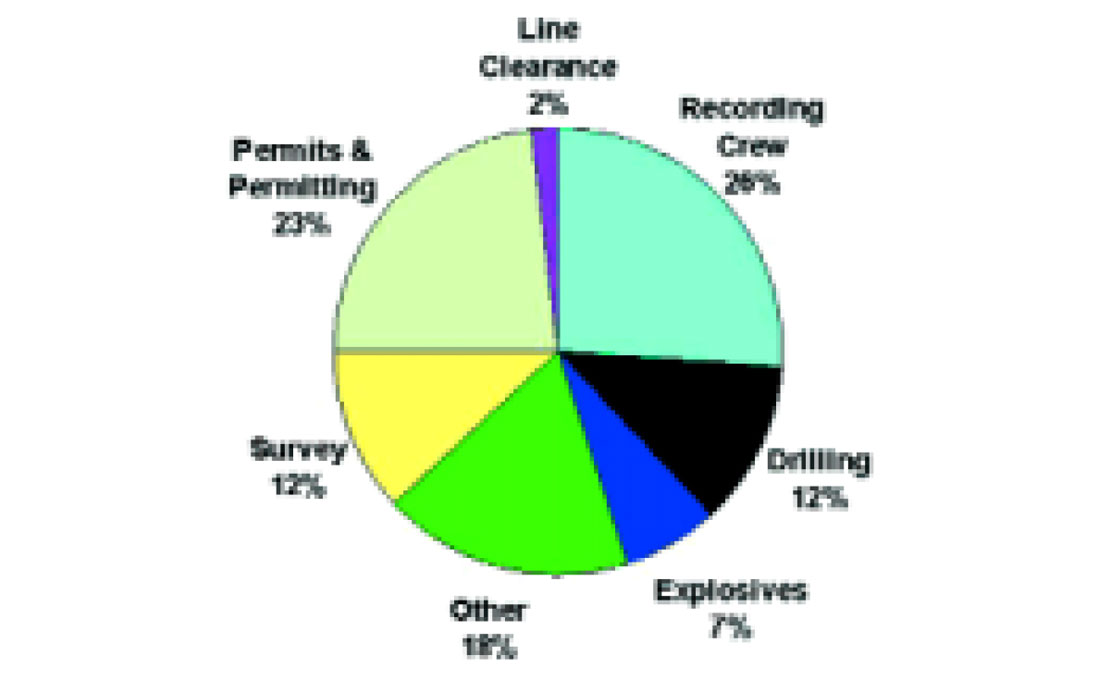
Figures 7 and 8 provide example pies for projects having relatively low and high recording costs, corresponding to relatively high and low project preparation costs, respectively. Conversion of these projects to multicomponent projects will result in more significant percentage cost increases for the project described in Figure 8 due to the fact that recording is a larger percentage of the overall project cost. The percentage increase is quantified in the next section.
The Cost Model
A project cost model for comparing P-wave and converted-wave acquisition costs is given by:
CWC(%) = S(wS) + P(wP) + D(wD) + E(wE) + R(wR) +L(wL) + O(wO)
where CWC = converted-wave cost (as a percentage of P-wave cost), S, P, D, E, R, L and O denote the fractional project costs (in %) for surveying, permits and permitting, drilling, explosives, recording, line clearance and “other”, respectively, and wS, wP, wD, wE, wR, wL, and wO denote weights assigned to each activity reflecting increased or decreased costs relative to P-wave recording. In this representation, “other” includes costs such as helicopter, weather, damages, trucking and any miscellaneous costs. If there are no changes in cost, all weights equal one and CWC(%) = 100%, with no cost change from the original P-wave survey.
As an example, assume that Figure 7 provides the percentage cost breakdown for a P-wave project. If the only change made is replacing each geophone receiver array with a MEMS multicomponent point receiver (Figure 9, Option 1), then only the recording cost should increase. Therefore, all weights are 1 except for wR.
Assuming wR = 1.4:
CWC(%) = 12(1) + 5(1) + 6(1) + 5(1) + 16(1.4) + 40(1) + 16(1) = 106.4%,
so there is a 6-7% increase in project cost for converted-wave recording relative to P-wave recording in this case.
P-wave/Converted-wave Cost Examples
One option in designing a converted-wave project is to utilize the intended P-wave design and replace each geophone array by a single MEMS 3C sensor (Figure 9, Option 1). Our experience indicates that such a modification often produces only a 5-10% increase in the P-wave cost for dynamite acquisition. This compares very favorably with the historical premium of 35%.
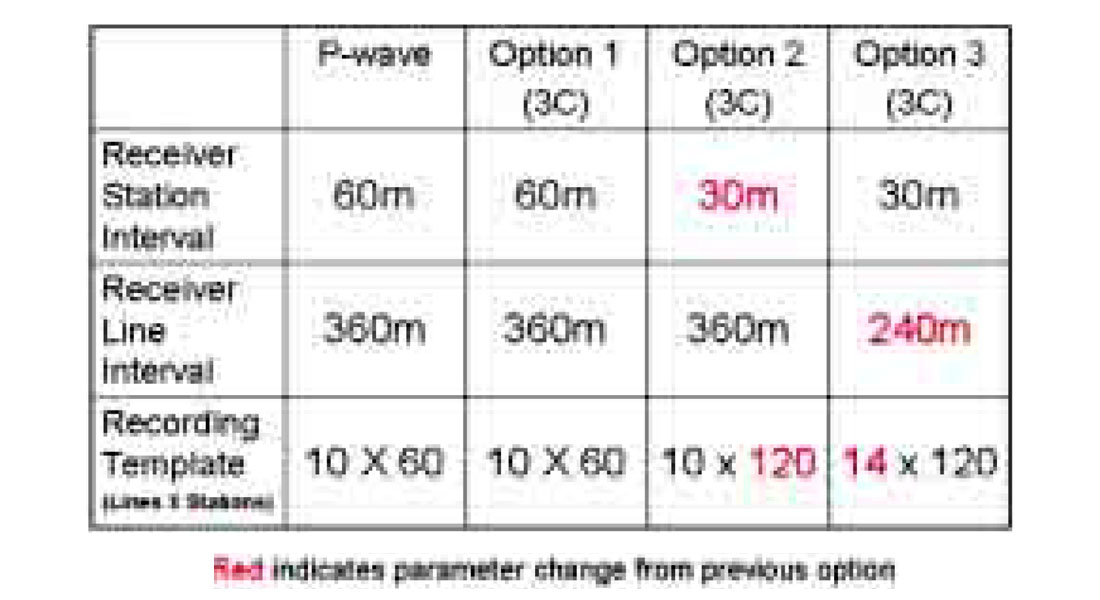
The modification indicated above will not be the preferred approach in many instances. As noted earlier, it may be prudent to employ a modified design in order to extract more information from the converted-wave data and to address signal-to-noise (S/N) issues. Figure 9 provides a table with two possible 3C design modifications.
In the examples which follow, the intent is to provide some sample cost calculations for scenarios involving a dynamite source. Variability in some of the assigned weights is a function of changing geographic areas and operating conditions. Although these are representative examples, actual costs may vary depending on particular circumstances.
Example 1
Consider the costs associated with a multicomponent project for which the receiver station interval is halved in the inline direction of the original project (Figure 9, Option 2). This would allow for either a higher fold project, or a data volume with improved spatial resolution, depending on the binning choice.
Assume the model in Figure 7 and that surveying costs increase by 20%, recording costs by 100% and “other” costs by 40% relative to the initial P-wave project. Then, in this example with high frontend costs:
CWC(%) = 12(1.2) + 5(1) + 6(1) + 5(1) + 16(2) + 40(1) + 16(1.4) = 124.8%,
producing an approximate 25% increase over the cost of the initial P-wave project. This is well below the historical premium of 35% for multicomponent acquisition and the modified design provides improved sampling or higher fold upon superbinning.
Example 2
Consider now a project where front-end costs are less burdensome or, correspondingly, recording costs represent a larger percentage of the “acquisition pie”. Assume the model shown in Figure 8 and the redesign described in Option 2 of Figure 9, with a 30% increase in surveying and “other” costs and an increase of 120% in recording. Then:
CWC(%) = 12(1.3) + 23(1) + 12(1) + 7(1) + 26(2.2) + 2(1) + 18(1.3) = 140.2%,
thus producing an approximate 40% increase in cost relative to a Pwave project. Note the important influence of the recording percentage in this calculation. There may well be an area dependence of wR owing to issues of crew productivity.
A project employing Option 3 in Figure 9 will, of course, be more costly because of the reduced receiver line spacing, necessitating an increased number of receiver lines. Such a design provides an increase in fold as well as improved offset and azimuth statistics for both P-wave and converted-wave processing and analysis. There can be such variability in the cost of these more aggressive designs that a given example may only serve to mislead rather than inform. Where there are pronounced signal-to-noise concerns or a need for improved statistics for analyses to be conducted, a bid for such an option might be sought, noting that such an option is far more economically realistic that in the past.
In many situations, improved converted-wave designs providing distinct advantages can be utilized at costs that compare very favorably with historical premiums associated with no design change (from the P-wave project). Where simply replacing geophone arrays by single MEMS 3C sensors is acceptable, the premium is often less than 10%. Ultimately, a decision in favor of converted-wave acquisition should be based on the value expected from the inclusion of shear information. Ademonstration of value has now become easier with the more attractive costs for converted-wave acquisition.
Conclusion
Purpose-built multicomponent acquisition systems employing MEMS-based digital accelerometers have increased operational efficiency and, in turn, helped reduce multicomponent acquisition costs. This, coupled with significant advances in the processing and interpretation of converted-wave data, has enhanced the attractiveness of these data in mitigating risk and creating new E&P opportunities.
Converted-wave data provide an array of potential applications ranging from corroborating P-wave results to providing solutions where P-wave data alone are inadequate. More competitive acquisition costs now make multicomponent exploration viable in the quest for enhanced subsurface information.
Most explorationists would understandably prefer to assess the applicability of multicomponent technology in their own area of interest. With modern acquisition equipment, it is a straightforward and cost-effective procedure to embed a converted-wave test program within a conventional P-wave project to make an assessment of potential value. This approach is increasingly gaining favor in the industry.
3D seismic projects often require significant expenditures in time and money prior to recording. Given this investment it is prudent to gather as much subsurface information as possible while in the field. For any proposed 3D seismic project, it is sensible, to at least compare the economics for converted-wave versus P-wave recording as well as consider the nature of the E&P problem(s) in the area in order to judge the appropriateness of converted-wave acquisition.

Imagine seismic imaging as being analogous to photography. P-wave imaging produces very good black & white photos. One can ascertain the structure of objects, particularly the contrasts at their edges. In the black & white photo of Figure 10, one can tell a great deal about the trees in the forest, inferring different tree types on the basis of limb structure and leaf pattern. The color photo, analogous to multicomponent imaging, provides more direct information for our goal of finding, say, red leaves. This illustrates the potential value of multicomponent seismic data.

Acknowledgements
The authors are indebted to several individuals/companies for their assistance in the preparation of this article. OutSource Seismic Consultants provided information on permit and other advance costs. Linda Manning, Jeff Mackie and Vince Parker at Veritas DGC Land provided important information for the cost models. We particularly thank Virginia Simmons for manuscript preparation, Ron Sfara for his review and very helpful suggestions and Megan Rose for her help with the figures. We also acknowledge Cam Wason, former Director of R&D for Geophysical Services Incorporated, as the author of the photographic analogy for Pwave and S-wave imaging.


Join the Conversation
Interested in starting, or contributing to a conversation about an article or issue of the RECORDER? Join our CSEG LinkedIn Group.
Share This Article