Electromagnetic (EM) methods were originally developed for mineral exploration owing to the large contrast in electrical resistivity between many ore bodies and the host rock. They have subsequently found application in a range of fields including geothermal exploration, hydrogeology and environmental geophysics. In addition to applied studies, EM methods are widely used in research that investigates the structure of the crust and mantle with the goal of understanding the processes that have formed the modern continents. For these deeper studies, the most appropriate EM method is magnetotellurics (MT) which uses natural low frequency radio signals as the energy source. Recent advances in the MT method have allowed crustal resistivity structure to be reliably imaged in three dimensions and has given new insights into the processes that occur at plate boundaries. In addition, MT studies can be used to study past tectonic processes through studies of continental interiors that were assembled by past plate movements. In this article, advances in the MT method are described and the results of two recent MT studies in Western Canada are summarized.
Magnetotelluric imaging of subsurface resistivity
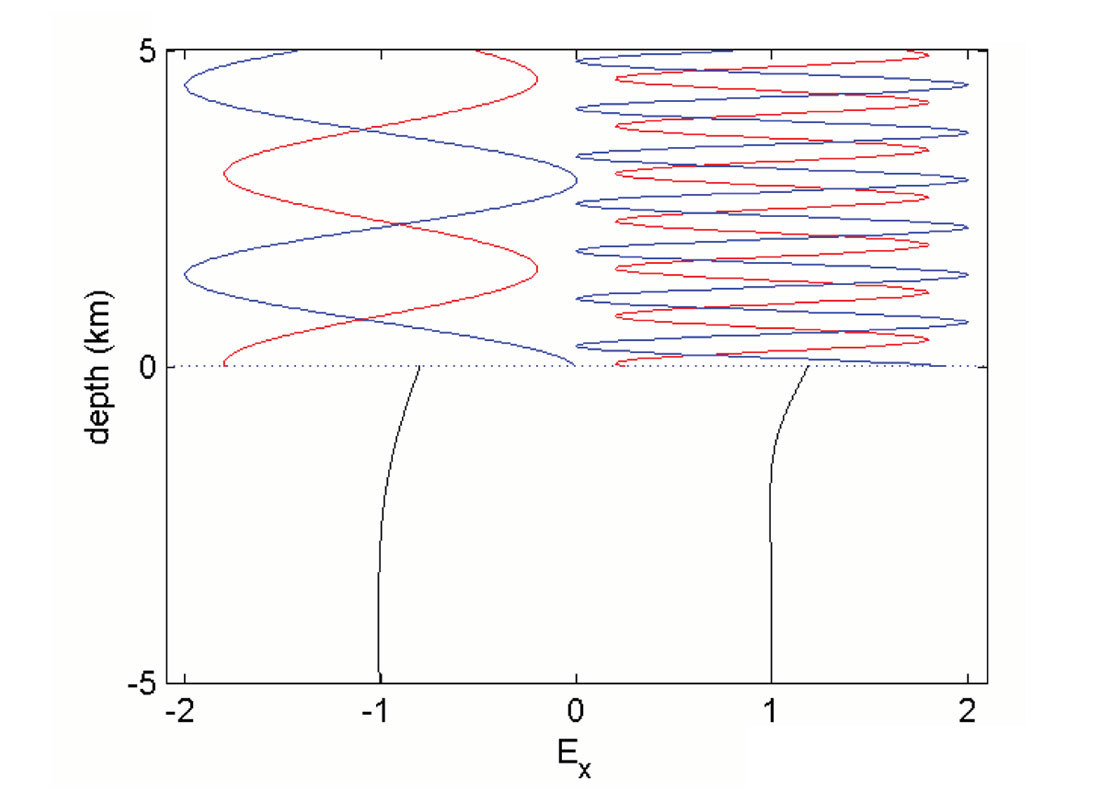
Shallow electromagnetic exploration uses a transmitter to generate the signals that can image the subsurface resistivity, and recent advances in these methods are described in several of the articles in this issue. These methods suffer from the limitation that it is difficult to generate sufficiently strong signals for imaging resistivity at depths greater than 1-2 km. The magnetotelluric method is able to work at greater depths since it uses relatively strong, naturally occurring EM signals. Above a frequency of 1 Hz these signals originate in global lighting activity, while at lower frequencies they are generated by interactions between the magnetosphere and the solar wind. This is illustrated in Figure 1 where incident EM waves at two frequencies are shown in blue. Most of this energy is reflected, but a small amount is transmitted and travels downwards into the Earth. Mathematical analysis shows these signals diffuse vertically downwards in the Earth and sample resistivity structure to a depths that is inversely proportional to the signal frequency. Through the skin-depth effect, measurements of multiple frequencies gives a depth sounding of the electrical resistivity. Thus mineral exploration of near surface structure uses high frequencies in the range 1000 – 1 Hz, while studies that sample the lower crust and upper mantle use frequencies as low as 0.0001 Hz.
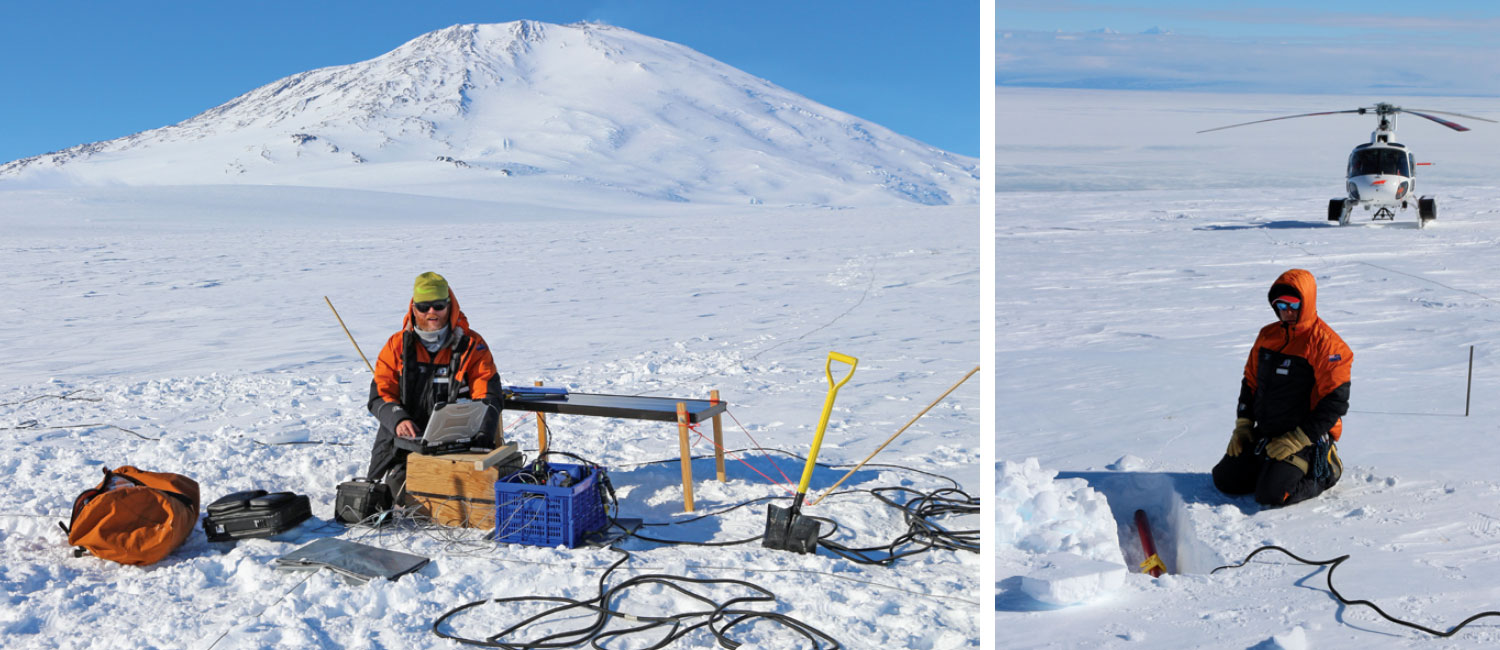
MT instruments measure time variations of EM signals at the surface of the Earth. The electric fields are measured by dipoles 100-200 m in length connected to the ground with either porous pot electrodes or metal plates. The magnetic fields are generally measured with induction coils, and at low frequencies fluxgate magnetometers are used. When originally developed in the 1960s, MT instruments were very cumbersome and it was not possible to collect a large number of MT stations, or to work in rugged terrain. This continued into the 1980s and full potential of MT exploration was not utilized. Since that time, a number of improvements have taken place and has allowed larger MT data sets to be collected. These developments have included smaller instrument size, reduced power consumption, the use of GPS signals for accurate timing of multiple instruments and the growing capacity of data cards. Figure 2 shows a commercial MT system in use during a recent research project in Antarctica.
Over the last twenty years, major improvements have also occurred in the data processing techniques for MT. Converting the time series of electric and magnetic field variations into the frequency domain requires the use of advanced signal processing techniques to effectively separate the MT signals from electromagnetic noise originating in a range of sources including power lines, electric railways, water pumps and electric fences. Once MT data have been transformed to the frequency domain, forward modelling or inversion can be used to convert the measured MT data into a model of the Earth, with resistivity as a function of depth. This is analogous to seismic data processing where travel time must be converted into depth. In the 1970’s, MT data analysis was generally limited to a 1-D approach which suffered from many limitations. This included the fact that the resistivity structure of the Earth was rarely so simple. MT data analysis moved into 2-D in the 1980s and this allowed profiles of MT data to be converted into resistivity models with a range of inversion algorithms. However a 2-D analysis required that the strike direction was determined, and a range of methods were developed. This research showed that MT data are often distorted by near surface, small-scale resistivity structure. These distortion effects are analogous to statics in seismic reflection data, and are also an example of spatial aliasing of data. In the last 10 years, the combination of (a) larger MT stations collected with modern instruments on a grid and (b) the introduction of 3-D inversions on high-performance computer clusters has allowed MT to reliably produce 3-D images of subsurface resistivity.
Resistivity of the crust and upper mantle
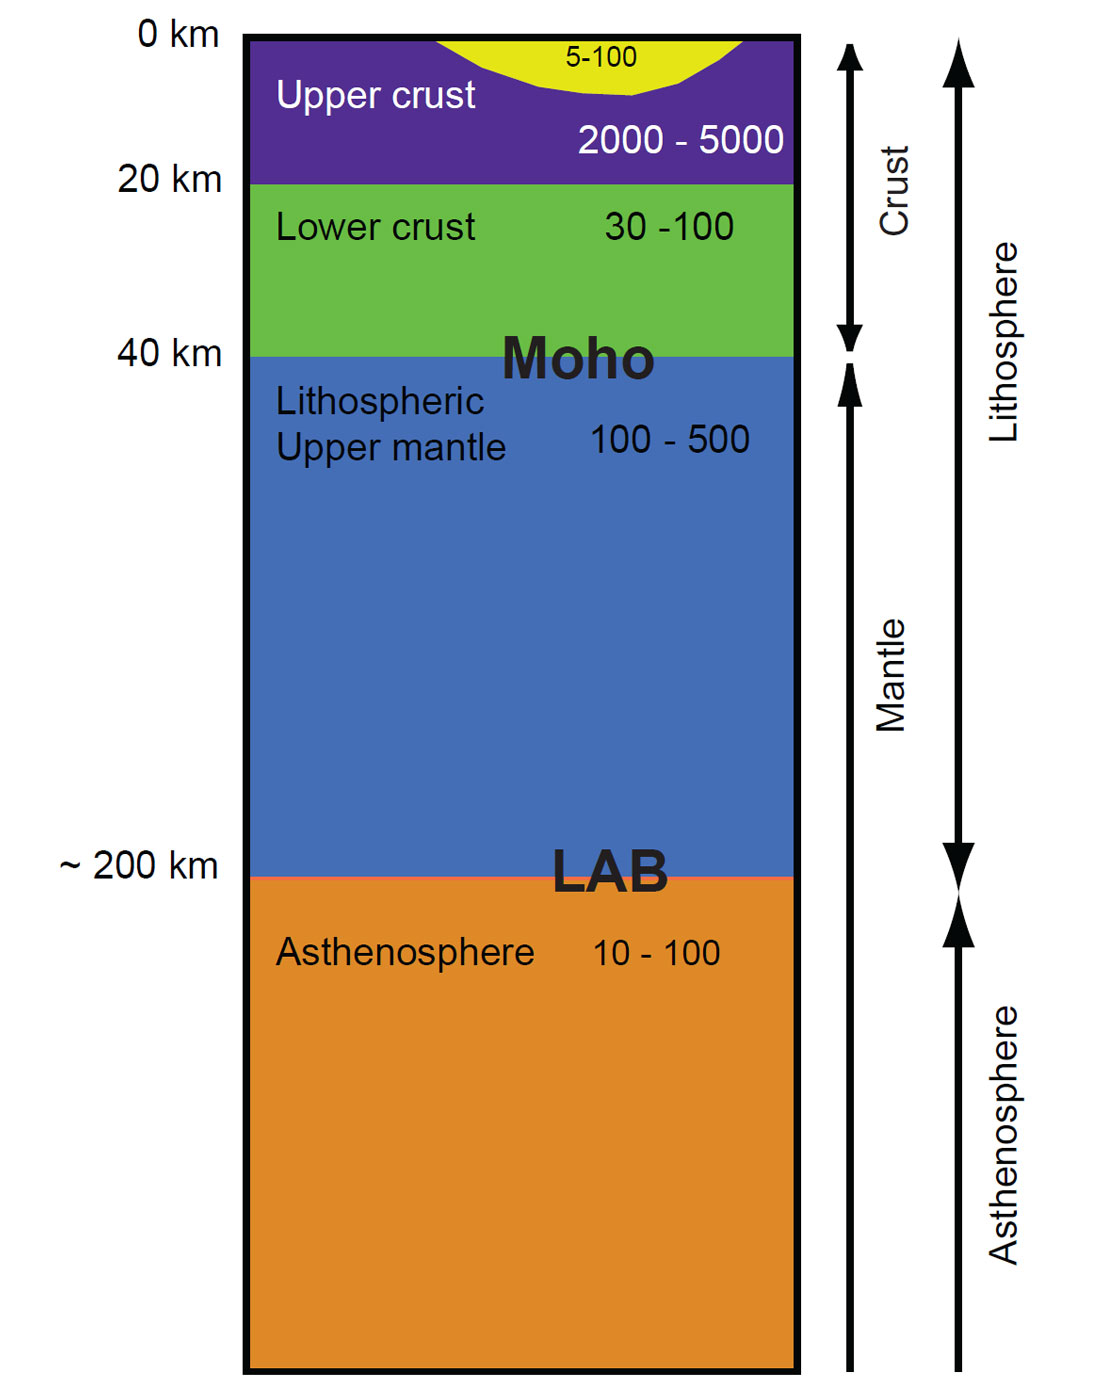
Before considering the resistivity structure of plate boundaries, it is useful to review the structure of stable continental lithosphere. A typical cross section through the crust is shown in Figure 3. Sedimentary basins are characterized by relatively low resistivity values, owing to the presence of aqueous fluids in the pore space. The upper crust is generally highly resistive owing to presence of dry, relatively cold crystalline rocks. In contrast the lower crust exhibits a lower resistivity whose origin is still unresolved. The leading theories are aqueous fluids or graphite films, and given the lack of direct borehole data from these depths, this question may take a long time to resolve (Yardley and Valley, 1997; Wannamaker, 2000). Unlike seismology, there is no well defined change in resistivity at the Moho, although this transition is difficult to resolve with MT data (Jones, 2013). The underlying upper mantle has an intermediate resistivity that is likely controlled by the diffusion of hydrogen within olivine, with the hydrogen originating from the dissociation of water molecules at high temperature. In contrast to the Moho, the lithosphere-asthenosphere boundary (LAB) is associated with a major decrease in resistivity, likely due to the presence of water that may generate small amounts of partial melt (Eaton et al., 2009).
This reference resistivity model is not present everywhere beneath the continents, and a number of major resistivity anomalies have been identified from MT data collected in recent decades. A number of these are associated with present day plate boundaries, such as the Tibetan Plateau. This is the type example of a continent-continent collision and is characterized by a low resistivity layer in the crust that is believed to be due to the presence of 5-10% partial melt (Unsworth et al., 2005). In this article, two examples of MT studies in Western Canada by the University of Alberta are presented. One considers a region of active tectonics in the Cascadia subduction zone and the other is a study of the Pre- Cambrian plate tectonics that assembled North America in the Proterozoic.
Subduction zones and the Canadian Cordillera
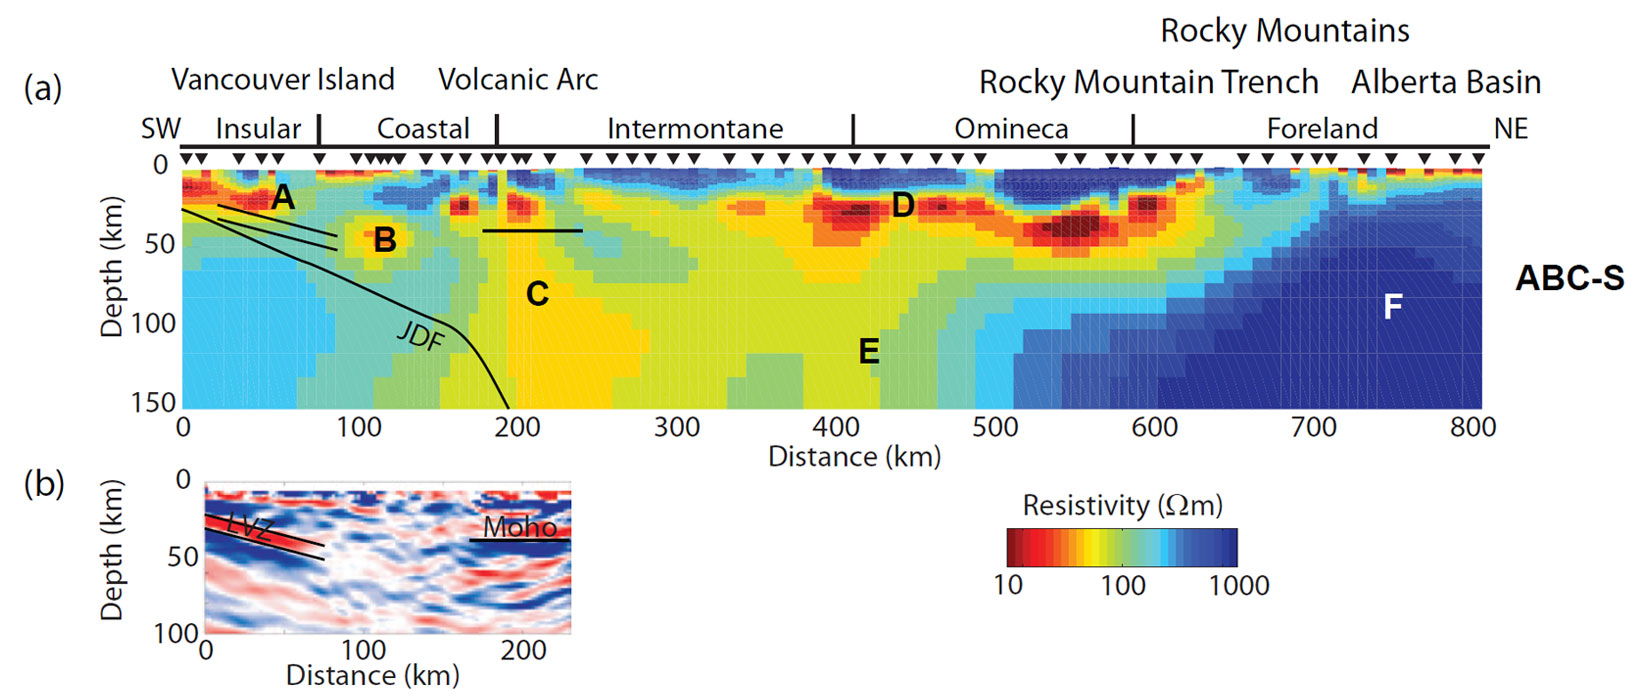
Subduction zones are found where two tectonic plates converge, and one descends into the mantle. They are the location of many active volcanoes, and generate many of the most destructive earthquakes. In terms of global tectonics they are significant because they transport water from the surface into the mantle. The addition of water changes the composition of the mantle and controls many geodynamic processes. The addition of water lowers the melting point of the mantle, and this generates the volcanic arcs that define subduction zones. The addition of water also decreases the strength of the mantle and may be a necessary condition for mantle convection and by implication, plate tectonics. Studies of the Cascadia subduction zone in British Columbia have shown that a combination of MT and seismology is highly effective for mapping crustal and upper mantle structure, and for defining fluid distribution. Figure 4 summarizes the results of a major MT transect that extended from Vancouver Island to Rocky Mountain House, Alberta (Rippe at al., 2014). The MT data analysis showed that a 2-D interpretation was valid, and the inversion algorithm of Rodi and Mackie (2001) was used to generate the resistivity model in Figure 4. Seismic studies revealed the location of the subducting Juan de Fuca (JDF) plate and the MT shows that this is overlain by a low resistivity layer (A) caused by water expelled from the subducting plate. To the east a low resistivity zone (B) is found in the mantle wedge and is also due to fluids released from the down going plate. The volcanic arc is underlain by a low resistivity zone (C) that originates just above the JDF plate and is due to melt generated as water from the slab lowers the melting point of the mantle. This model is one of the first to trace the melt from the slab where it originates to the volcanic arc where it is erupted. To the east the upper mantle has an unusually low resistivity (E) which is interpreted as asthenosphere, overlain by a low resistivity, fluid rich crust (D). East of the Rocky Mountain Trench, there is a dramatic increase in resistivity associated with the thick, cold lithosphere of the North American craton (F). This is overlain by the low resistivity layer of sedimentary rocks of the Western Canada Sedimentary Basin (WCSB).
Studies of ancient tectonics
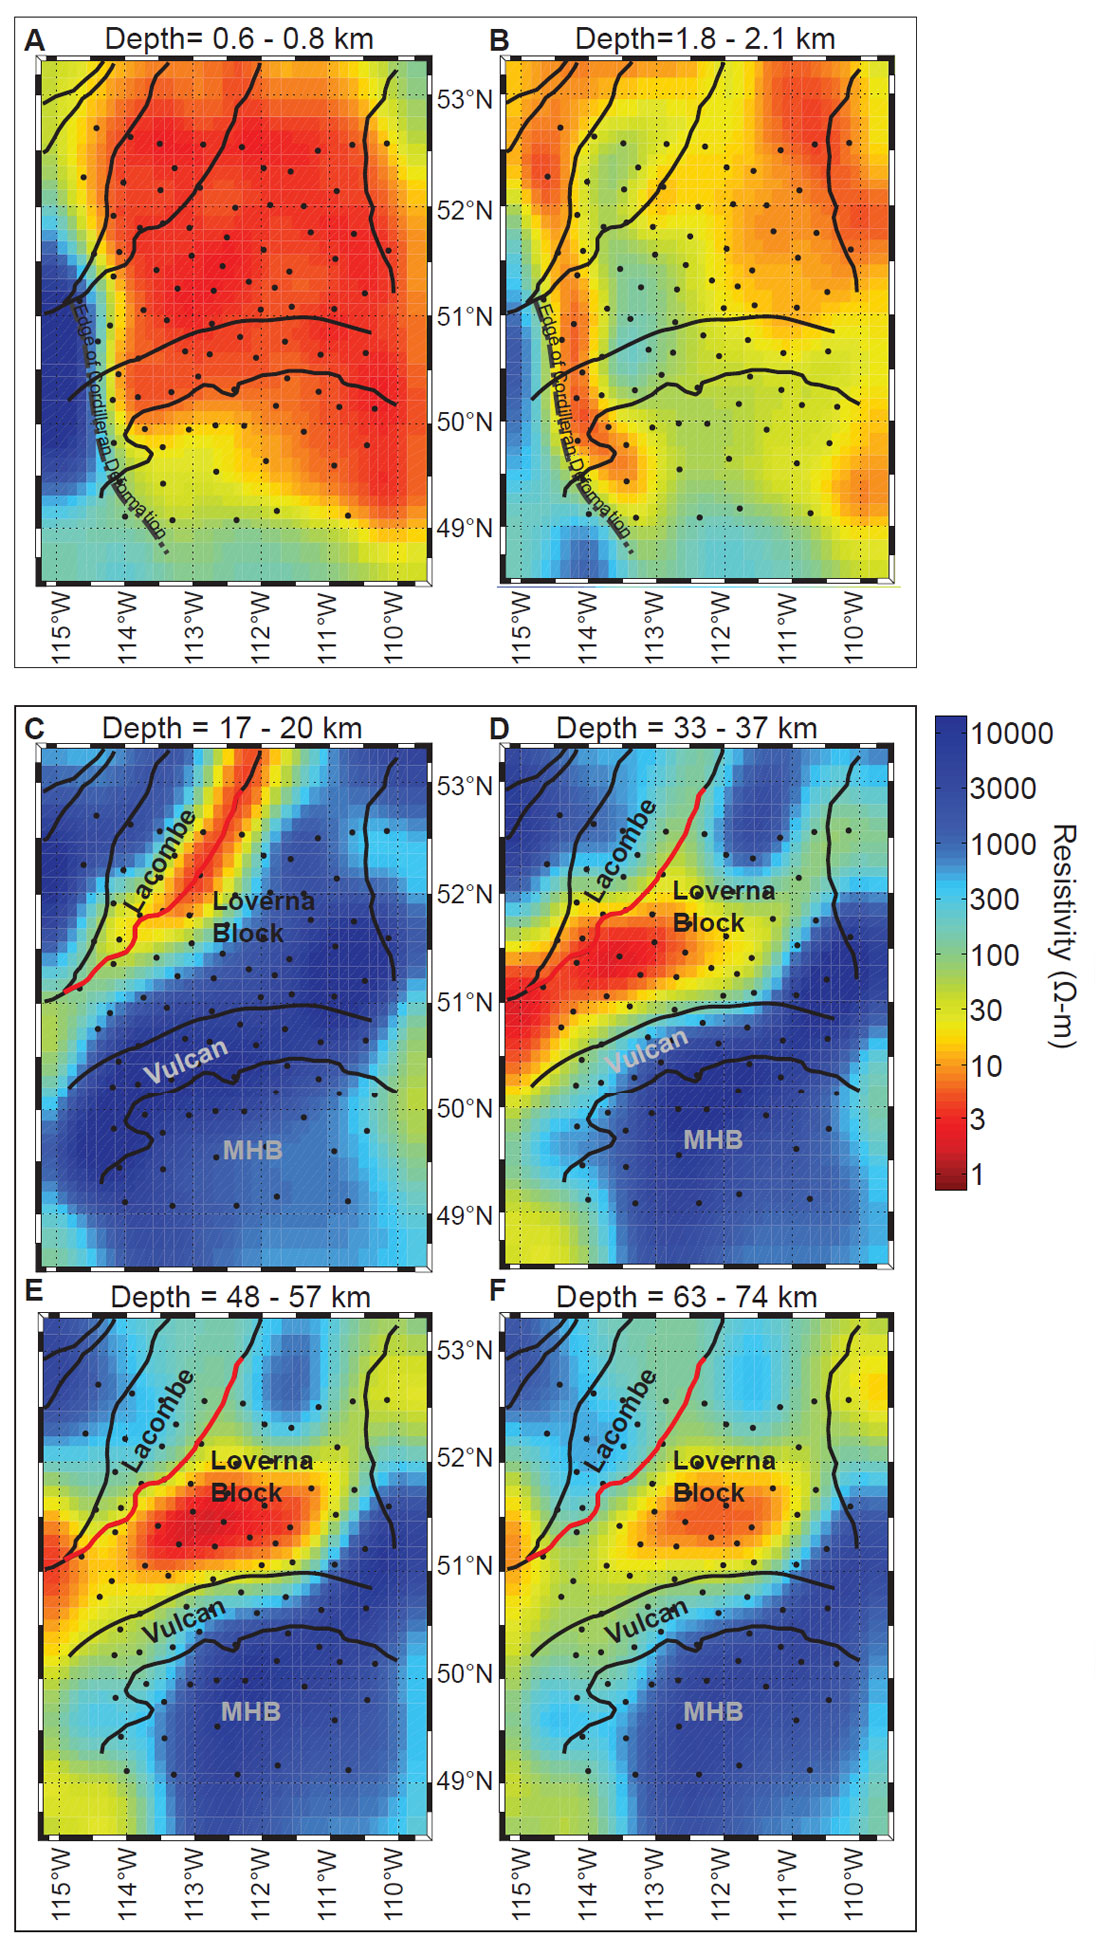
Few today would deny that plate tectonics occurs on Earth, and provides a global framework to explain many diverse phenomena. However the time at which plate tectonics began is still unresolved with estimates varying over more than 2 billion years. Geophysical studies of the most ancient parts of the continents can allow us to understand how the continents were assembled, and perhaps give clues about the style of plate tectonics in the past. Western Canada provides an excellent location for this type of study, with a history of continental growth extending back to the Archean. In many areas, the Precambrian rocks of the Canadian Shield are exposed at the surface, while on the platform they are located beneath the rocks of the WCSB. MT is able to image beneath the sedimentary layer and more than 30 years of research has gradually revealed the characteristics of the underlying crystalline rocks. The Lithoprobe project made significant progress in studies of the Alberta basement (Boerner et al., 2000) and suggested that there might be systematic variations in the resistivity of the lithosphere according to the age. These studies used a 2-D inversion approach, and encountered challenges in interpreting some aspects of the MT data. More recently, research at the University of Alberta has sought to extend the network of Lithoprobe profiles into a 3-D grid of MT stations. With funding from both the federal and provincial governments as part of the GEMS project, this work is now complete for Southern Alberta. Data analysis showed that a 2-D inversion was not appropriate, so Nieuwenhuis et al., (2014) undertook a 3-D inversion of an array of MT stations in southern Alberta using the algorithm of Siripunvaraporn et al., (2005). In Figure 5, depth slices A and B sample the low resistivity rocks of the WCSB. Slice C samples the mid-crust and images a major low resistivity zone on the eastern edge of the Loverna block. This has been named the Red Deer conductor and is believed to be due to graphite films deposited in a euxinic basin during an episode of subduction in the Paleoproterozoic (Boerner et al., 2000). At greater depths the 3-D model shows that the upper mantle beneath the Archean age Loverna block has an unusually low resistivity – much less than expected for the upper mantle. The simplest explanation for this feature is that Paleoproterozoic collisions, driven by subduction, transported graphite and sulphide minerals into the upper mantle. Nieuwenhuis et al., (2014) show that the geometry of the Loverna Block conductor may imply that north dipping subduction occurred as the Medicine Hat Block and Loverna Block were joined to form the Vulcan Structure. MT studies of the continents to depths greater than 200 km may have the potential to guide diamond exploration, since they can constrain the thickness of the lithosphere and potentially identify regions of the mantle with an elevated carbon content. Both these characteristics are important in determining if diamonds could be present (Jones and Craven, 2004).
Conclusions
The advance to a 3-D approach has represented a major advance for magntotelluric exploration, both in pure and applied studies. Commercial exploration studies now regularly collect large grids of MT data for geothermal, mineral and hydrocarbon exploration, and these give a more reliable image of subsurface structure than was possible with a 2-D approach. In several countries academic researchers have collected large MT datasets on a regular grid that cover entire countries or regions. Examples of this include the MT component of Sinoprobe, which has now collected several thousand MT stations in China (www.sinoprobe.org). In the United States, MT data is an important component of USArray, which is a major research project that is systematically deploying an array of broadband seismic, GPS and MT instruments (www.usarray.org). Meqbel et al., (2014) describe the USArray MT deployment in the northwest United States, and these data will be combined with MT data collected in Canada. This type of deployment offer the chance to make unexpected discoveries, as every part of the continent will be systematically studied. Previously, MT data were collected on profiles or limited grids in regions that were considered of interest to answer specific questions.
There is still the need for continued development of the MT method, and encouraging progress has been made in several aspects of MT data analysis in recent years. Progress has been made in dealing with MT data from locations where the rocks are electrically anisotropic. In contrast to seismic anisotropy, which can be of the order of a few percent, electrical anisotropy of crustal rocks can be greater than an order of magnitude. Peacock et al., (2012) describe an example from Australia where fluid injection in a geothermal well produced a detectable change in the MT response at the surface. Detection of time variations in subsurface resistivity structures opens the possibility to use MT as a monitoring tool in many applications. Additional progress has been reported in recent years in the joint analysis of MT and other types of geophysical data. It is significant that several of the papers in this special issue show resistivity models derived from MT data alongside seismic results.

Acknowledgements
The MT data described in this paper were collected with research grants to Martyn Unsworth from NSERC, the Alberta Ingenuity Fund and Canadian Foundation for Innovation. Support from the Alberta Geological Survey and Natural Resources Canada under the GEMS program is also gratefully acknowledged. Many undergraduate and graduate students at the University of Alberta assisted with data collection.
Further reading
For additional details about the MT method the reader is referred to Chave and Jones (2012) for a general overview and detailed bibliography. They are also referred to the notes for a class on EM methods (GEOP424) taught by the author at the University of Alberta, which can be found at http://www.ualberta.ca/~unsworth/UA-classes/index.html


Join the Conversation
Interested in starting, or contributing to a conversation about an article or issue of the RECORDER? Join our CSEG LinkedIn Group.
Share This Article