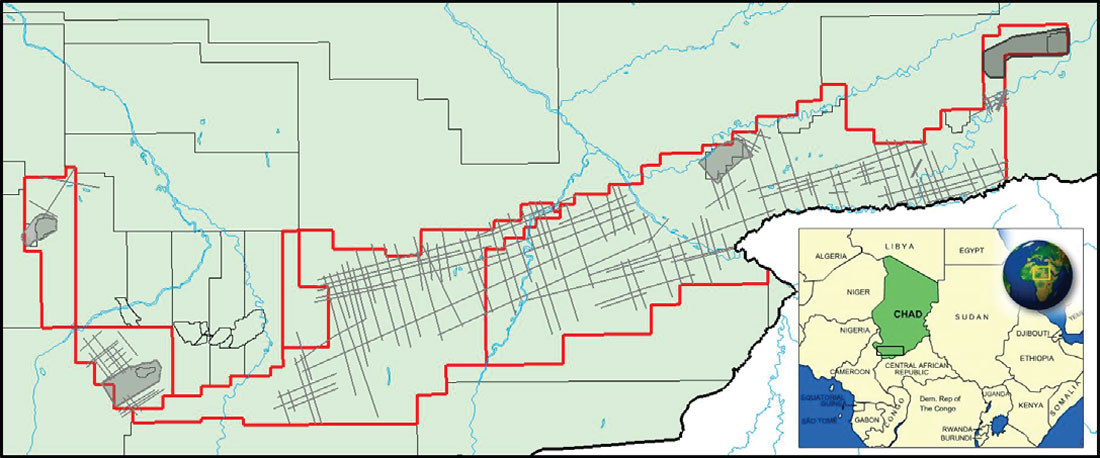
Over the past four years, Glencore has acquired four 3D seismic surveys covering 1200 km2, 216 2D seismic lines covering 4500 km and twenty-three seismic acquisition tests in Chad (Figure 1). Seismic acquisition testing provided tremendous benefit by improving subsurface imaging, increasing operational efficiency and reducing costs. Test results were used to improve operations in real time as data was being acquired, with the cooperation of seismic contractor BGP International (Chad). This paper will provide an overview of the seismic acquisition tests with a specific focus on tests designed to improve imaging in areas with surface laterites/ near surface scatters, which impede imaging.
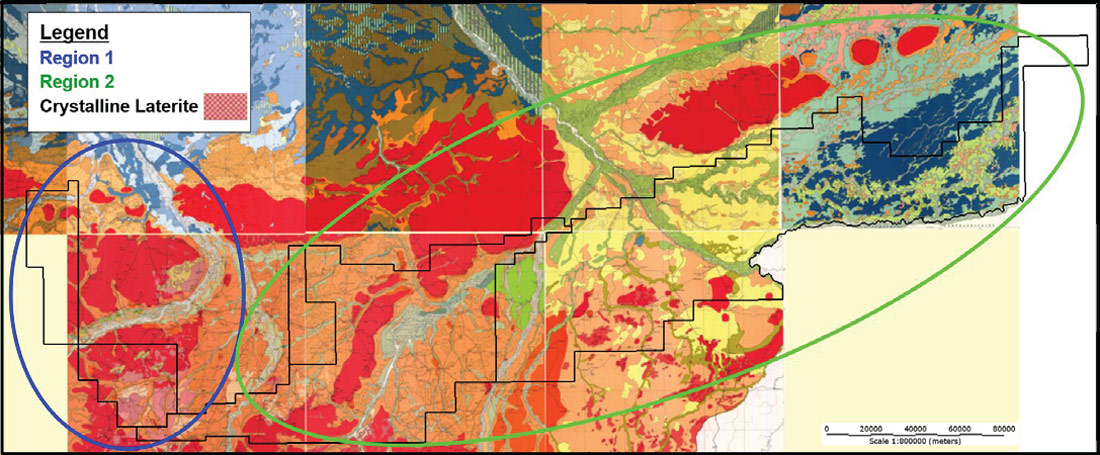
Seismic data acquisition in Chad is conducted using a vibroseis source for logistical reasons. Data quality throughout the area ranges from fair-to-good in the west to excellent in the east. Overall, the quality of data acquired between 2012 and 2015 is superior to previous acquisition programs with better frequency content, improved fault imaging and better reflection continuity at depth. Data quality of previous operator data varied from area to area. Glencore geoscientists observed that surface conditions influenced data quality with higher frequency data (70-80 Hz) obtained in areas with silt and sand versus lower frequency data (55-60 Hz) obtained in areas with surface laterites, as mapped on vintage soil maps.
In order to further improve imaging in areas with surface laterites/near surface scatters, twenty-three seismic acquisition tests were incorporated into the regular seismic acquisition (Fig 2). Twelve of the tests were acquired during the 2013-2014 seismic acquisition season and were used to optimize acquisition parameters for data acquired during the 2014-2015 seismic acquisition season. Eleven tests were acquired during the 2014-2015 seismic acquisition season for optimization of future seismic programs. These tests include eight vibroseis parameter tests, four maximum offset/record length tests, three sweep effort tests, three 2D swaths (adding 50 km of high-resolution subsurface data), two noise tests, one receiver array test, one sweep force test and one 3D cross-spread test, which provided targeted 3D imaging. Most of the acquisition tests were incorporated into the regular seismic acquisition production with little delay or additional cost, so that any potential improvements could be applied immediately.
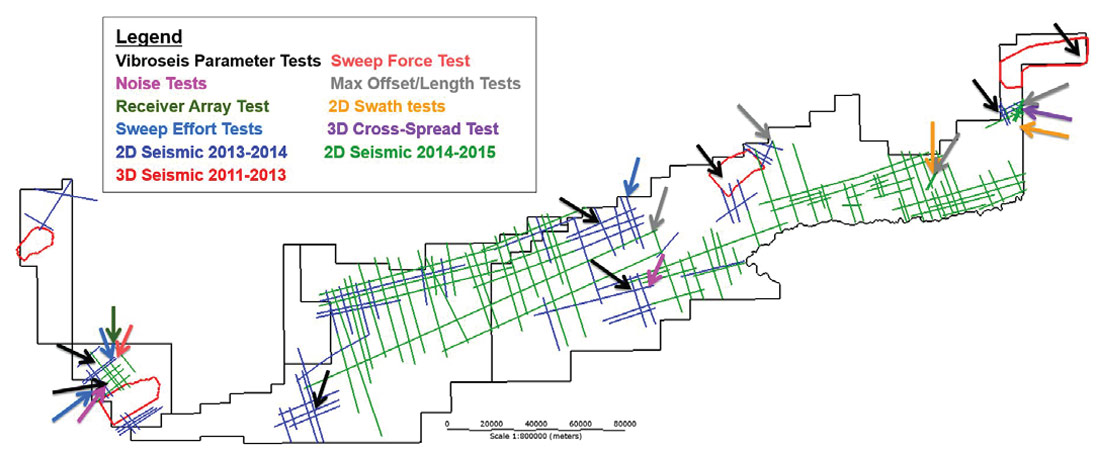
This paper will focus on the tests and results in two areas: Region 1, which has near surface laterites and only fair-to-good data quality; and Region 2, where mixed laterite / laterite free zones resulted in good-to-excellent data quality (Figure 3).
Project Areas
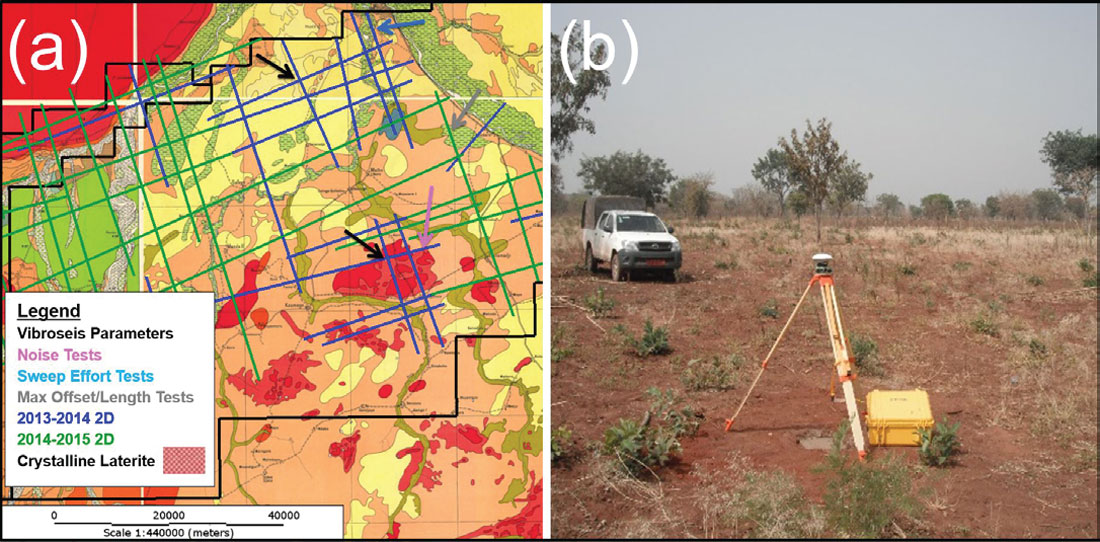
Region 1 area is covered in red, iron-rich clay soils with areas of crystalline laterite at the surface (Figure 4). Laterite is a soil and rock type which is rich in iron and aluminium, and is commonly formed in hot and wet tropical areas. Laterites are typically rusty-red due to high iron oxide content (Wikipedia). Laterite may form chunks and boulders in the subsurface which may act as scatterers. Additionally problematic, vibrator coupling deteriorates in areas with hard laterite at the surface.
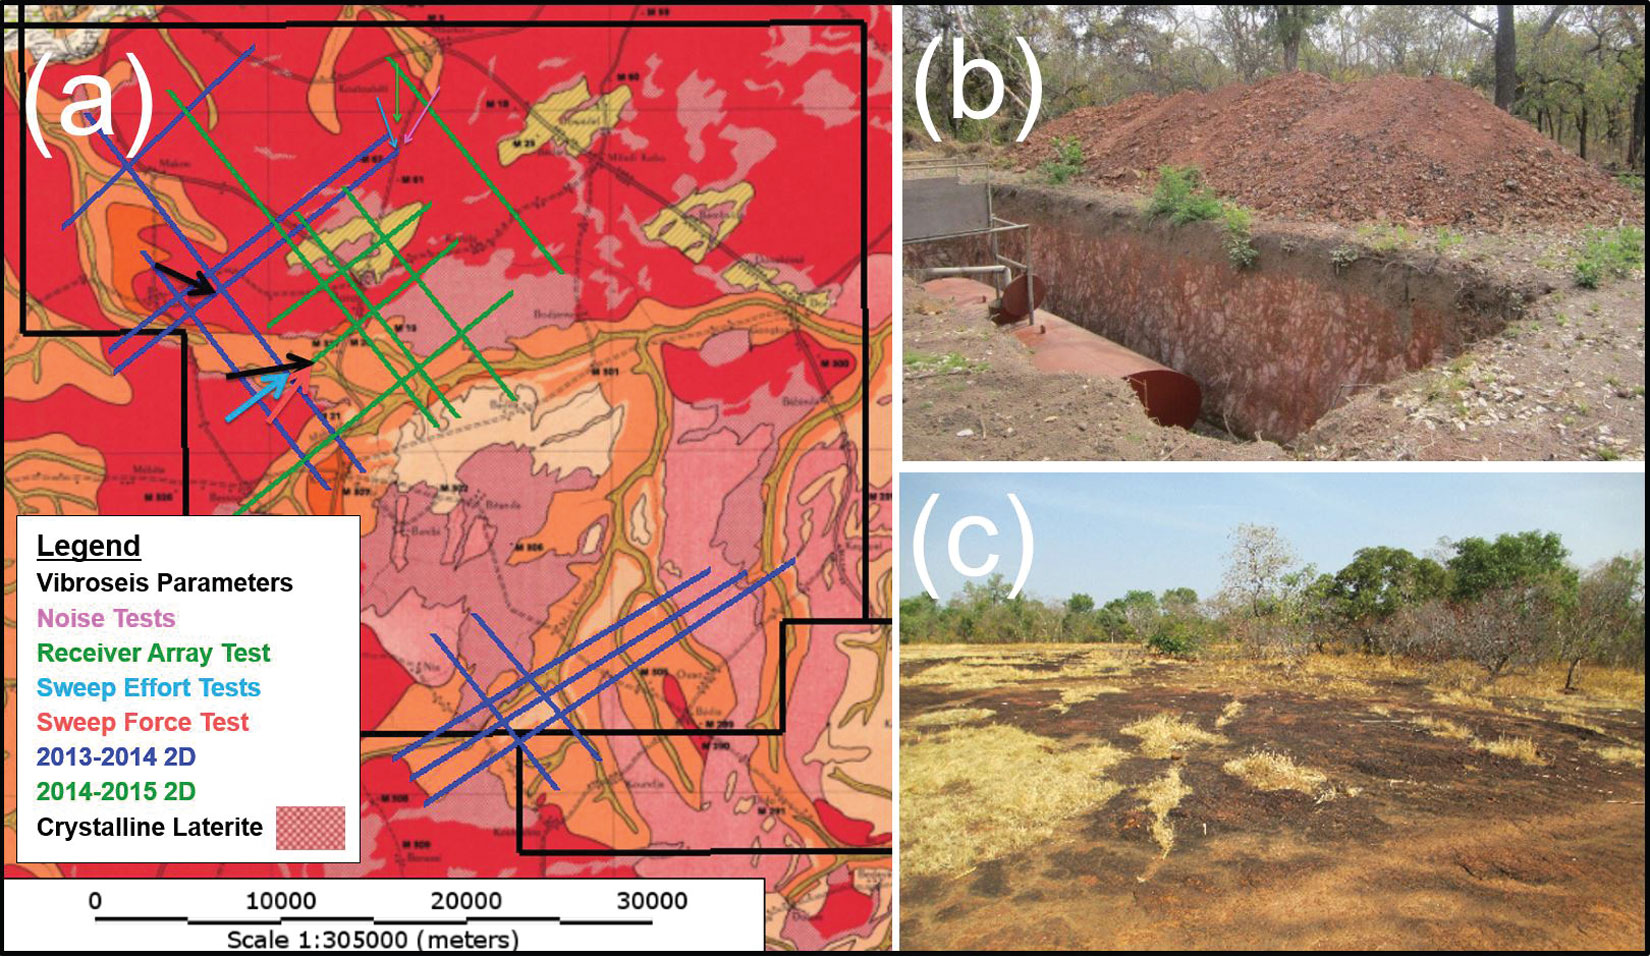
Early seismic programs were hampered by unexpected poor data areas. These poor data areas coincided with crystalline laterite at the surface or in the near surface. Glencore located and used vintage Chadian soil maps (Audry 1966, Barbery 1967, Boucquier 1966, Bouteyre 1967, Marius 1964, Vizier 1969) to anticipate problem areas for data quality, especially where surface crystalline laterite was present. Where possible, lines were located away from potential bad data areas. Acquisition effort was increased in areas where laterite was unavoidable. Overall, data quality in Region 1 is fair to good, with usable frequencies in the 55 to 60 Hz range, and occasionally as high as 80 Hz. Ten seismic lines were acquired in Region 1 during the 2013-2014 seismic acquisition program with four seismic acquisition tests acquired along Line 3. Tests included a vibroseis parameter test, a noise test, a receiver array test, and a sweep effort test. Seven seismic lines were acquired in Region 1 during the 2014-2015 seismic acquisition program with three additional seismic acquisition tests completed on a single line. These tests included vibroseis parameters, sweep force, and sweep effort tests.
Data quality in Region 2, which is highly structured, is excellent, except under large continuous areas of laterite, where the data quality is only good (Figure 5). Away from laterite, 80 Hz continuous reflectors were seen as deep as 3 seconds with excellent imaging. Under laterite, frequencies and signal-to-noise ratio were significantly reduced, with only 50 Hz along reflectors at 2 seconds.
The majority of the Glencore seismic program was acquired in the Region 2, with two 3D seismic surveys and forty-eight 2D seismic lines during the 2013-2014 seismic acquisition program and ninety-four 2D seismic lines during the 2014-2015 seismic acquisition season. Tests in the Region 2 area included a vibroseis parameter tests, a noise test, sweep effort tests, max offset/length tests, 2D swath tests and a 3D cross-spread evaluation.
Vibroseis Tests
Prior to the start of seismic acquisition recording in these areas, vibroseis parameter tests were conducted in the field in order to select optimal sweep parameters for imaging. Test parameters included the following: Sweep Start/End Frequency, Number of Sweeps, Sweep Length, Force (Drive), Sweep Type (Linear vs. Non-Linear), Start/End Taper, Number of Vibes, Vibroseis Array Length, and Vibroseis Move-up between sweeps. The distribution of vibroseis tests across Region 1 and Region 2 provide excellent reference for designing future 2D and 3D seismic programs.
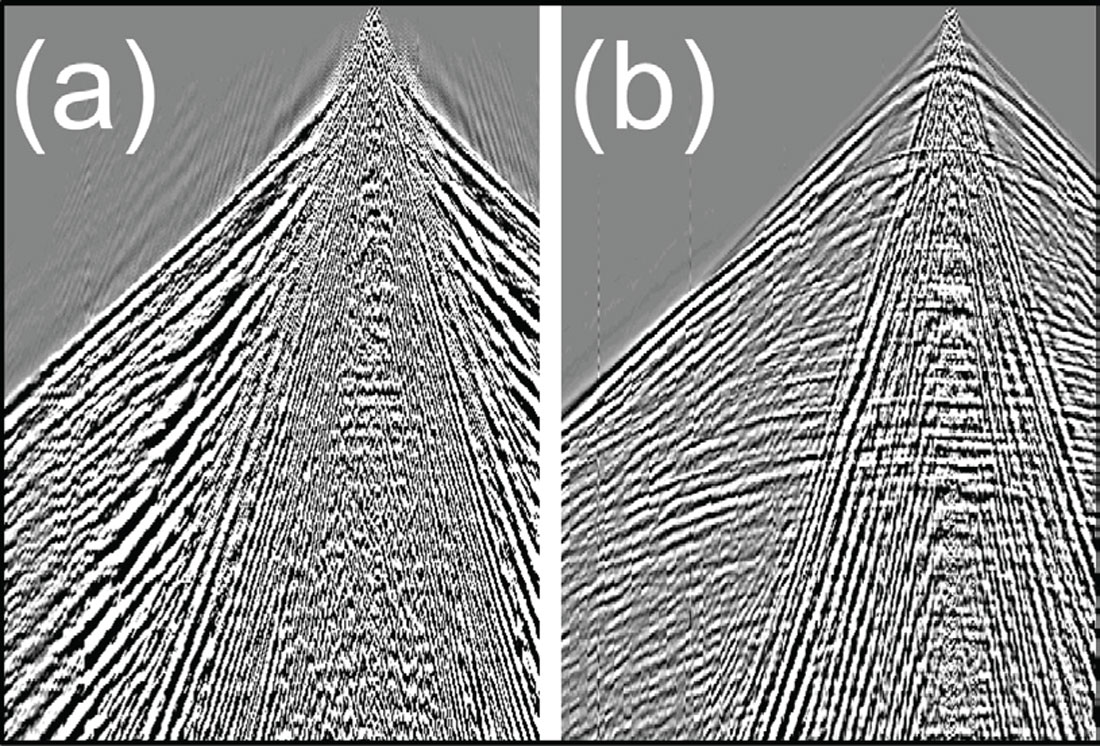
Due to the difficulty imaging through the near surface laterites, for the 2013-2014 seismic acquisition program, a lower frequency 6 – 84 Hz sweep was selected for Region 1; whereas a higher 6 – 96 Hz sweep was selected for the Region 2, which has only limited laterite (Figure 6). In both regions, testing showed that two sweeps per source station with a move-up between sweeps reduced the airwave. Therefore, move-up between sweeps was incorporated into the 2013-2014 seismic acquisition program.
Noise Tests
The purpose of the noise tests conducted in Region 1 and Region 2 was to attenuate all crossline noise and record all inline noise unaliased in order to design source and receiver arrays for future seismic programs in areas with laterite. Testing also attempted to identify the presence – if any – of near surface scatters and the nature of that potential noise. The tests involved acquiring a series of finely sampled 380m crossline arrays which were sorted and stacked in processing to create finely sampled receiver gathers. Recording of these noise tests was concurrent with production and with minimal additional costs (layout of geophones, etc.).
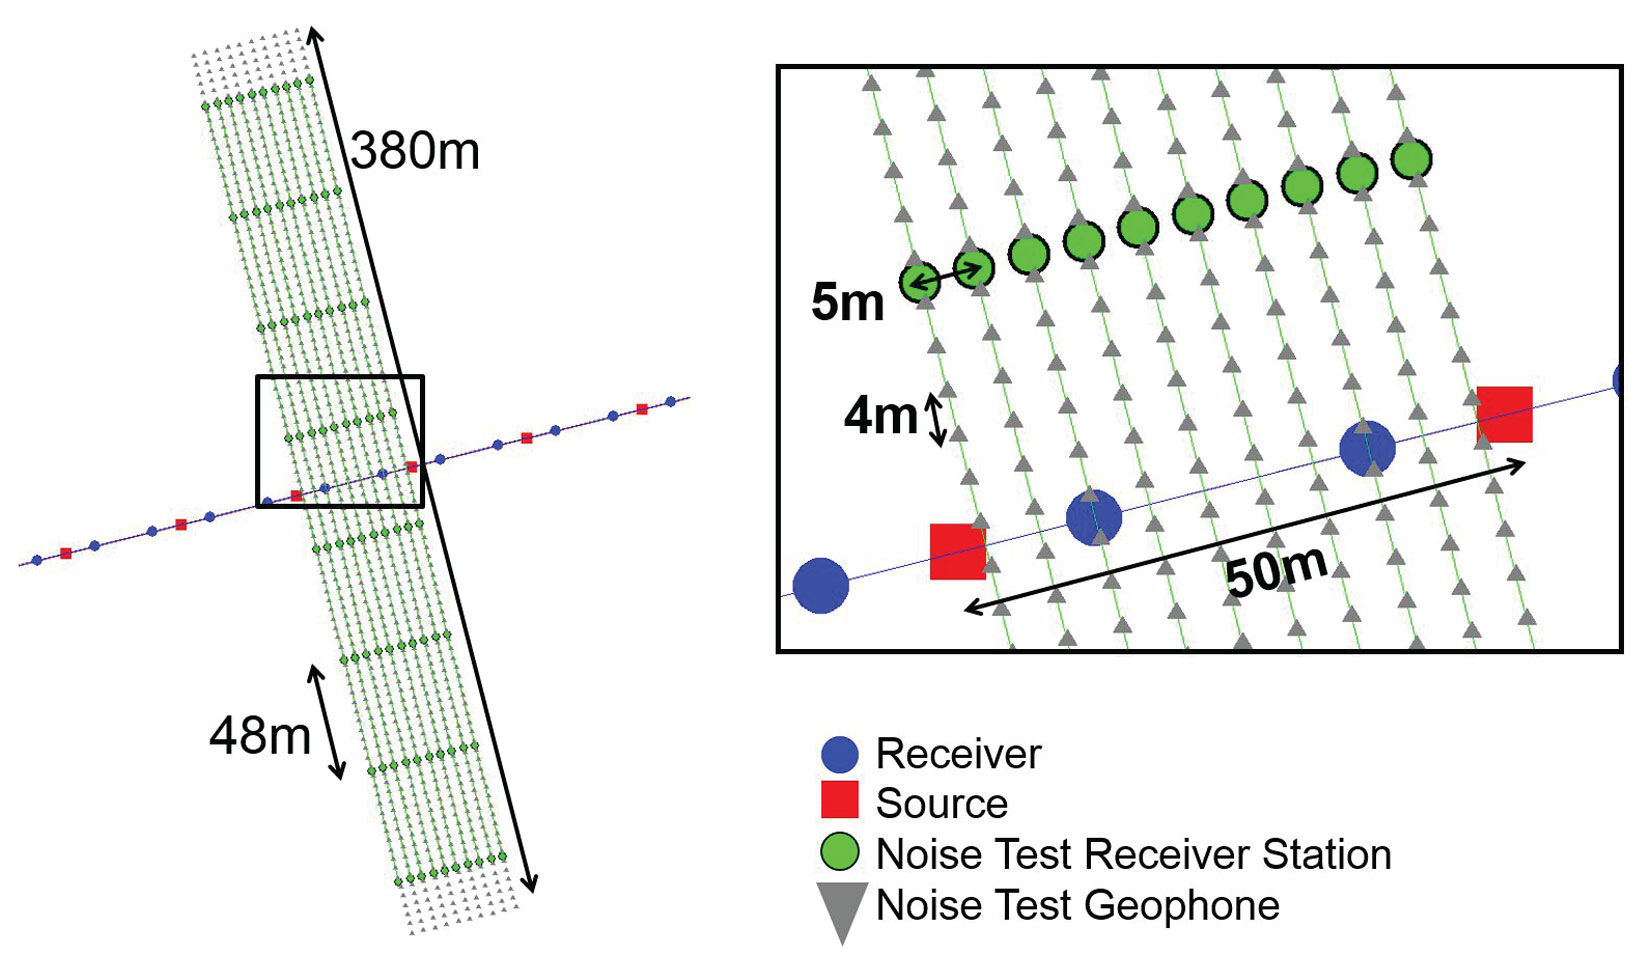
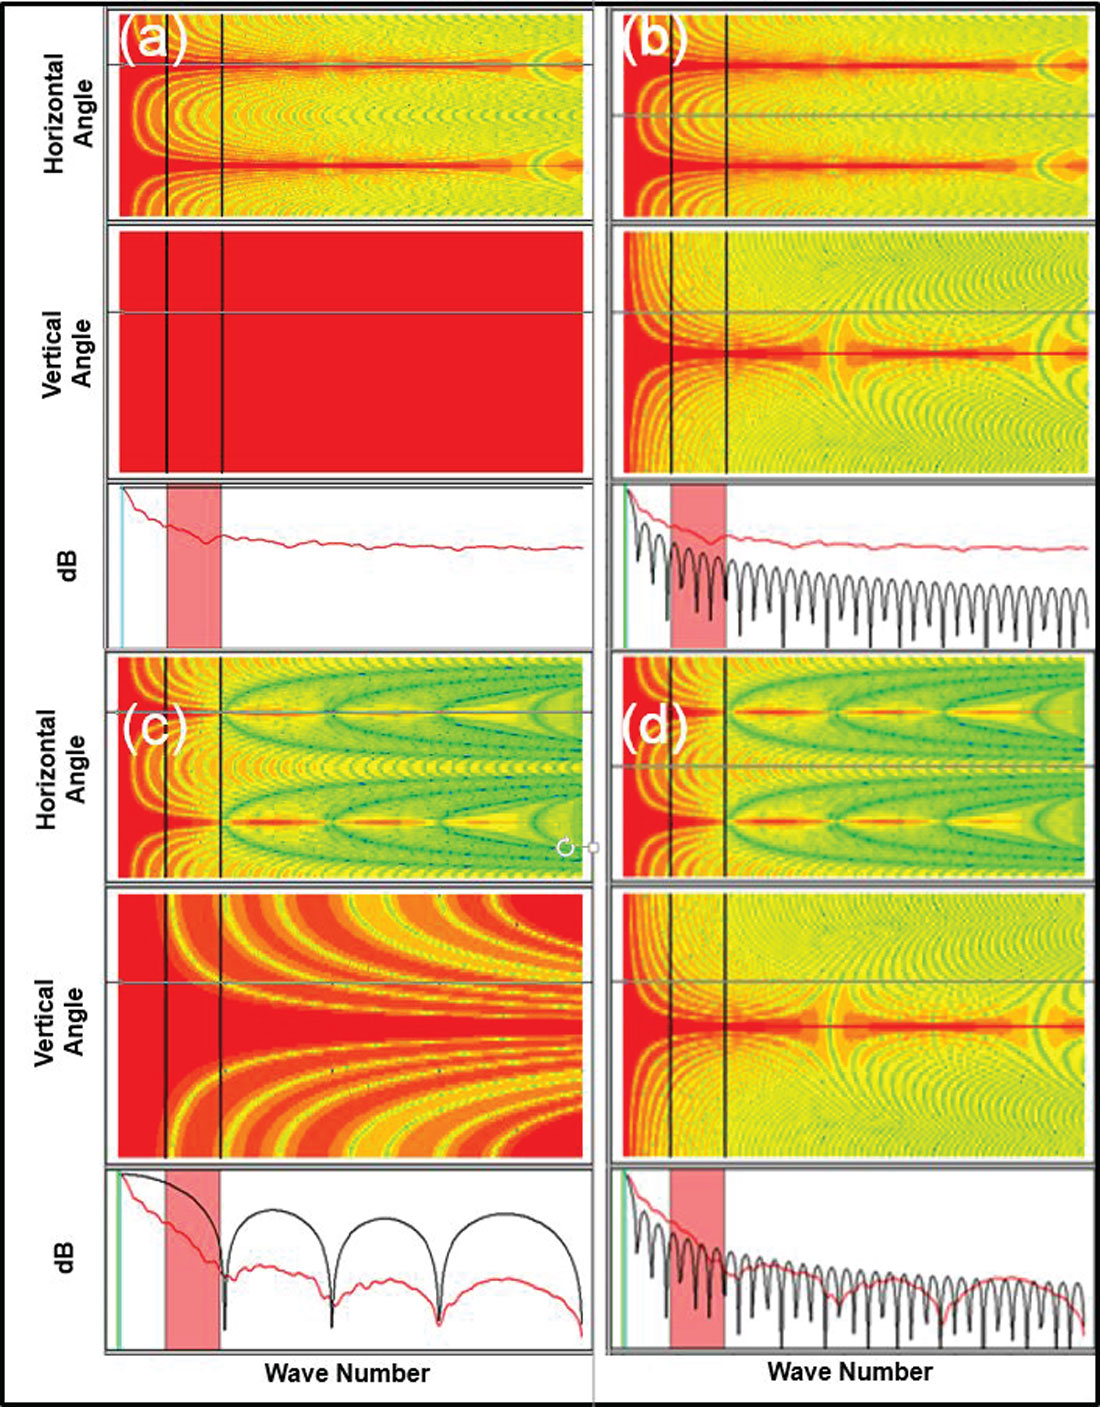
In Region 1, up to 10 km of sources were recorded and in Region 2 up to 5 km of sources were recorded. Figure 7 shows a diagram of the 10 crossline receiver arrays with 5 m separation between each array. The 380 m crossline array length, which was selected based on equipment constraints and theoretical modeling, was designed to significantly attenuate crossline noise without attenuating any inline noise (Figure 8) and provides unaliased recording of all noises. Both datasets recorded noises with velocities as slow as 330 m/s at frequencies as low as 8 Hz.
Since the recording equipment contained 12 geophone elements per group, the 380 m array was recorded as eight separate 12-element arrays and then summed in processing. This method enabled the comparison of different crossline array lengths. Figure 9 illustrates the improvement in imaging achieved with complete crossline noise attenuation and very fine inline spatial sampling.
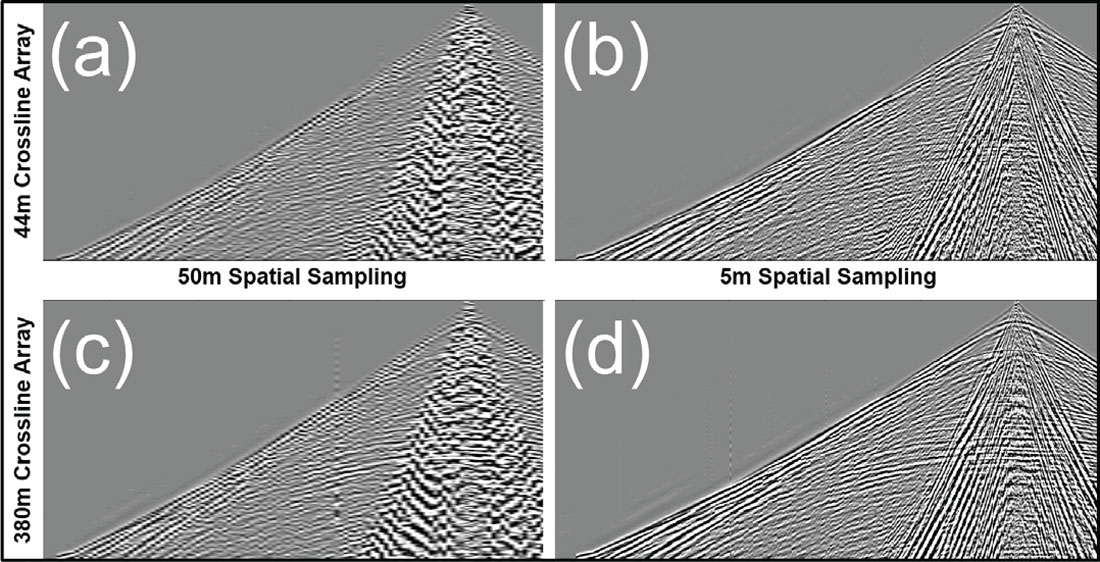
In Region 1 noise is predominantly located within an 8-30 Hz bandwidth and in Region 2 noise is predominantly located within an 8-22 Hz bandwidth. Noise velocities in both regions range from 330 m/s to 2150 m/s and are separated into four distinct bands in Region 1 and two distinct bands in Region 2. Ideally, spatial sampling should be fine enough to accurately sample the noise as well as the signal. Based on the noise velocities and frequencies, the ideal spatial sampling interval to record the slowest velocity noise (330m/s) would be 5.5m for frequencies up to 30 Hz and 2.75m for frequencies up to 60 Hz. Given the unreasonably high cost of recording data at this ideal spatial sampling interval (using standard recording equipment), receiver arrays should be used.
Although arrays can be designed to reduce or eliminate identified noises, analysis of target wavelengths indicates that arrays should be designed to only attenuate wavenumbers larger than 0.04 (m-1) in order to avoid attenuating signal at shallow targets. Based on the results of the noise test, and the Array Test (below) comparison of final migrated data sets of test line (one with crossline arrays and one with inline arrays, a combination of smaller inline sampling intervals and crossline arrays were recommended and used for the 2014-2015 seismic acquisition program. This represented an evolution from early programs in Region 1, which were recorded with podded geophones instead of arrays.
Array Test
As observed during the noise tests in Region 1 and Region 2, for 2D acquisition, a crossline array component is beneficial for attenuating crossline noise due to near surface scatters. In order to test inline and crossline receiver array designs, an Array Test was conducted in Region 1 on the same line as the noise test (Line 003). This test involved laying out alternating inline and areal receiver arrays along the entire length of the line. The linear receiver array was 12 geophones over 25m and the areal receiver array was 12 geophones on a diagonal (25m inline x 45m crossline) (Figure 10). The purpose of this test was to examine the feasibility of laying out crossline receiver arrays and compare the data quality achieve with a linear array versus an areal array. It was expected that the areal array would improve imaging by reducing crossline noise (Figure 11).
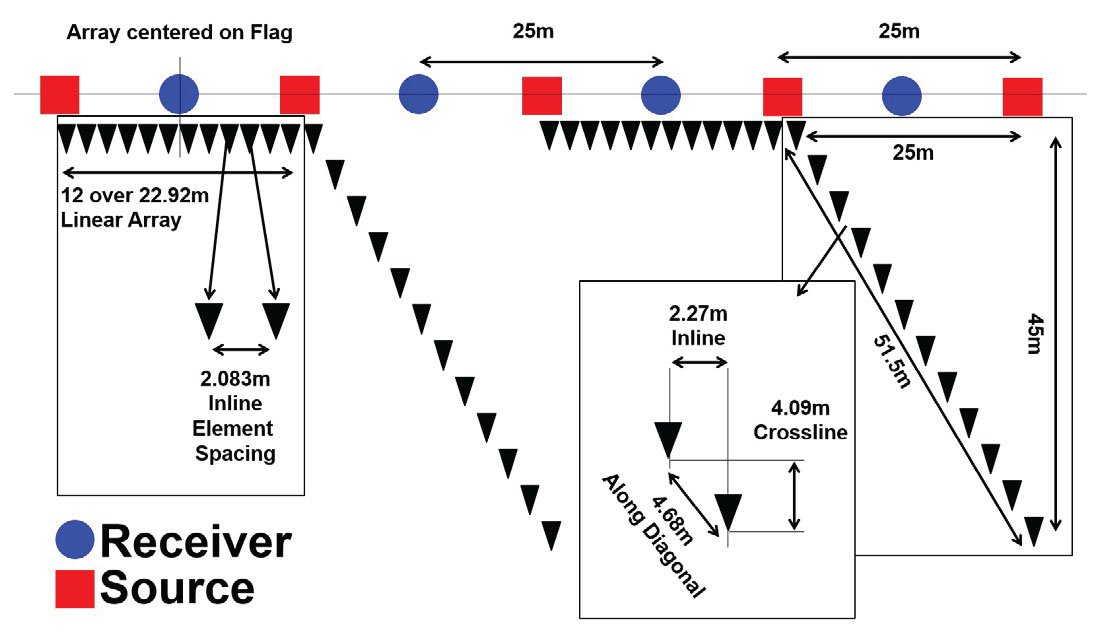
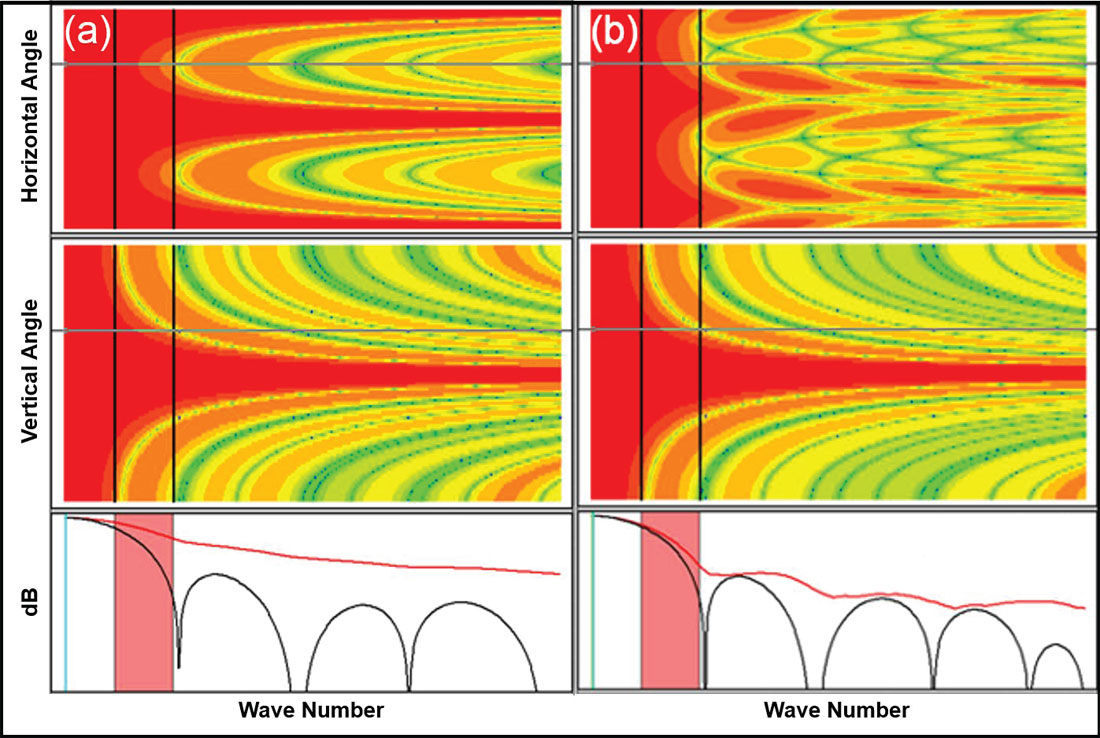
The array test was acquired as part of the regular production data, which reduced the costs of this acquisition test and processing. The data was sorted in processing into two datasets: one with only linear receiver arrays and one with only areal receiver arrays (Figure 12). Final processed migrated data for both inline and crossline arrays were compared in the same location, and indicated that areal arrays provide better crossline noise attenuation in areas such as Region 1, where significant near surface laterites are present. Signal-to-Noise is also improved in the 10-25 Hz bandwidth; however, at frequencies above 60 Hz, linear receiver arrays resulted in better imaging of shallow horizons and some improvement along steeply dipping reflectors.
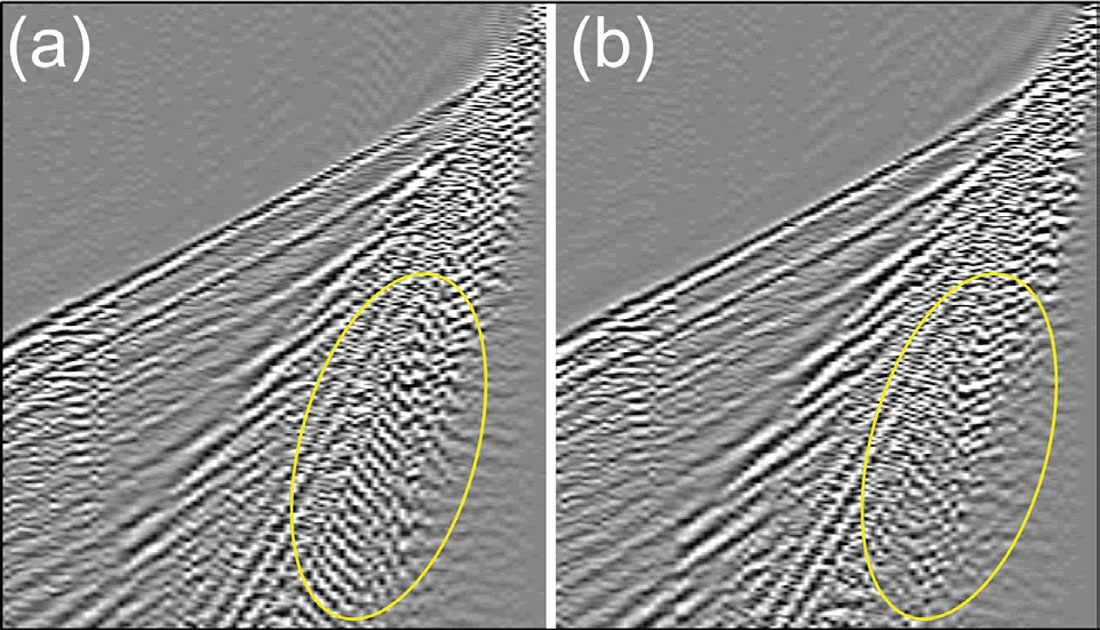
Based on these results it was recommended that areal arrays be used in Region 1, but linear arrays be used in areas such as Region 2, where scattering noise is less common. Areal arrays used in Region 1 for the 2014-2015 seismic acquisition program improved imaging in areas with laterite.
Sweep Effort Tests
For the first two programs acquired in Chad in 2012 and 2013, five vibrators were used as a source, originally as an attempt to improve low signal to noise observed on the company’s first seismic records in Chad. Subsequent shooting in the following seasons used four vibrators, as data quality was found to be comparable with the one less vibrator and costs were reduced significantly. The 2013-2014 seismic acquisition program was acquired with 25 m receiver station intervals and 50 m source station intervals with two vibroseis sweeps per source station. These parameters were similar to the parameters used by previous operators.
Increasing the fold and acquiring the data with symmetric sampling (Vermeer, 2012) by reducing the source interval to 25 m was postulated to improve data quality. However, with two sweeps per 25 m source station, the number of sweeps on the program would have doubled, increasing the cost of the acquisition program.
In theory, decreasing the number of sweeps will decrease the strength of the signal (Meunier, 2011); however, reducing the source station interval from 50 m to 25 m will double the fold, so the signal strength difference between one versus two sweeps (or two vs. four) should be negligible. Based on this information sweep effort tests were proposed to determine if imaging improvements could be obtained by acquiring data with a smaller source interval (higher fold) while optimizing costs by reducing the sweep effort at each source station. Two data areas were selected for testing: one in Region 1 and one in an area of excellent data quality within Region 2. The tests involved acquiring a line of 2D data with two un-summed sweeps every 25 m and then separating the data in processing into: (1) one sweep every 25 m and (2) two sweeps every 50 m.
Test results in both areas showed improved imaging with a single sweep every 25 m vs. two sweeps every 50 m. A comparison of the raw shot gathers for one versus two sweeps shows that random noise attenuation is better on the two sweep record versus the one sweep record. However, in good data areas, the slight increase in random noise due to a single sweep is countered by the large improvement obtained in imaging steep dips and high frequencies when a smaller, 25 m, source station interval is used (Figure 13).
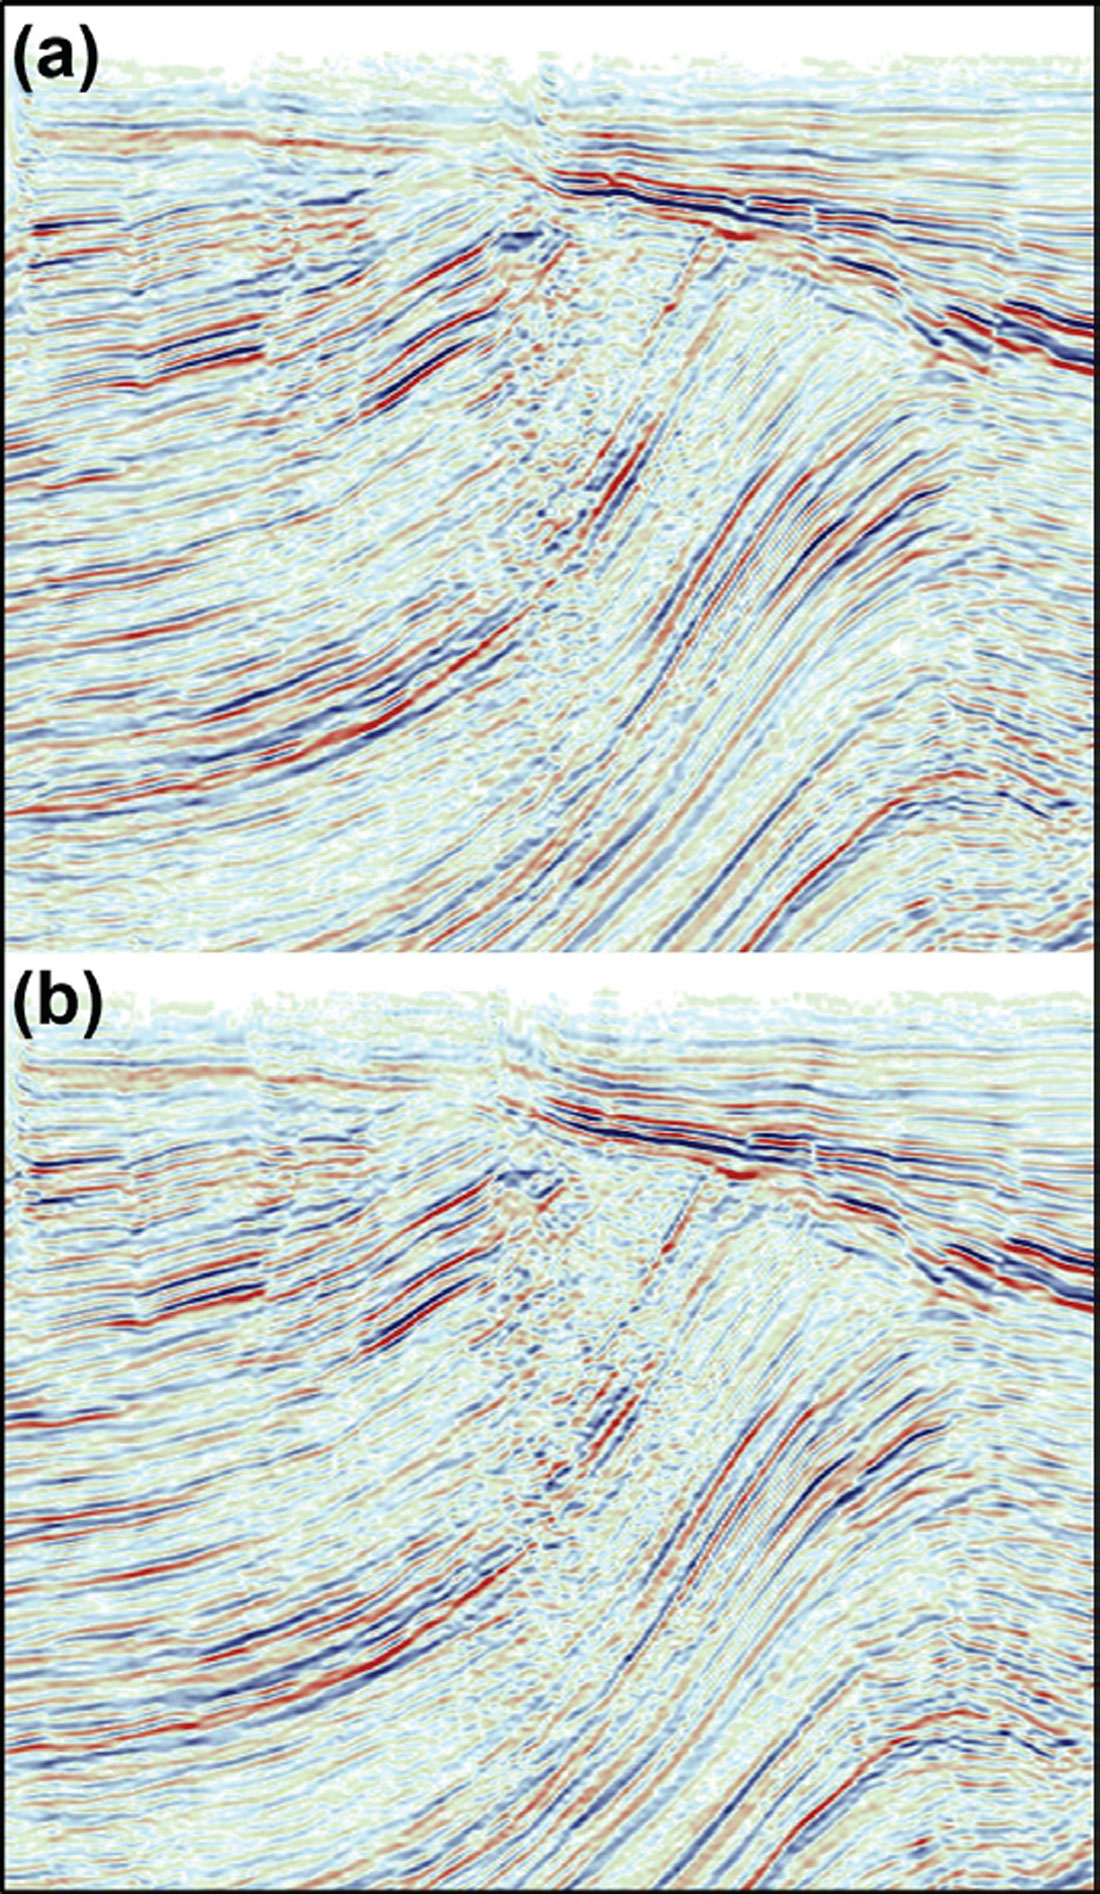
Based on the test results, a single sweep, 25 m source station interval was recommended for use in good data areas and a two sweep, 25 m source station interval was recommended for use in difficult data areas. During the 2014-2015 seismic acquisition season, single sweep data was acquired in Region 2 with excellent results. In Region 1 two sweeps every 30 m were used; however, during the 2014-2015 seismic acquisition program, an additional sweep effort test was conducted to compare two sweeps every 30 m versus a single sweep every 15 m. In addition, one of the 3D surveys was acquired with two unsummed sweeps in order to test the effect of one vs. two sweeps on 3D data.
Benefits of incorporating seismic acquisition tests into regular production
As a result of the successful test programs during the 2013-2014 seismic acquisition program, eleven additional seismic acquisition tests were acquired during the 2014-2015 seismic acquisition program with excellent results. Some of the tests, such as the 2D swath tests and 3D cross-spread test, were acquired at minimal cost and identified new methods of expanding the use of seismic in Southern Chad. In areas where parallel 2D lines were planned, concurrent acquisition of the two lines resulted in an additional 50 km of excellent subsurface data.
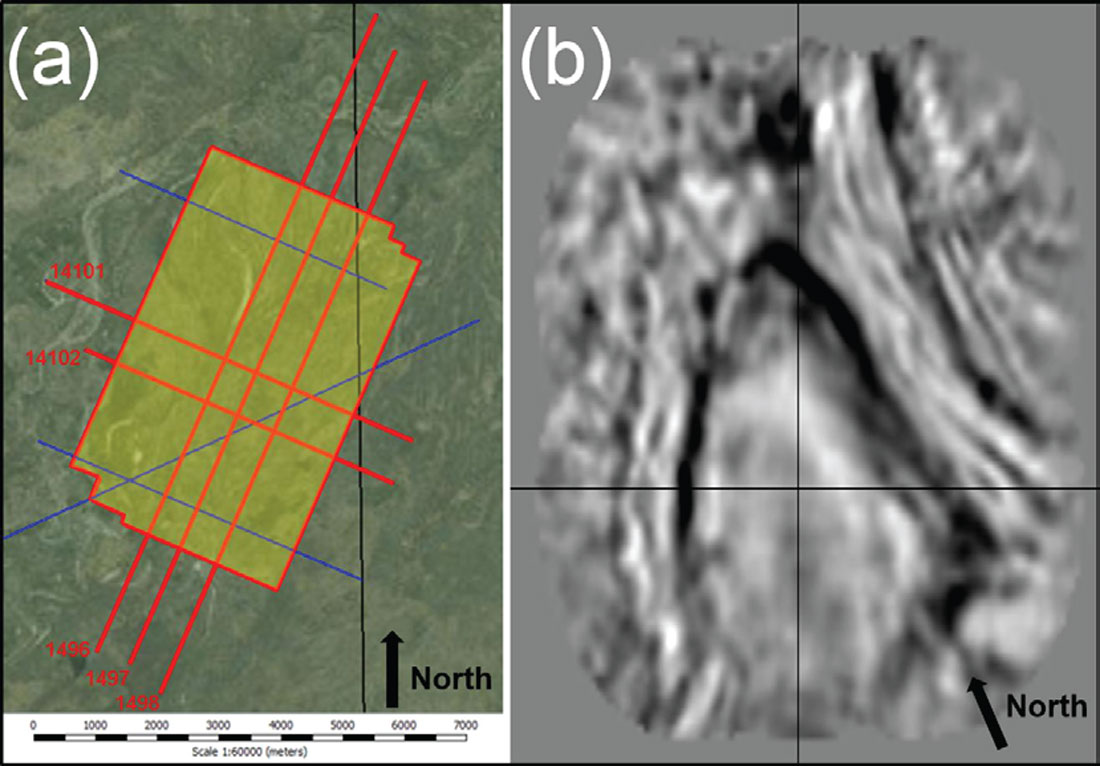
With the assistance of the Seismic Contractor BGP a 3D Cross-Spread (2.5D survey) was acquired at the conclusion of the program, to evaluate potential offset drilling from a recent well. This data was then processed into a small 3D. Although limited in extent due to the mute offsets, the survey provides great benefit with detailed information for possible future offset well drilling (Figure 14). In cases where a 3D survey is not possible due to time constraints prior to drilling, 3D cross-spreads may prove effective for defining the best location for a delineation well.
Conclusions
Poor data areas in Southern Chad were observed to be associated with laterite occurrence, as mapped on vintage soil maps. Where possible, new seismic lines were placed to avoid surface occurrences of crystalline laterite. Based on the test results acquired during the 2013-2014 seismic acquisition program, two different sets of parameters were recommended for acquiring 2D data during 2014-2015 seismic acquisition. In areas with difficult near surface conditions, such as Region 1, (surface laterites, near surface scatters), high effort acquisition with areal receiver arrays, smaller spatial sampling interval, and multiple sweeps were recommended. In areas with good data quality, such as Region 2, efficient linear receiver arrays, a larger spatial sampling interval, and single sweep were used.
The excellent data quality obtained from the 2014-2015 seismic acquisition program illustrates the benefits of incorporating seismic acquisition tests into regular seismic acquisition to improve quality and reduce costs. It is expected that results from the testing conducted during the 2014-2015 seismic acquisition program will provide further benefits for future 3D programs planned in the area. It has been shown that with ongoing seismic operations, seismic acquisition tests can be incorporated into every regular seismic acquisition program with very little additional cost into order to continually improve data resolution.

Acknowledgements
The authors thank Glencore for providing the data and interpretation, Cameron Crook and OptiSeis Solutions Ltd. for providing the analysis and seismic test designs, Thrust Belt Imaging for the processing, and Larry Cameron, Geoffroy de Vernou and Don Crowell for their assistance in field acquisition. The authors would also like to acknowledge the cooperation of the seismic contractor BGP International (Chad) and the strong performance of BGP management Mr. Ling and Mr. Liang in advancing the application of seismic in Southern Chad.


Join the Conversation
Interested in starting, or contributing to a conversation about an article or issue of the RECORDER? Join our CSEG LinkedIn Group.
Share This Article