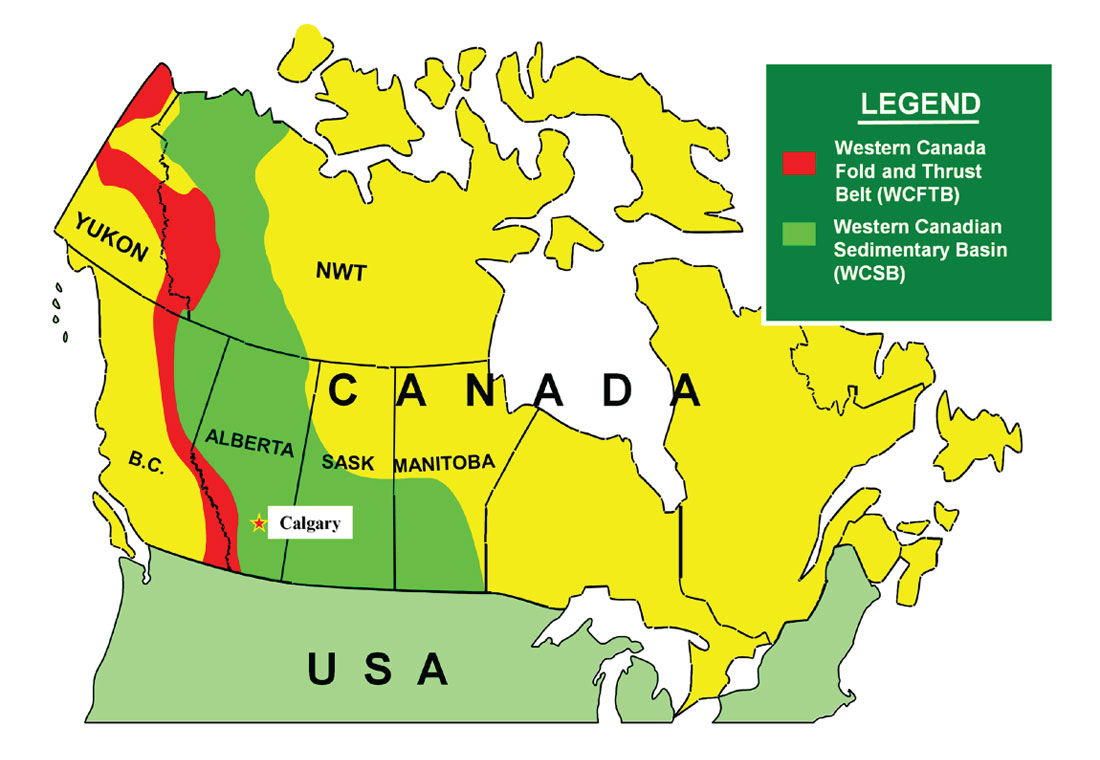
The hydrocarbon exploration of the Western Canada Fold and Thrust Belt (WCFTB) (Figure 1) is over 100 years old. For the last 70 years it has been greatly aided by seismic imaging techniques which have provided an understanding of the deep structures. Even so, this process is still full of surprises as steep dips, fault repeats, detachments, and poor coupling at the surface all contribute to obscuring a clear image of the subsurface.
In an effort to improve our understanding of the WCFTB, a seismic line (LOFF8) was shot across the Brazeau Thrust in the Alberta portion of the WCFTB. The LOFF8 seismic line is part of a unique experimental seismic program that was shot expressly to evaluate long offset, high intensity acquisition parameters (Colombo, 2005). It is 52 kilometres long and runs NE to SW from the un-deformed sediments of the Western Canadian Sedimentary Basin, across the Triangle Zone and the Foothills to the front ranges of the WCFTB.
A common tool for aiding seismic interpretation is the drawing of balanced cross sections at the same time as the seismic is being interpreted. Through this process of interpreting LOFF8 a new deformation model was discovered for the Brazeau Thrust. This model showed that large scale folding occurred early on in the evolution of the structure. This was followed by the initiation of a thrust that carried the back limb of the fold in the hanging wall of the Brazeau Thrust 10 km to the NE.
Imaging structures beneath higher velocity rocks that have been faulted to the surface is a key problem in resolving fold and thrust belt geometry throughout the world. In the WCFTB there are numerous experienced seismic processing companies, a public well database and 100 years of surface geological mapping available. These all greatly assist the interpretation of the complex geometries associated with these structures.
The interpretations of the seismic line LOFF8 in time and depth are reviewed in this paper. The tools used for the integration of the surface and subsurface geological and geophysical data are described and a new deformation model is presented.
Regional Geology
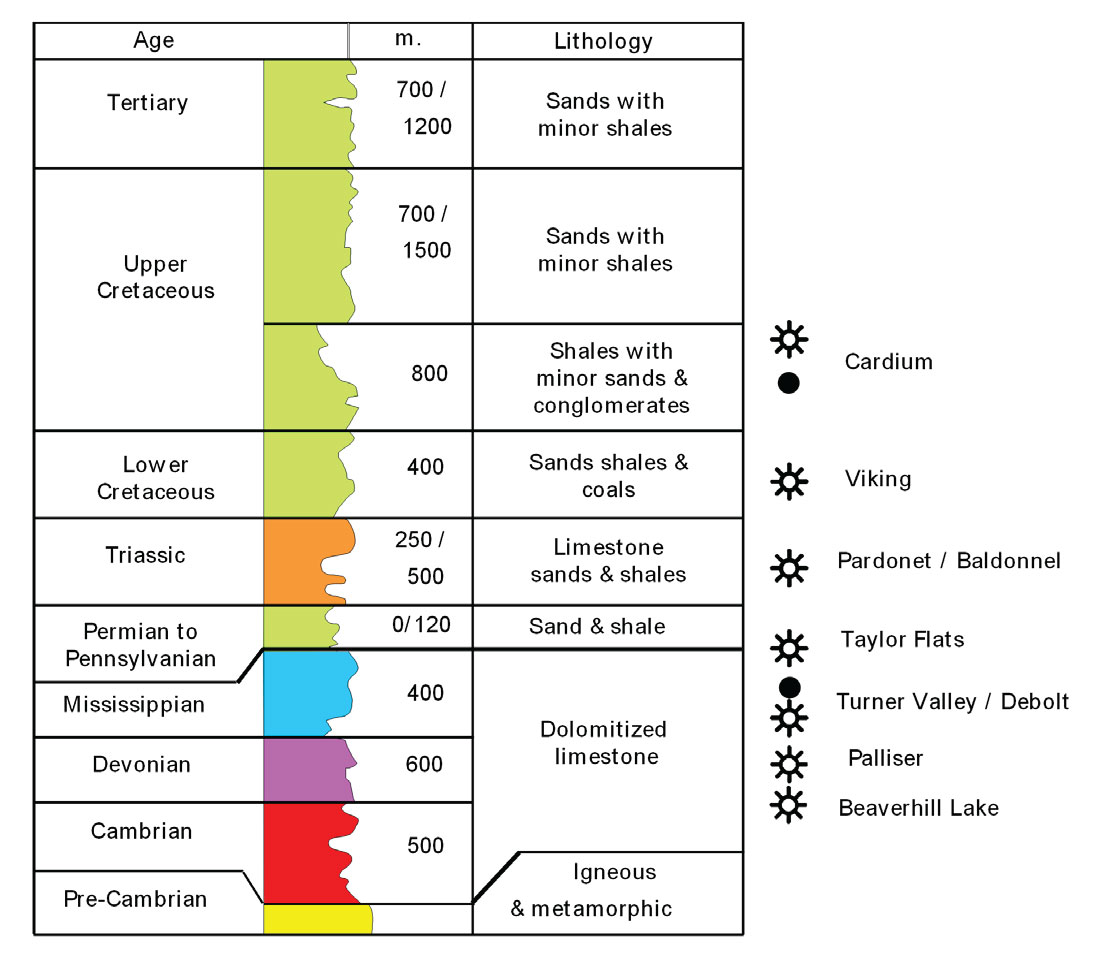
A typical stratigraphic column of the WCFTB consists of 1500 m of Paleozoic carbonates overlain by 3500 m of Mesozoic clastics. Hydrocarbons have been produced from various formations, from the Devonian to the Upper Cretaceous (Figure 2).
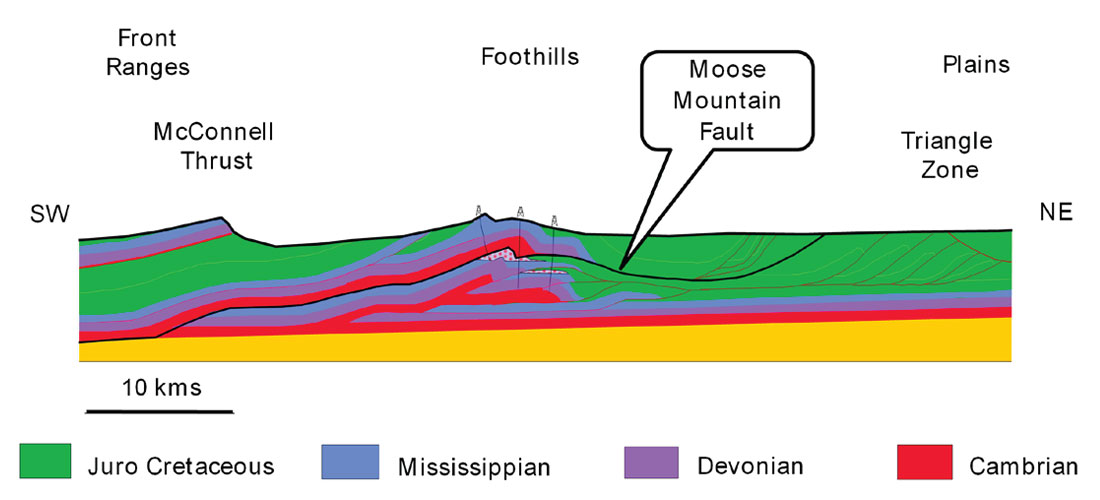
The structural geometries are characteristic of thin-skinned tectonics. The faults are generally made up of ramps and flats, along which thrust sheets propagated from SW to NE during the Laramide Orogeny. Some of these faults record many tens of kilometers of dip-slip movement (Figure 3).
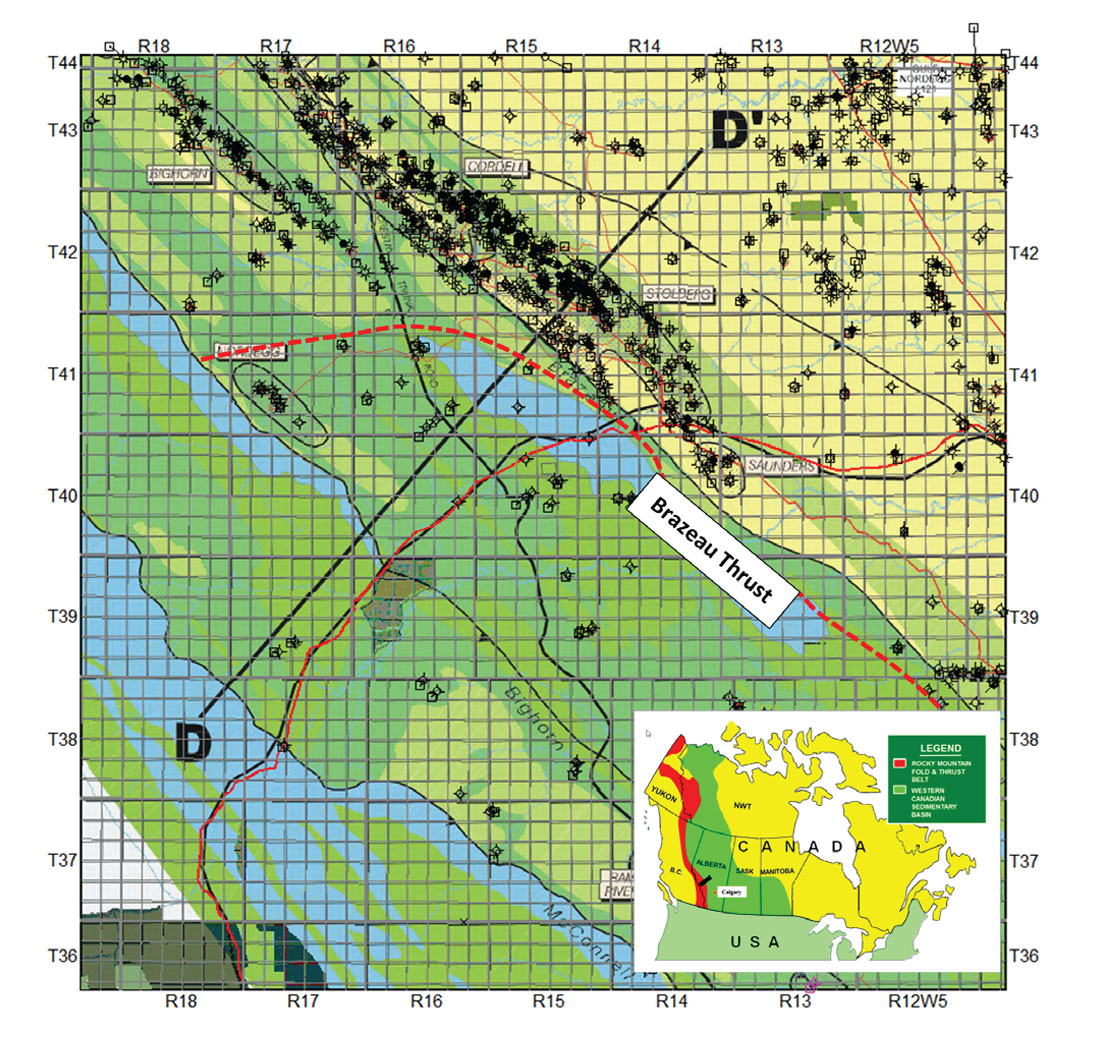
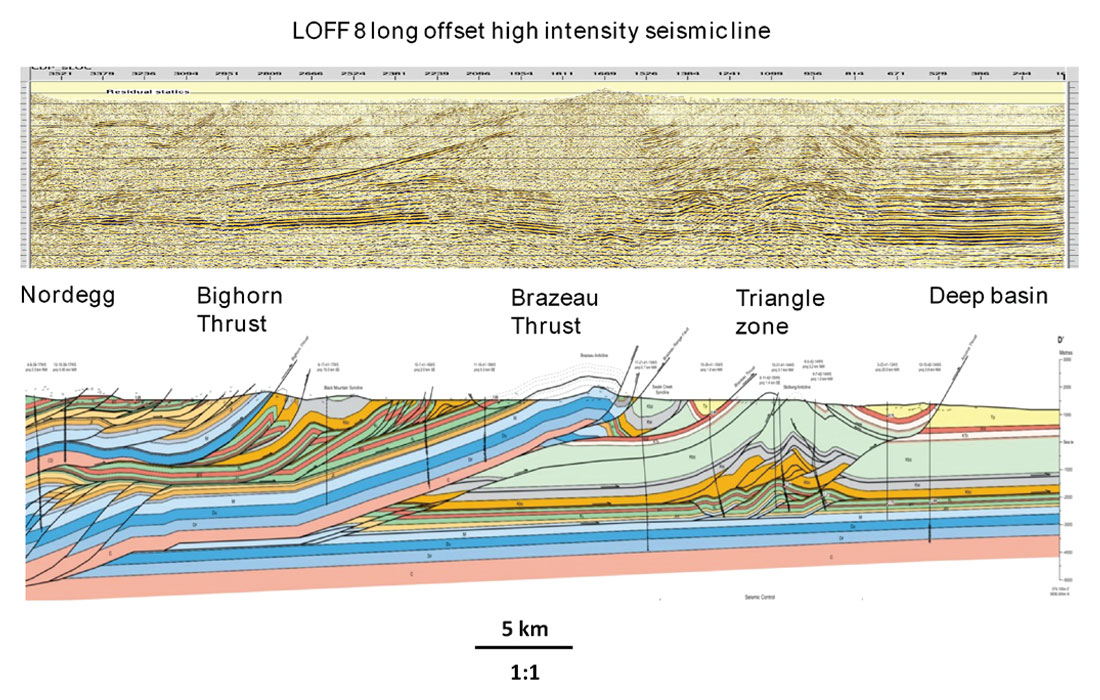
LOFF8 is located about 100 km northwest of Calgary near the old coal mining town of Nordegg. It is 52 kilometres long and runs close to and subparallel to the regional cross section D-D’ published by the Alberta Geological Survey (Langenburg et al 2002) (Figure 4).
LOFF8 Seismic Acquisition Parameters
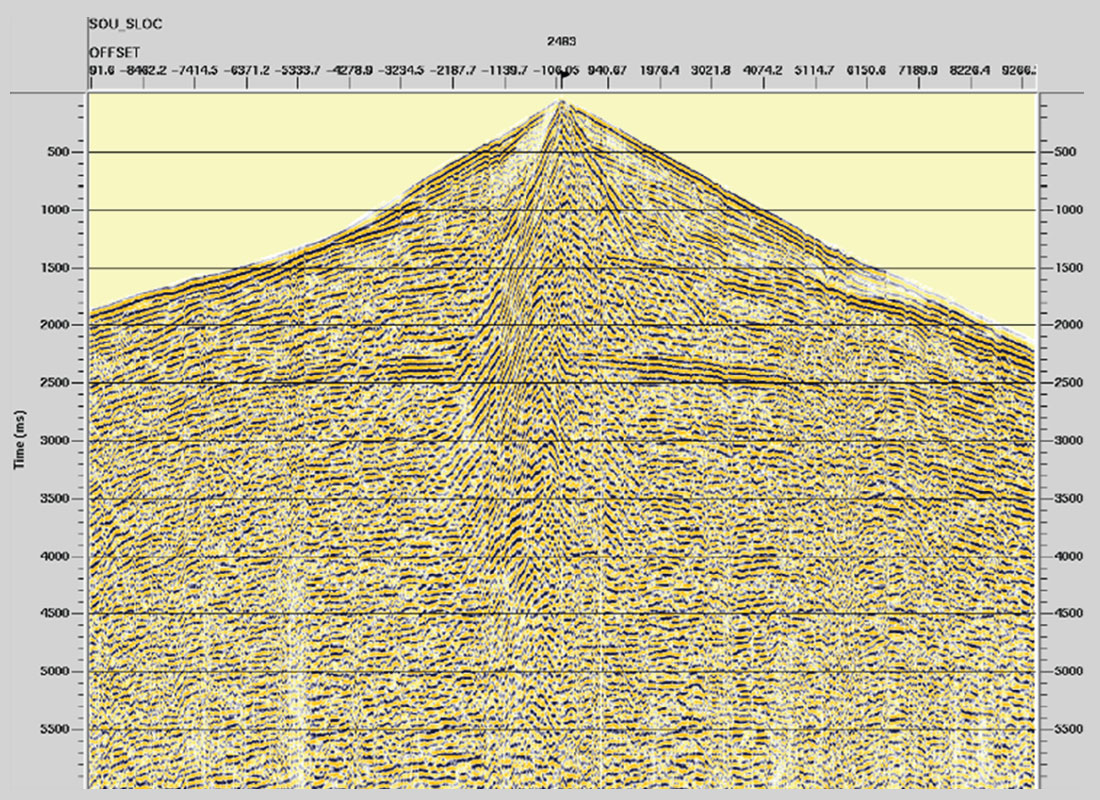
This seismic line was shot to evaluate using high effort, long offset acquisition parameters in a difficult environment for surface acquisition parameters (Figure 5).
Pre Stack Time Migration (PSTM)
Geological Interpretation
Surface Geology
The geological mapping of the WCFTB has been carried out by numerous organisations. The Geological Survey of Canada and the Alberta Geological Survey have both mapped the study area. Albertan Universities have had many graduate students working here for over 40 years. In addition, several private companies have carried out their own geological mapping projects and sold them to industry. Along with the surface maps, there have been many cross sections drawn such as D-D’ (Figure 6).
A total of 652 square kilometers of published geological mapping were used to provide the surface control for the LOFF8 seismic line. This information included geological outcrop data along the surface trace of the seismic line as well as the bedding data used for calculating the down plunge projection. (Groshong 2008).
Well Data
The well data in Western Canada is all in the public domain after a variable confidentiality period. Much of this data is digital but some of the old data is still on paper or film media.
For this project the public data was used to extract location, deviation survey, and a TD depth of each well. The well logs and dipmeter data were of key importance. The public data base for this was searched and analysed using GeoScout.
27 wells were initially checked for quality and consistency and then used in the PSTM interpretation. The horizon/formation tops of key wells were picked and cross checked against the public database. In addition all available dipmeter data were quality controlled and analysed for dip and plunge.
Velocity Model
All surface geology and well data were incorporated into the initial processing of the LOFF8 line in time. Significant value was gained by having a cross section available from the public data base to guide the velocity picking (Figure 6). (Langenburg et al 2002).
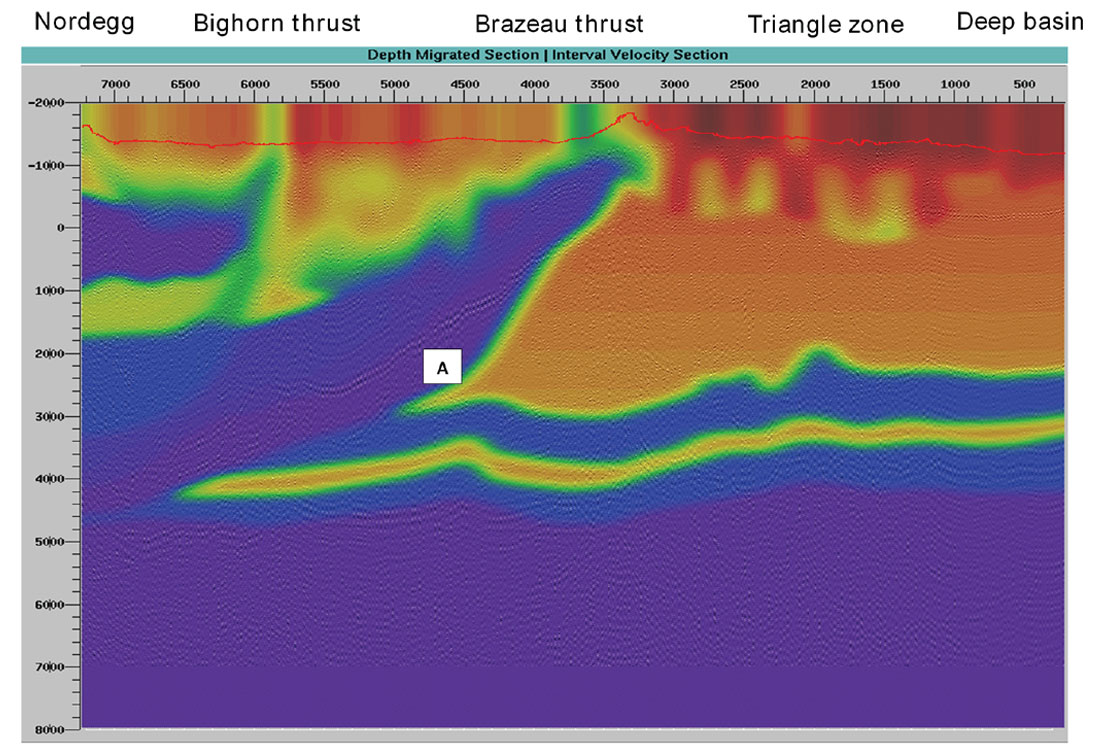
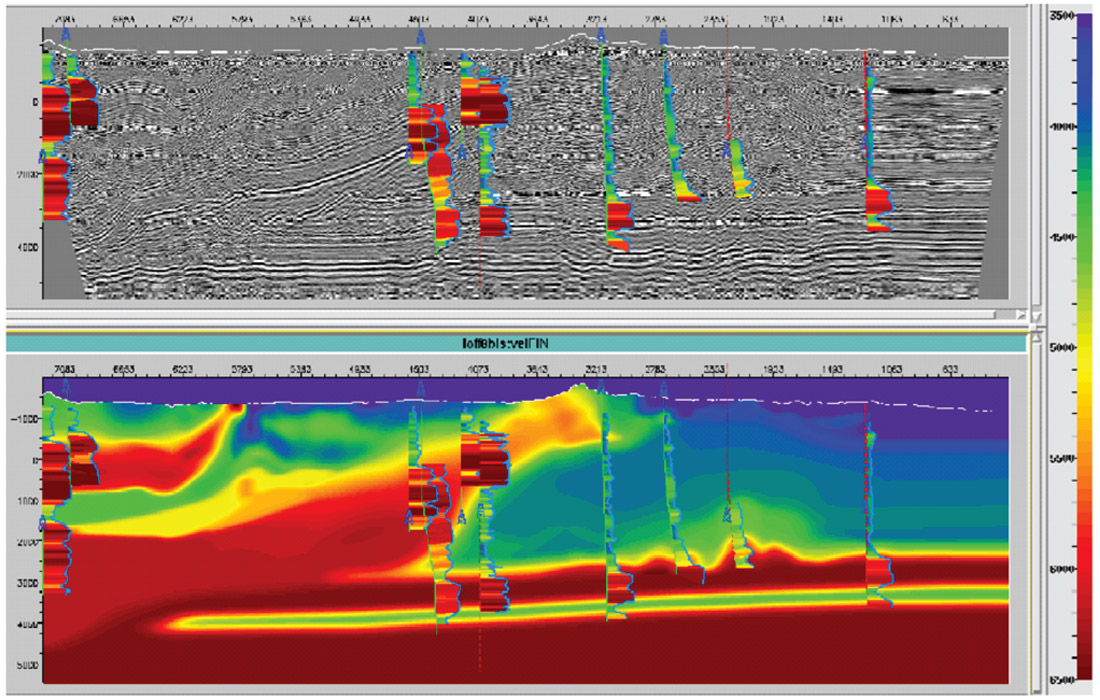
In the early stage of the PSTM work flow, an anomalous area of high-velocity rock was identified by the processor. This area was in the footwall of the Brazeau Thrust where the cross section D-D’ had predicted low-velocity Mesozoic formations. The velocities being used in the PSTM were more compatible with higher velocity Paleozoic carbonates (Figure 7).
PSTM Work Flow
The seismic imaging work proceeded from preliminary time processing which focussed on static corrections (field and residuals), S/N ratio improvement, and the definition of robust velocity functions. This was followed by the Kirchhoff PSTM. (Geosystems, 2006)
Pre Stack Depth Migration (PSDM)
Geological Interpretation
Surface Geology
As a result of the velocity anomaly it was decided to increase the geological study area. Both the surface geology and the wells were examined in detail over a larger area. 82 wells and 1600 square kilometers of surface geology were incorporated into the geological model.
Down Plunge Projection
During the review of dipmeters and wireline logs for the expanded area one well stood out. It was a very deep test with a TD of 5985m. The well’s name is AQUIT CDCOG Shunda 7-13-39-15 (7-13) drilled in 1981. In addition to its depth it had an exceptionally good wireline logging suite.
Both the surface mapping and well data show that the Brazeau Thrust sheet is a major structural feature with a very consistent trend and plunge in this area. Based on this information the direction and amount of plunge in two structural domains were determined (Groshong 2008). The northern domain extended from LOFF8 NW for 8 km and the southern one extended from LOFF8 to the SE for 15 km. Within these two domains, large scale features could be safely projected many kilometres (Figure 8).
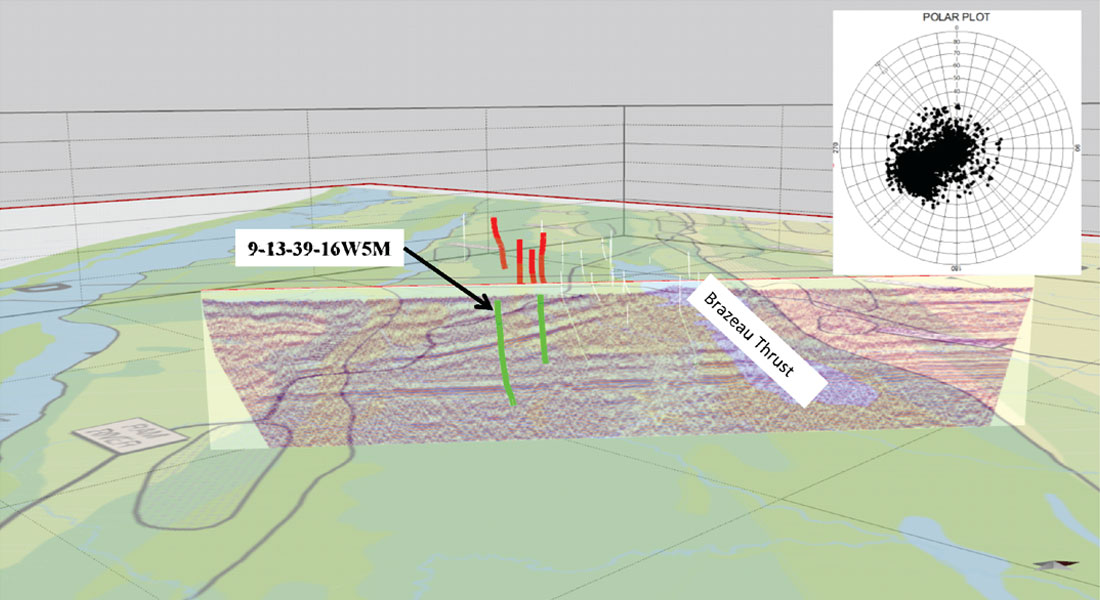
All the surface geology data and well data (including dip vectors) were loaded into the Move software. This software allowed the data to be analysed and projected interactively onto the plane of section using a down plunge projection direction of 1.06° at 317° AZ.
Dipmeter Analysis
The 7-13 well had 5985m of wireline logs, deviation surveys, dipmeter and tops data. The entire wireline log data was checked for quality and consistency; this included a detailed review of the dipmeter data. The geological tops were re-picked for consistency with the other 82 wells. This data was loaded into the RDA dipmeter-analysis software for calculating down plunge projection.
A detailed dip analysis was carried out using the 7-13 well data. In this process, points were picked in the well bore using the SCAT display (Statistical Curvature Analysis Technique) to highlight dip domains (Bengston, 1981). These were then interpreted using the gamma correlation log from the wireline logging suite to determine the stratigraphic up direction (Figure 9).
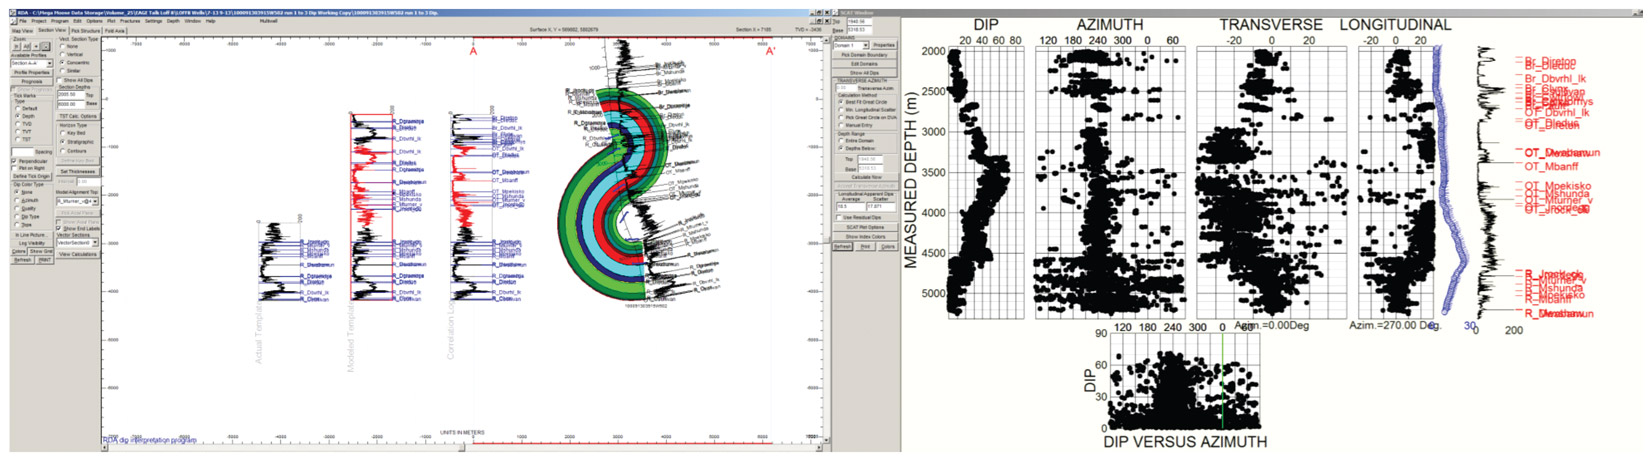
Based on this process the well was divided into three large domains. The dipmeter data and geological tops in the hanging wall of the Brazeau Thrust were designated as an upper domain called BR. This data was imported into the dipmeter analysis package with the stratigraphic top of the dipmeter data pointing up. The data in the footwall of the Brazeau Thrust were found to be in one of two distinct geological domains. Bedding from the Brazeau Thrust down to 4250 m was overturned, based on the gamma correlation log. This domain was called the OT domain and the dipmeter data was loaded with the stratigraphic top of the dipmeter data pointing down. The third geological domain was the data from 4250 m to TD which was called the R domain and it was loaded with the stratigraphic top of the dipmeter data pointing up.
The geological tops, domains, and dip vectors were incorporated into the revised structural interpretation of the formations penetrated in 7-13. The Paleozoic stratigraphy can now be seen to be the right way up in the hanging wall of the Brazeau Thrust, overturned in the immediate footwall of the Brazeau Thrust and the right way up again in the regional part of the section.
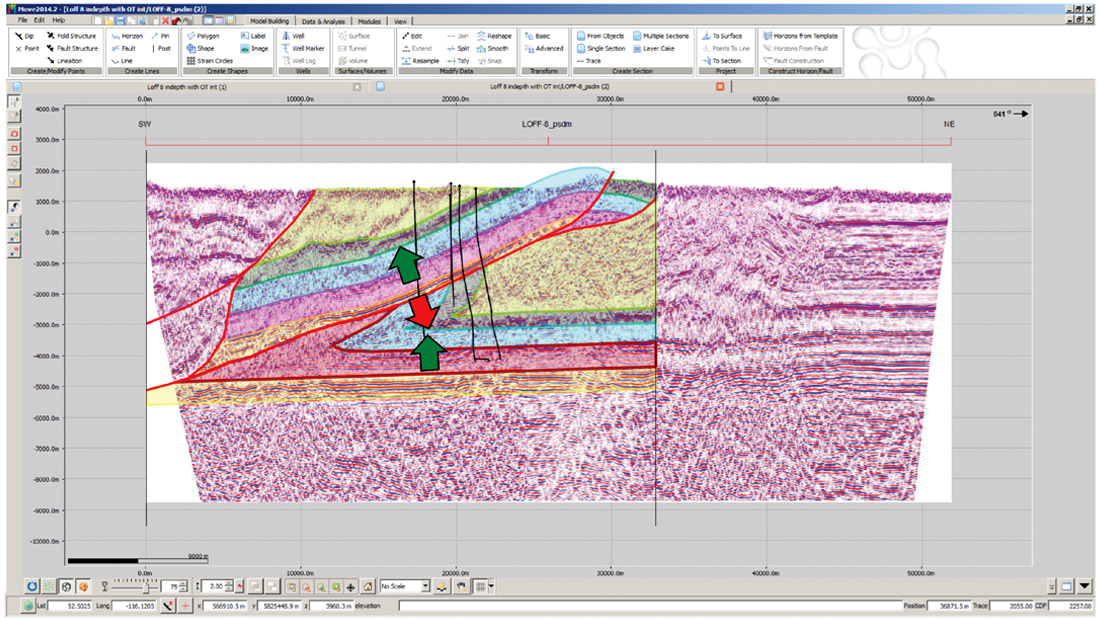
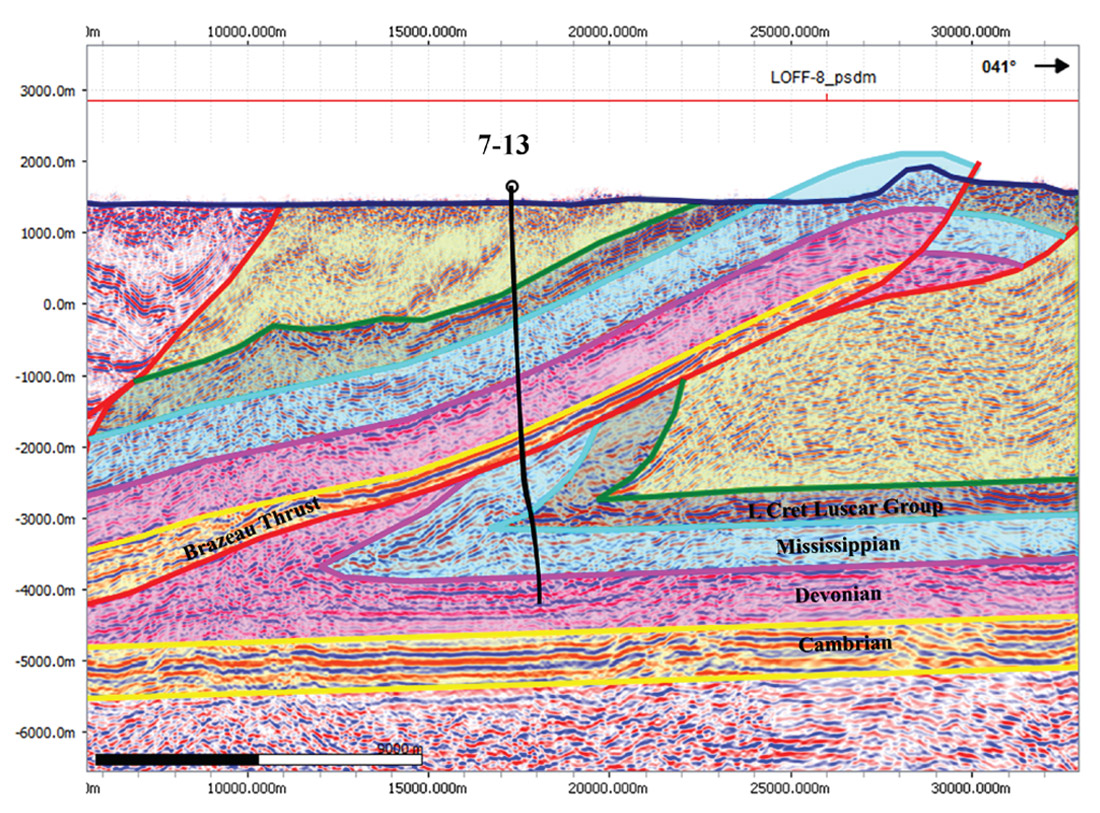
This data was then projected onto LOFF8 using a down plunge projection. The resulting interpretation in depth clearly illustrates that the velocity anomaly is caused by Paleozoic carbonate in the overturned limb of a fold, in the footwall of the Brazeau Thrust (Figure 10).
Geological Modeling
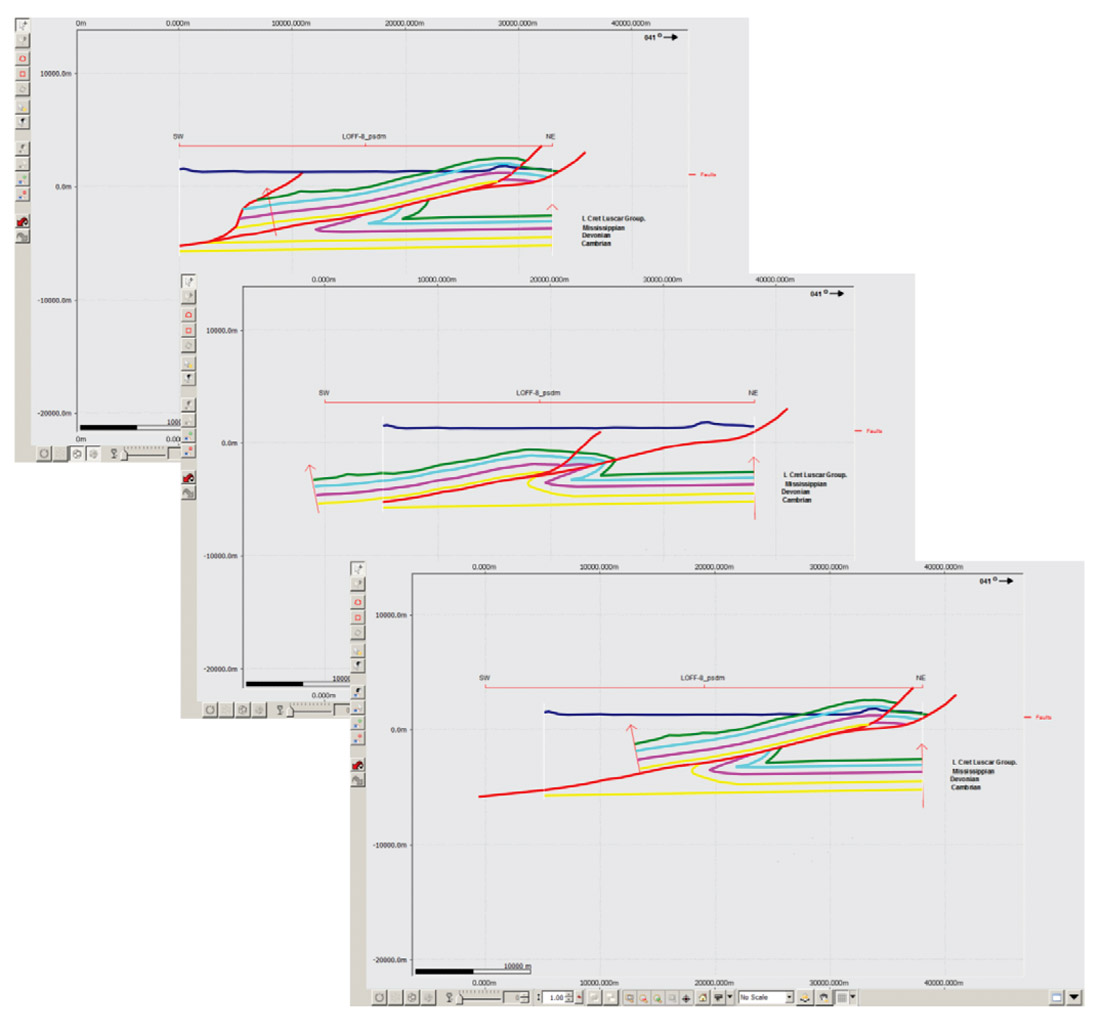
The depth model in Move was palinspastically restored and then forward modeled to test for balance using the 2DMove module. This was carried out using the Midland Valley’s flexural flow algorithm. As a result of this restoration of the Paleozoic, some minor changes in the footwall interpretation of the Brazeau Thrust were made to maintain ramp geometry (Figure 11).
Geophysical Modeling
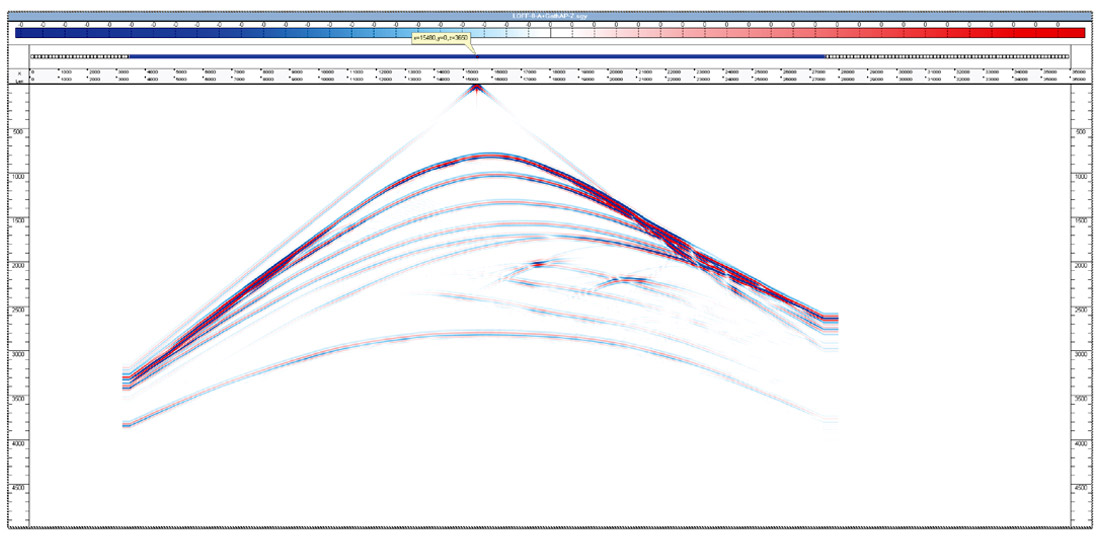
The balanced cross section derived from the PSDM of LOFF8 was used as the input model for simulating synthetic seismic shots records using the Tesseral 2D software (Figure 12).
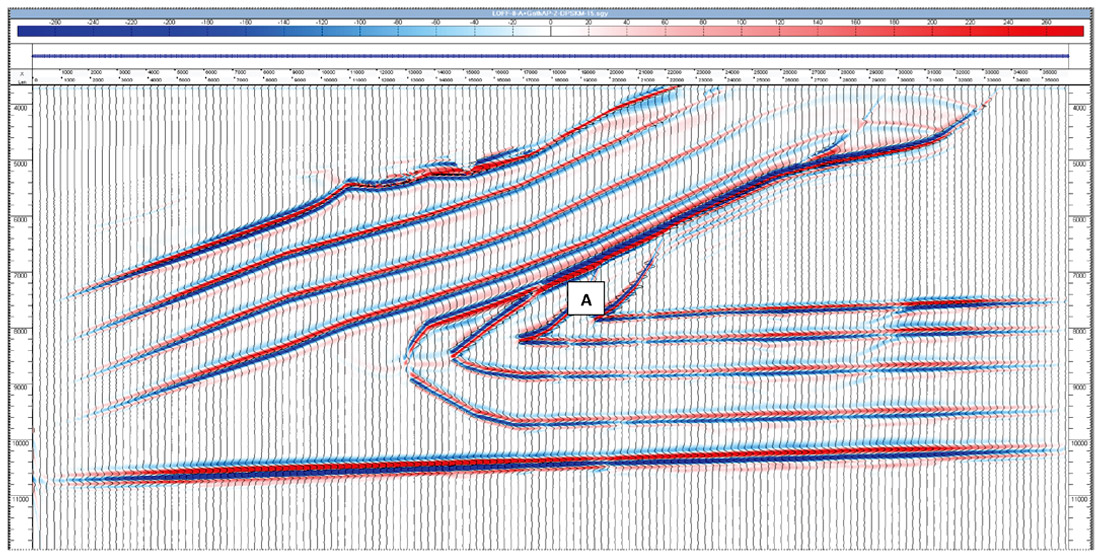
2D synthetic seismic shot records were simulated from this model using a finite-difference numerical representation of the wave equation that included P-wave primaries and interbed multiples but not converted shear wave or surface multiples (Figure 13).
The resulting data was then run through a Kirchhoff PSDM with a 7000 meter aperture. The travel times were obtained by solving the eikonal equation using finite differences. The geophysical modelling supports the concept that an overturned limb of the footwall syncline could be imaged in LOFF8 (Figure 14).
Revised Velocity Model
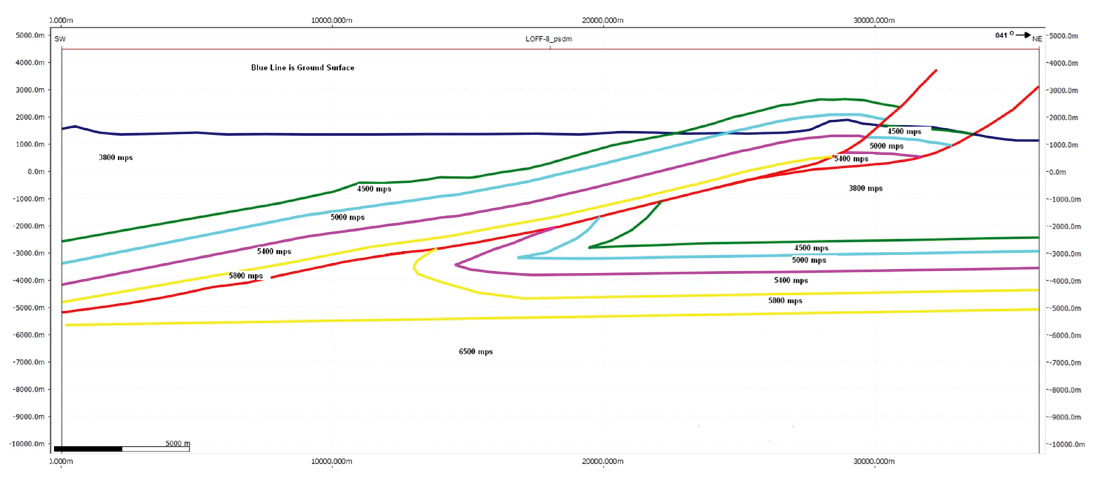
Based on the geological modelling from the 7-13 well, the velocity model for the LOFF8 was revised. An overturned limb of Paleozoic carbonates was added into the LOFF8 PSDM velocity model. (Figure 15).
PSDM Work Flow
To better image the seismic events, a PSDM approach was used. The depth processing section was characterized by the application of a wide-offset workflow consisting of the definition of an initial interval velocity field from the interpretation of pre-stack time migration, conversion of RMS velocity field in interval velocity field, sonic logs information and tomographic velocities (turning rays) for the shallower section of the model (about 2.5 km from surface). This was followed by an iterative loop of pre-stack depth migration and velocity updates in a layer-stripping fashion from top to bottom of the model.
The velocity update during the depth migration workflow relied on iterative geologic consistent velocity scans for the portions with low S/N ratio and Common Reflection Point (CRP) tomography. The selection of the appropriate velocity parameters was confirmed by a relative improvement of the stacking power on the seismic section and the flattening of migrated events in the Common Image Gather panels (CIG). The combined time/depth migration workflows allowed the definition of good structural details.
Conclusions
As a result of this work there are three main conclusions:
- The interpretation of LOFF8 provided an ideal platform to illustrate a workflow for integrating geology and geophysics in a processing stream for fold and thrust belts.
- The long offset, high intensity acquisition parameters of LOFF8 in conjunction with the PSTM and PSDM work flows improved the image of the overturned limb in the footwall of the Brazeau Thrust Sheet (Figure 16). This has application for other fold and thrust belts, especially where the sub thrust target is obscured by higher velocity geological formations at the surface.
- This process was successful in identifying a new deformation model for the Brazeau Thrust. It showed that a large fold with an amplitude of 3 km occurred early in the evolution of the structure. This was followed by the initiation of a thrust that carried the back limb of the fold to the NE by 10 km.

Acknowledgements
With thanks to:
Software
geoScout data base management software, geoLOGIC Systems Ltd, Calgary, AB, Canada
Move and 2DMove geological modelling software, Midland Valley Exploration Ltd, Glasgow, Scotland, UK
RDA dip analysis software, ResDip Systems, Houston, Texas, USA
Tesseral 2D seismic wave form modelling, Tesseral Technologies Inc., Calgary, AB, Canada
Seismic Data
LOFF8, Seis Ventures Res. Ltd, Calgary, AB, Canada


Join the Conversation
Interested in starting, or contributing to a conversation about an article or issue of the RECORDER? Join our CSEG LinkedIn Group.
Share This Article