Abstract
Three important parameters that need to be quantified for many permafrost studies are the location of ice in the ground, the position of thermal interfaces, and spatial variations of the water content in the active layer. The data from over 100 investigations in permafrost regions demonstrate that ground-penetrating radar (GPR) offers an effective way to measure these parameters at a scale appropriate for many process and geotechnical studies.
Horizontal to gently dipping interfaces between unfrozen and frozen subsurface zones (such as at the base of the active layer or a suprapermafrost talik) were repeatedly detected by GPR and indicated by strong, laterally coherent reflections. Coherent reflections are not generated by steeply dipping thermal interfaces (greater than 45 degrees). However, the transition from frozen to unfrozen ground can frequently be located from the radar stratigraphic signatures of the two units.
The radar stratigraphic signature of excess ice in the subsurface is determined by the size of the body. Ice lenses that are smaller than the resolution of the GPR system frequently can be detected and are represented by chaotic or hyperbolic reflections, while the size of larger ice units can be resolved and is defined by distinct laterally coherent reflection patterns. This enables the delineation of the vertical and lateral extent of massive ice bodies, and their structural setting.
By making precise measurements of the direct ground wave velocity, the water content in the near surface can be determined for uniform soils. It is demonstrated that by collecting a grid of GPR data the lateral variations in active layer water content can then be estimated.
Introduction
Ground-penetrating radar (GPR) is well suited to imaging the near-surface thermal structure and stratigraphy of permafrost. In this paper we demonstrate the advantages and limitations of using GPR for mapping the depth and position of thermal interfaces, location of excess ice, and active layer water content, using a series of case studies.
Arguably, one of the greatest hazards and geotechnical risks present in permafrost terrain is the melting of excess ice and the resultant destabilization of the ground. Ice volumes in excess of what can be contained within the pores of the surrounding sediment (excess ice) is frequently found in permafrost. In this situation the ice matrix is forced to support a portion of the overlying sediment load in addition to any structures on the surface. As a result, when sediment containing excess ice thaws, there is a decrease in soil strength as a portion of the load is transferred from solid ice to liquid water before the excess water can escape. This can lead to slope failure or surface subsidence. If the ice content and thermal conditions of the ground can be determined, problem areas can be identified and mitigative measures can be taken before failure occurs.
The traditional method for evaluating the risks associated with excess ice is to drill holes and directly measure the ice content. However, this is expensive, destructive and only provides point samples. Lateral interpolation between holes can be difficult in areas of high variability. Depth of thaw measurements are frequently made using a frost probe. Thaw probing becomes difficult and unreliable in stoney soil and areas where the depth of thaw is greater than 1.5 m. The potential geophysical methods to address these problems have been evaluated (e.g. Robinson 1994; Scott et al., 1978). In many situations, these methods have proven to be not completely effective. Along the Norman Wells pipeline, temperature cables and piezometers were installed, however, they provided data on the state of the slope at only one point. A lack of information on the more expansive area between these points led to the testing of GPR on a number of slopes along the pipeline (Moorman, 1994, 1995; Robinson and Moorman, 1995a, 1995b). Ground-penetrating radar has also been utilized to study the occurrence of massive ice (Dallimore and Davis, 1992; Robinson et al., 1992; Wolfe, 1998; Wolfe et al., 1997), frozen dam and road stability (LaFleche et al., 1988), frozen soil contamination (Arcone and Delaney, 2002), active layer development (Doolittle et al., 1990; Hinkle et al., 2001), and palsas and peat plateaus (Kettles and Robinson, 1996; Horvath, 1998; Doolittle et al., 1992). In this paper we discuss the fundamental properties of GPR and how those properties make it suitable for use in permafrost studies by using a radar stratigraphic approach and highlighting specific applications with case studies.
The Permafrost Setting
One of the most important aspects of the periglacial environment is the transition from frozen to unfrozen ground. Identification of thermal interfaces and mapping of thawed zones and their thickness or shape changes over time is an important component of monitoring periglacial processes. In the summer, as the ground reaches its maximum depth of thaw, the thermal interface approaches the base of the active layer, and the melting of excess ice can lead to raised pore water pressures and decreased sediment shear strength. Taliks that form around heated pipelines and beneath lakes and glaciers also can have a significant influence on the hydrology of the ground.
Thawed zones can be grouped into two groups: laterally continuous zones (e.g. the active layer) and localized thaw zones (e.g. taliks). Early work by Pilon et al. (1979) indicated the promise of using GPR to map the active layer, and Hinkel et al. (2001) demonstrated that, with modern GPR systems, the depth of thaw within the active layer can be mapped with a precision in the order of 10 cm vertically. By performing a tightly spaced grid of GPR surveys, Hinkel et al. (2001), showed how seasonal and inter-annual active layer variability could be monitored over a sizable area.
In surveying frozen rivers in winter, Arcone et al. (1992) were able to detect linear taliks beneath the river bed that were thought to be responsible for the creation of icings. However, the detection and delineation of irregularly shaped taliks and other interfaces between frozen and unfrozen ground present additional problems due to the complexity associated with the reflection of GPR pulses from sloping interfaces. By using radar stratigraphic techniques, we demonstrate how GPR can be effective for mapping the location and size of these supraglacial taliks, and other permafrost features.
The Application of Ground-Penetrating Radar
The strong relationship between the physical properties of geologic materials and their electromagnetic properties enables the identification of physical structures in the subsurface using electrical methods (Davis and Annan, 1989; Dallimore and Davis, 1987; Delaney and Arcone, 1982; Scott et al., 1978). The large contrast between the electromagnetic properties of ice, water and some sediment makes GPR a particularly effective method for mapping permafrost structure and thermal conditions (Table 1).
| Material | Dielectric constant κ' |
DC electrical conductivity σDC (mS m-1) |
Typical velocity v (m ns-1) |
Attenuation α (dB m-1) |
|---|---|---|---|---|
| Table 1. Dielectric constant, DC electrical conductivity, propagation velocity and attenuation properties of common geologic materials. (Sources: Davis and Annan, 1989). | ||||
| air | 1 | 0 | 0.3 | 0 |
| fresh air | 80 | 0.5 | 0.033 | 0.1 |
| sea water | 80 | 30000 | 0.01 | 1000 |
| pure ice | 3-4 | 0.01 | 0.16 | 0.01 |
| saturated sand* | 20-30 | 0.1-1.0 | 0.06 | 0.03-0.3 |
| saturated silt* | 10 | 50 | 0.09 | 26 |
| saturated clay* | 10 | 500 | 0.09 | 260 |
| limestone | 4-8 | 0.5-2 | 0.12 | 0.4-1 |
| *saturated with fresh water. | ||||
The velocity at which the electromagnetic energy travels in the ground is important in determining the depth of reflectors. In free space electromagnetic energy travels at the speed of light, 0.3 m ns-1. In the subsurface it travels at a fraction of the speed of light, usually in the range 0.01-0.17 m ns-1. When the conductivity of the ground is relatively low, a commonly used estimate of the propagation velocity (v) is:

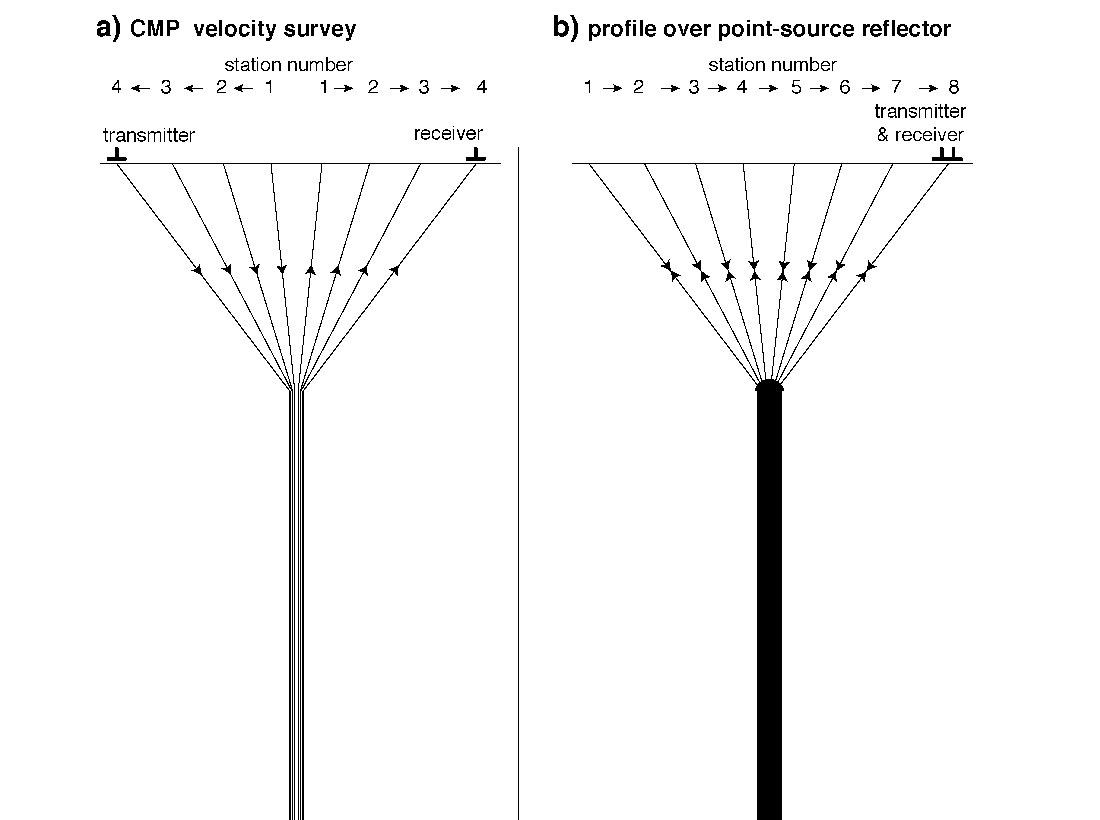
where (κ') is the dielectric constant. The typical propagation velocity of radar energy in a variety of materials is given in Table 1. The propagation velocity can be determined in three ways: 1) direct depth measurements, 2) common-mid point (CMP) velocity surveys, where the velocity is calculated from the direct arrivals and reflections off horizontal interfaces (Figure 1a), and 3) point-source reflection analysis, where the velocity is determined using the shape of diffraction patterns produced when profiling over point-source reflectors (Figure 1b). The same geometry applies to the reflection patterns generated by a point-source reflector in a profile, and a horizontal interface in a velocity survey. Details on specific data acquisition and processing parameters can be found in Moorman and Michel (2000).
Data Acquisition
Good data quality is largely dependant on a well designed survey and effective implementation. GPR systems currently on the market allow for the adjustment of various parameters enabling optimization for specific survey environments. System parameters that can be adjusted include: operating frequency, time window, sampling interval, stacking, antenna spacing, antenna orientation.
The frequency of antennae chosen influence the exploration depth, the resolution of the data, and the amount of clutter that is present on the profiles. As the frequency is lowered, the depth of penetration is increased and the amount of clutter present in the profiles decreases; however, the ability to detect and resolve smaller objects decreases.
The time window is the duration over which the system records the returns at each position. This and the propagation velocity determine the depth to which data will be recorded. It is generally recommended that it should be set in the order of 1.5 times larger than the maximum depth of interest. It is better to collect too much data than to find that a reflector of interest runs off the bottom of the plot.
The sampling interval determines how well the received waveform is digitally represented. The sampling interval required to effectively represent the shape of the waveform is a function of the frequency and the propagation velocity. Setting the interval too large degrades the vertical resolution of the data. Oversampling results in excess data file sizes and slower computing and plotting time. However, with the current computer technology, oversampling is not a significant issue.
Trace stacking involves the GPR averaging repeated radar traces. This increases the signal to noise ratio by suppressing unwanted, random, non-geologic noise. Depending on the amount of noise present, there is a limit to the number of stacks required before no further improvement in the data is achieved.
The separation between the transmitting and receiving antennas controls the geometry of the radar pulse travel path, the power reaching the target of interest, and the amount of energy traveling directly from the transmitter to the receiver (referred to as the direct air wave and the direct ground wave). A large antenna separation results in a time compression of the near surface reflections. If the two antennae are too close together, the large pulse of energy contained in the direct air wave and direct ground wave can saturate the receiver electronics and decrease its ability to detect the weaker reflections returned from within a few centimeters (up to several metres in pure ice) of the surface. To enable rapid data acquisition and ensure constant antenna seperation, the antenna assemblies can be fixed together.
Ground-penetrating radar surveys generally consist of either single transects or a rectilinear grid of transects. The rectilinear grid is often used where the three-dimensional geometry of the subsurface features is required rather than just the location of features. Grids take longer to complete but provide an extra dimension which can be very important when it comes to interpreting the slope or geometry of complex features. When performing a rectilinear grid of profiles the spacing between the profiles also determines what can be resolved beneath the surface. To optimize lateral interpolation, spacing between profiles should be the same as the station spacing. However, this parameter is often compromised to save time.
Case Studies
Delineating Thermal Transitions: Norman Wells Pipeline
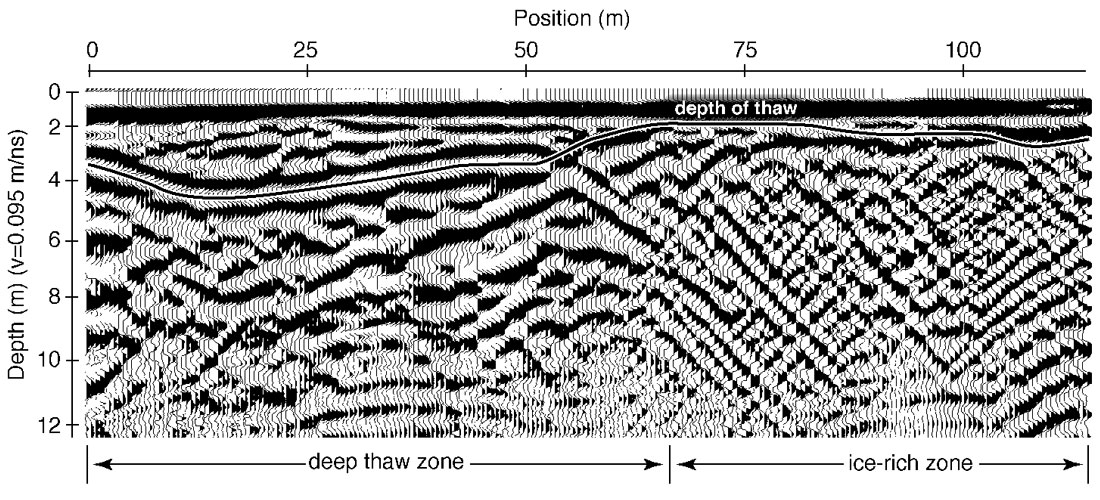
Mapping the transition from frozen to thawed soil is one of the most important challenges in northern geotechnical engineering and the study of geocryological processes. The strong contrast between the dielectric constant of frozen versus unfrozen ground generally results in a radar reflection being generated from this thermal transition (Table 2). Along the Norman Wells pipeline in the Mackenzie Valley of the Northwest Territories (N.W.T.), Canada, wood chips are used to insulate steep slopes and reduce the potential of slope failure associated with increased thaw. Even though it was covered with woodchips, a slope on the south side of Little Smith Creek (160 km south of Norman Wells) displayed particular thaw problems. Up to 1 m of surface subsidence was observed over 60 m of a cleared portion of the slope, and frost probing revealed thaw depths over 3.5 m at a number of locations on the slope. Figure 2 shows a GPR profile that was run parallel to the pipeline on this slope in July 1994. The interface between the frozen and unfrozen ground is indicated by a strong continuous reflection on the GPR profile. The steeply dipping diffraction patterns on the right side of the profile were created by shallow point-source reflectors; a radar stratigraphic pattern associated with numerous small ice lenses in the soil. The depth of thaw in the more ice-poor part of the slope (left side of the profile) extends to over 4.5 m beneath the surface, while it is considerably less in the ice-rich zone (right side of profile). The subsidence on the slope coincides with the location of the ice-rich soil. Thaw in the ice-rich portion of the slope was retarded by the latent heat effect associated with the excess ice.
At its steepest, the slope of the reflection from the thermal interface is in the order of 6°. At this low slope angle, the strength of the reflection is not diminished. However, when the slope of an interface approaches 45°, the amount of energy being reflected from the interface back to the antenna approaches zero. This was demonstrated in Moorman and Michel (2000). In situations where the slope of an interface is considerable, other methods of interpretation are required.
| From | To | Reflection coefficient |
|---|---|---|
| Table 2. Vertical incidence reflection coefficients for some permafrost settings. | ||
| unfrozen sediment (κ' = 25) | frozen sediment (κ' = 6) | 0.34 |
| unfrozen sediment (κ' = 25) | ice (κ' = 3.2) | 0.47 |
| frozen sediment (κ' = 6) | ice (κ' = 3.2) | 0.16 |
| frozen sediment (κ' = 6) | rock (κ' = 8) | -0.07 |
| frozen sediment (κ' = 6) | air (κ' = 1) | 0.42 |
Delineating Thermal Transitions: Martin River Peatland
In some situations, the geometry of a thermal interface is too complex or its slope is too steep to generate a laterally continuous radar reflection. However, the radar stratigraphic signatures can be used to distinguish areas of permafrost from unfrozen ground.
Figure 3 shows a GPR profile across an emergent peat plateau in the Martin River peatland, 15 km northwest of Fort Simpson, N.W.T., Canada. The peat plateau is elevated from the surrounding terrain by approximately 80 cm due to the formation of numerous small ice lenses in its core. Data from five cores and an excavated pit correlate well with the GPR interpretation of peat thickness (from less than 2 m to over 3 m) and general stratigraphy at the site.
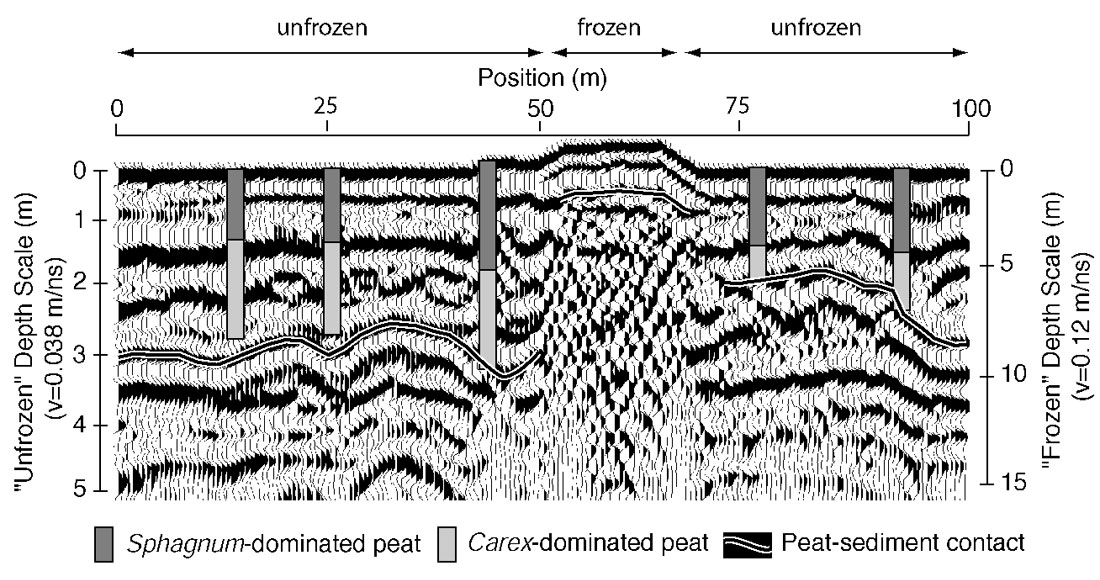
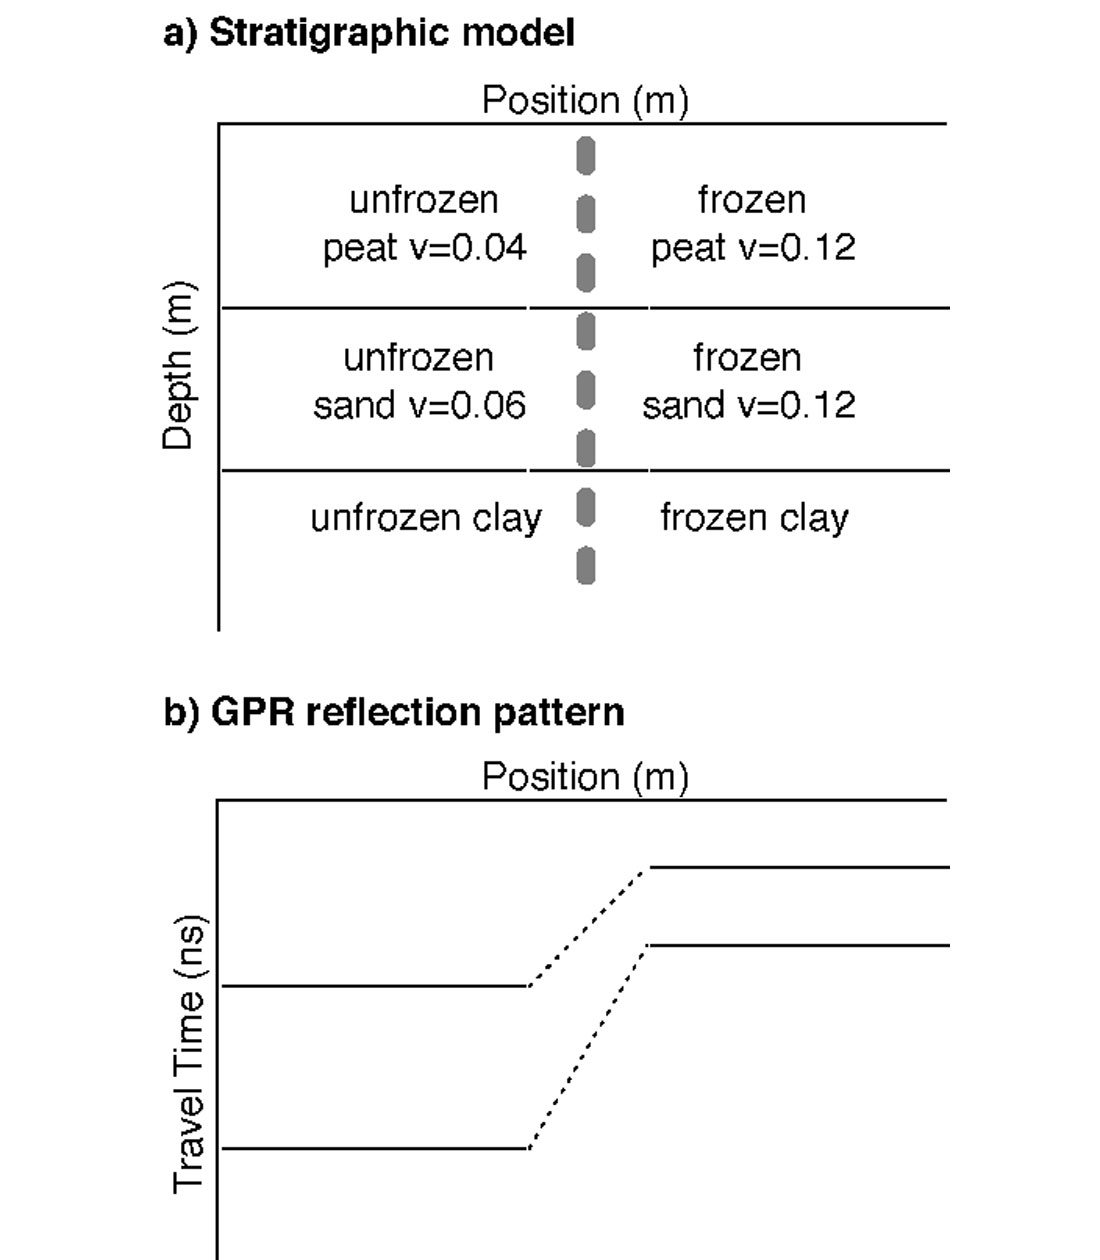
The radar stratigraphic patterns (steep-sided diffractions ) produced by small ice lenses within the high-velocity frozen peat plateau core indicate the presence of excess ice and frozen ground as in Figure 2. The radar stratigraphic differences between frozen and unfrozen areas of this peatland are also accentuated by disruption of continuous reflections from within the peat by the dramatic lateral changes in velocity between the frozen and unfrozen ground. The difference in travel times in frozen versus unfrozen peat is illustrated in the modeled section shown in Figure 4.
The lateral continuity of sedimentary interfaces is also disrupted by the differential heave associated with ice lens growth. The high amount of energy returned to the antenna from primary and multiple ice lens reflections also limits the potential to image the base of the permafrost at this location.
Delineating massive ice: Carat Lake
A massive ice body will appear as an individual radar stratigraphic unit on a GPR profile. The GPR profile in Figure 5 was collected as part of a large survey and drilling program at an ice cored esker-outwash complex at Carat Lake, N.W.T., Canada (Wolfe et al., 1997). The GPR profile is parallel to the long axis of the esker and displays the stratigraphic relationship between the massive ice and overlaying sediment. The core of ice is up to 7 m thick and buried beneath up to 12 m of glaciofluvial sediment.
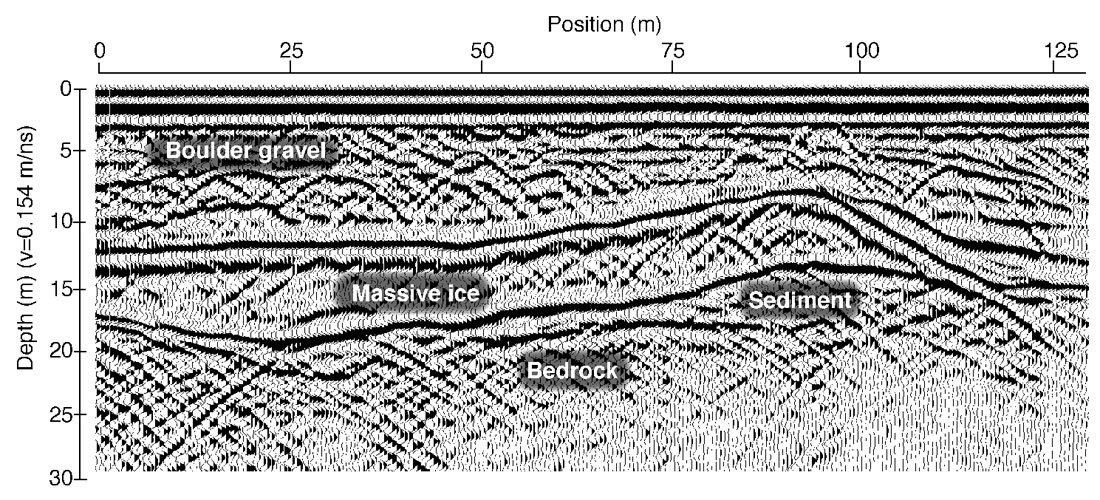
On the GPR profile there are many point-source diffraction patterns visible within the glaciofluvial sediment covering the ice unit. These returns are created by the cobbles and boulders within the sediment unit and from a boulder lag just above the massive ice. At the right-hand end of the profile, beyond the extent of the massive ice core, classic deltaic foreset structures can be observed between 4 m and 10 m depth.
At a nearby borehole, bedrock was discovered directly beneath the massive ice. The concentration of point-source diffractions from the ice-bedrock interface suggest fractures within the bedrock. Between 50 m and 110 m positions on this GPR profile it appears there may be a wedge of sediment up to 4 m thick beneath the ice.
Within the massive ice itself, there are very few reflections, due to the relative homogeneity of the ice. The ice body was void of sediment except for the occasional silt inclusion. Massive ice that is relatively sediment-free (such as buried glacier ice), and below the pressure melting point, tends to be transparent to GPR due to the lack of dielectric contrast within the ice (Moorman and Michel, 2000). The strong return from the base of the ice unit indicates that even though there are no reflections being generated from within the unit, the GPR signal propagates through the ice. This kind of radar stratigraphic pattern in which there are no internal reflectors, but good signal propagation, is characteristic for massive ice.
Monitoring water content variability: Taltheilei Narrows Runway
The water content of the active layer is central to the subsurface energy balance and a number of periglacial processes (e.g. frost heave or ground ice melt). However, monitoring the soil water content using methods such as direct gravimetric measurement or time-domain reflectometry is labour intensive or only provides point measurements. As the dielectric constant is a function of water content, temporal and lateral changes in soil moisture content can be monitored with GPR. The simplest method is to examine the variability in the arrival time of the direct ground wave. If the antennae are kept at a constant separation along the GPR transect, changes in the separation between the direct air wave and direct ground wave will be the result of changes in the propagation velocity within the near surface sediment. The propagation velocity is directly related to the dielectric constant, which varies with water content. The relationship between water content (θ, measured in m3m-3) and dielectric constant has been determined:

where κ is the dielectric constant and a and b are constants. The mineralogical composition and organic matter content of the soil has an effect on this relationship. However, with calibration of a and b through direct measurement at a few locations within the study area, precise water content values have been calculated using the dielectric constant. Huisman and Bouten (2002) showed that, with precise time measurement of the GPR direct ground wave, the water content can be calculated with a precision of 0.003 m3m-3.
The constraints of this project did not permit site-specific calibration, and since the absolute water content was not essential, the equation used by Herkelrath et al. (1991) that was calibrated in a similarly textured soil was employed:

A gravel runway was constructed from glaciofluvial material in permafrost terrain near the Taltheilei Narrows of Great Slave Lake, N.W.T., Canada. The positioning of the runway resulted in a portion of a stream being rerouted around the runway and the old channel being filled in. In conjunction with a project to examine the sediments beneath the runway fill, a GPR survey was conducted in the area of the paleochannel on August 21-22, 2002. Forty-eight parallel GPR transects, spaced 2 m apart, with 0.5 m between traces, were run across the runway. These data were used to determine if increased subsurface water flow along the paleochannel route was leading to an increase in the water content of the active layer.
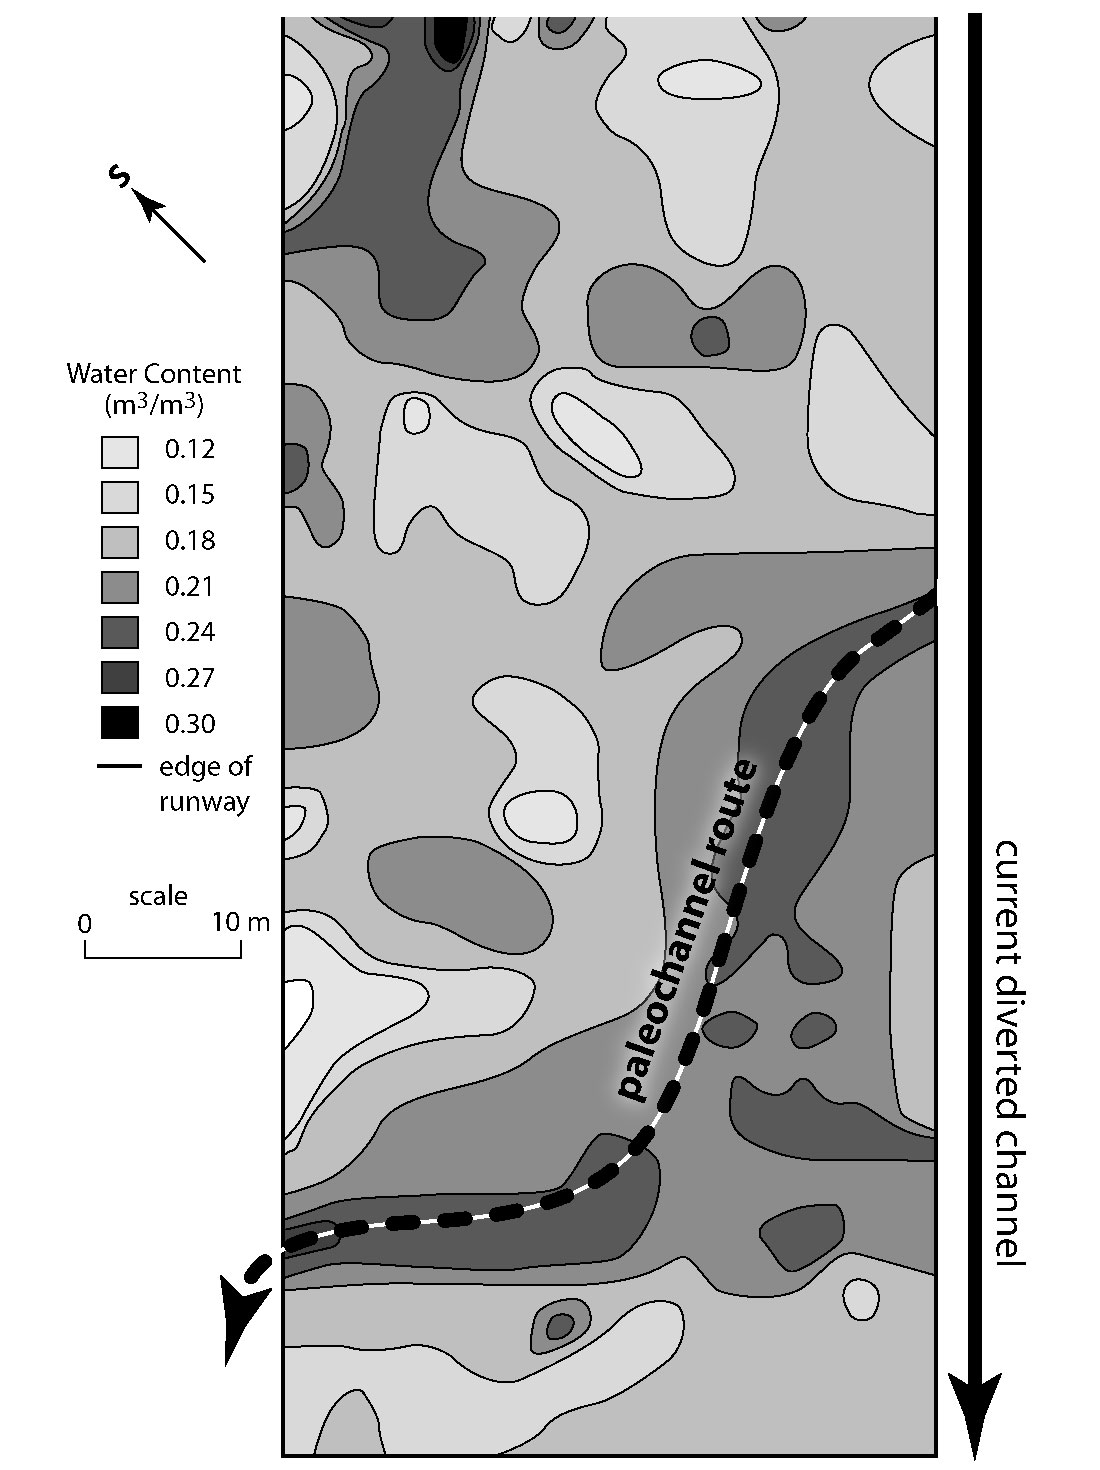
Differences in the arrival time of the direct ground wave were used to estimate the spatial variability in near surface water content. Figure 6 displays the map of calculated water content across the portion of the runway around which the stream was rerouted. Considerable variation in water content is present across the runway, and there is an increase along the route of the paleochannel. The increase in water content is likely the result of water migration across the runway along the paleochannel route.
The lateral variability in water content in other areas of the runway is likely due to variations in sediment grain size.
Discussion
Radar Stratigraphy
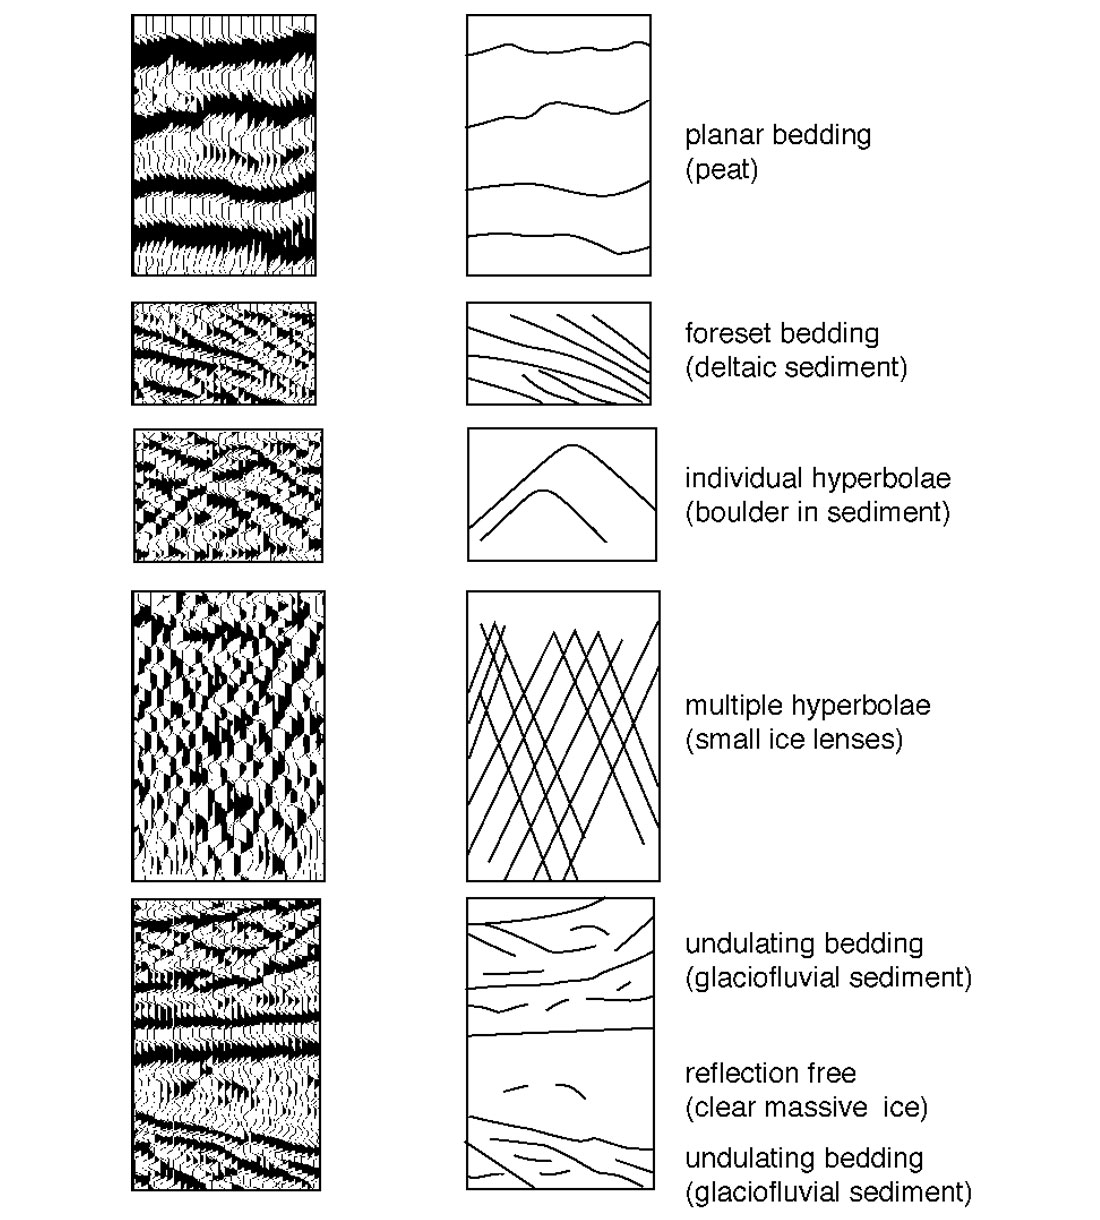
One of the most valuable aspects of GPR is the ability to image the subsurface in two, even three dimensions. Similar to any other kind of imaging, the picture is not a direct replica of reality but a representation of it. As such, a GPR profile does not represent a section through the ground, but is a pseudo-section that must be interpreted. Fortunately, the radar stratigraphic patterns produced by sedimentary structures enable the differentiation of subsurface units. Typical radar stratigraphic patterns for sedimentary structures and subsurface ice bodies are shown in Figure 7.
A thermal interface is sometimes superimposed on sedimentary structures. For gently dipping thermal interfaces, it is represented by a laterally continuous reflection that can cut across the returns from the sedimentary structures. It is this cross cutting relationship that assists in its identification, since cross cutting relationships such as this are seldom observed in unconsolidated sediments. In areas where there is an abrupt, near vertical transition from permafrost to seasonally frozen terrain, a distinct reflection will not be produced, however, the change in radar stratigraphic patterns can assist in locating the interface.
Limitations
The success of a GPR investigation is dependant on three factors: 1) the features of interest being different enough from the surrounding material that they produce a strong and identifiable reflection, 2) the depth of penetration of the GPR system being great enough to image to the depth of interest, and 3) the reflections from surrounding features or noise produced by the subresolution features being minor enough as to not mask the features of interest.
As discussed earlier, the reflection coefficient between frozen sediment, unfrozen sediment, and ice is generally great enough to generate high amplitude reflections with GPR. The one exception to this may be in silts and clays that have a very gentle temperature gradient. In such cases the change in unfrozen water content with depth may be so gradual that it would manifest itself as a zone of change from frozen to unfrozen instead of a distinct interface. However, the high rate of attenuation in clay generally overshadows this problem.
Because the rate of signal attenuation in frozen sediment is low, GPR investigations in permafrost terrain can generally extend to greater depths than those in unfrozen environments. In well frozen ice-rich ground, it is not uncommon to be able to image down to 25 m, whereas the depth of penetration in unfrozen peatlands can be limited to less than 10 m.
One of the greatest problems that can be incurred in GPR surveying permafrost environments is the noise caused by the diffractions from small ice lenses. The result is interference that masks deeper features and structures (Figure 7). In clay-rich sediment, seasonal ice lenses may also have a similar effect.
Boulders in the subsurface can also be a significant source of noise. Depending on their size, large clasts in sediment can create hyperbolic diffraction patterns (Figure 7). This noise can mask reflections of interest but it can also provide information on lithologic change in the subsurface. The temperature gradient at the base of permafrost is generally much smaller than at the top of permafrost. This can lead to a very broad frozen fringe, which along with noise and signal attenuation results in the base of permafrost seldom being imaged.
Another issue in using GPR to map discontinuous permafrost is the dramatic lateral variations in propagation velocity and the result this has on reflection continuity. At the edge of a frozen zone, the propagation velocity can change by 300%, resulting in considerable shifts in the apparent depth of reflectors on GPR profiles. This generally assists in locating near-vertical thermal transitions. However, if not taken into consideration, it can result in dramatic errors in interpretation.
When mapping water content variations of the near surface, lateral changes in sediment type or organic matter content can affect the estimated water content. As well, if there are considerable variations in the depth of thaw, the velocity of the direct ground wave may be affected. For example, if the depth of thaw is very shallow, a portion of the volume that a radar pulse is traveling through may be frozen, thus altering its velocity.
Conclusion
By utilizing the fundamental principles of electromagnetic energy propagation, wave reflection, and radar stratigraphy, specific characteristics of lithologic and thermal units within permafrost can be distinguished using GPR. The case studies presented in this paper illustrate the application of GPR for mapping: 1) the seasonal depth of thaw and suprapermafrost taliks, 2) the location of small ice lenses and the geometry of massive ice bodies, and 3) spatial variations in the water content within the active layer.
The contrasting physical properties of water and ice result in GPR being a very effective tool for mapping the location and depth of thermal interfaces and ice bodies within permafrost terrain. The characteristics of radar wave propagation within the ground also enable the determination of lateral variations in water content within the active layer.
Because of the impact that the dielectric constant has on propagation velocity, dramatic lateral variations in GPR reflection character can be observed over short distances in areas of discontinuous permafrost.

Acknowledgements
The authors would like to thank Alan Judge, Paul LaFleche and Vic Allen for their pioneering work in using GPR for permafrost investigations at the Geological Survey of Canada and the knowledge, assistance and guidance they provided us. This work could not have been accomplished without the assistance of many field assistants. The efforts of all of those involved in our GPR surveys over the years are greatly appreciated. This research was supported by the Geological Survey of Canada, Polar Continental Shelf Project, Natural Sciences and Engineering Research Council, Northern Science Training Program, Indian and Northern Affairs Canada, Interprovincial Pipelines. The assistance of Ms. Inez Kettles in our peatland work is greatly appreciated. The leadership of Dr. Stephen Wolfe in the Carat Lake study was also valued. This manuscript was improved by the insightful review of J. Doolittle, N. Matsuoka and an anonymous reviewer.
This paper was first published in Permafrost and Periglacial Processes and is reprinted here with kind permission of Brian Moorman.


Join the Conversation
Interested in starting, or contributing to a conversation about an article or issue of the RECORDER? Join our CSEG LinkedIn Group.
Share This Article