Summary
In hydrocarbon-producing sedimentary basins, the crust can be modelled as a poroelastic medium. The stress state of a poroelastic medium, which entails both the shear and normal stress of the rock, is influenced by pore-fluid diffusion. Coulomb stress changes due to pore pressure changes in a poroelastic medium may lead to microseismic events. This is also true of any hydraulic fracturing where the fluid injection changes the pore pressure and hence, changes in the mean stress of the medium. Despite the fact that poroelastic dynamics are highly complex even with homogeneous properties, understanding the physical process of pore-fluid induced microseismicity is critical to planning and carrying out successful hydraulic-fracturing experiments. In this work, we introduce the concept of Coulomb failure stress changes as applied to the study of regional static stress changes in tectonically active earthquake areas causing spatially predictable aftershocks. We consider the reasons to think beyond the double-couple mechanism as a source characteristic for microseismicity due to hydraulic fracturing. Here, we show examples of Coulomb failure stress maps for the first time to our knowledge when non-double-couple mechanisms operate.
Introduction
Coulomb stress failure changes have been extensively studied in the context of earthquakes where the source mechanism is dominated by double-couple mechanisms. For reasonably well-estimated moment tensors from the measured three-component waveforms at many seismic stations favorably located in the vicinity of earthquake prone areas, automated methods are now available to compute the Coulomb stress failure maps (Lin and Stein, 2004; Toda et al., 2005; Toda et al., 2011). Such maps are routinely generated for earthquakes on strike-slip faults, normal faults, and reverse faults. The maps contain both positive and negative stress failure regions with positive regions spatially designated as regions favoured for aftershocks. The importance of pore pressure changes subsequent to earthquakes in releasing fluids along faults and fractures, and in the spatial distribution of aftershocks in actively tectonic zones has been the subject of research studies in recent years. Not surprisingly, what has been observed for large earthquakes is found to hold good for microseismic events and their aftershocks.
It is becoming a common industry practice to collect microseismic data from either one or many observation wells with a multiple array of sensors. In addition to accurately locating the events, establishing their mechanisms is an important issue. The accuracy of the location information is much sought after particularly when only one well is present and the velocity information of the invaded formation from the injected fluid is not fully factored into travel-time procedures. Despite these challenges, rapid strides in advancing accurate determination methods are being made. Aside from the commonly understood and accepted double-couple slip mechanisms for the occurrence of microseismic events in a hydraulic fractured medium, the role of compensated linear vector dipole (CLVD) and the isotropic tensor components has been stressed in recent studies (Baig and Urbancic, 2010). In this work, we visit the topic of Coulomb stress failure changes as has been applied to strike-slip fault earthquakes in predicting the spatial distribution of aftershocks. Against this background, we consider the pore pressure changes of fluids on aftershocks in tectonically active regions and in creating earthquake swarms upon injecting fluid into a formation to enhance oil/gas production in a sedimentary basin. We point out the growing role of a weighted moment tensor solution with double couple, non-double couple and volumetric components.
Theory and Method
The Coulomb failure criterion is commonly used to characterize failure in rocks. Both the shear and normal stress on a preexisting or an incipient fault plane satisfy conditions analogous to those of friction on a preexisting surface. The Coulomb stress, also referred to as Coulomb failure function, is given by

where τβ is the shear stress on the failure plane, σβ is the normal stress (positive for extension and negative for compression), p is the pore fluid pressure, and μ is the coefficient of friction. When CFF exceeds a critical value, failure occurs on the plane (Figure 1,left). Certain modifications to the above equation have been suggested for cases where rock stress is changed more rapidly than fluid pressure can change through flow. In a system where the x- and y-axes and fault displacements are horizontal and fault planes are vertical (z-axis), stress on a plane at an angle ψ from the x-axis (see Figure 1) is
For example, the Coulomb stress for a right-lateral motion on planes orientated at ψ with respect to the x-axis is

King, Stein and Lin (1994) have successfully applied the static Coulomb failure stress changes for any earthquake event where the source characteristics for a given moment magnitude are known from well-established moment tensor inversion methods. Figure 1 illustrates one example where they have demonstrated the usefulness of their method in identifying the spatial locations of aftershocks of earthquakes with the positive Coulomb failure stress changes.
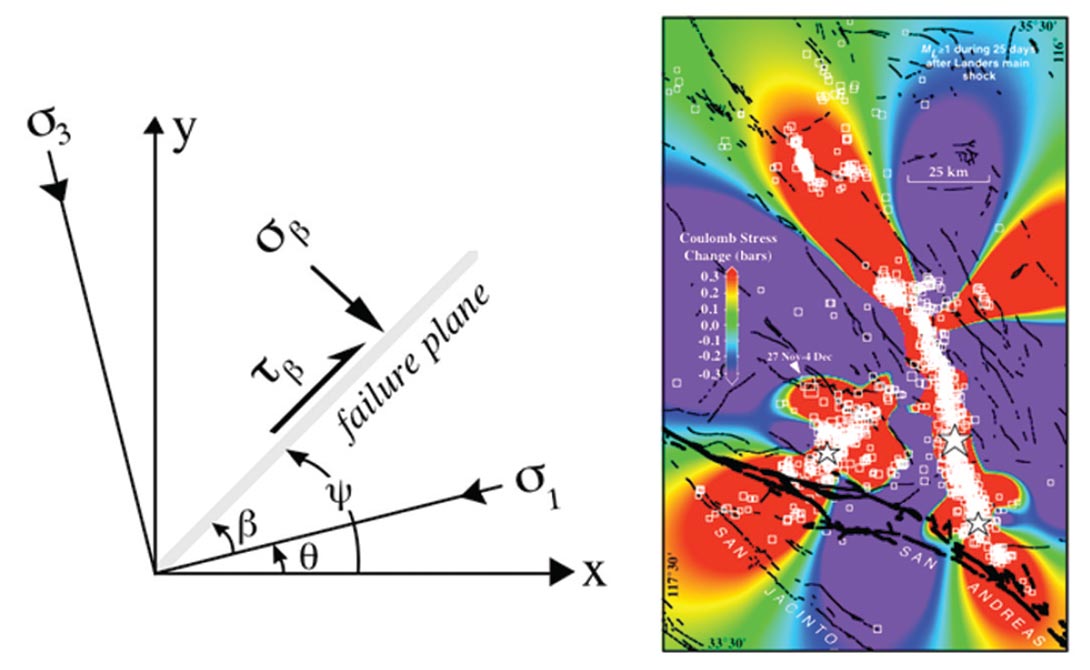
Figure 1. (left) The axis system used for Coulomb stress (after King, Stein and Lin, BSSA, 1994); (right) The largest Coulomb stress changes at depths between 0 and 12.5 km caused by the Landers, Big bear and Joshua Trees earthquakes with the first 25 days of seismicity. Also shown are the largest two aftershocks to occur during the following 8 months, the November 17, 1992 (ML = 5.3) and December 4, 1992 (ML = 5.1) shocks (from King, Stein and Lin, 1994).
Models
Naturally-occurring fractures and induced fractures influence processes such as formation of ore deposits, changes in fluid pressure and stress states during earthquake cycles, flow in hydrothermal systems, and performance of hydrocarbon reservoirs (Hickman et al., 1995; Sibson, 1997, 2000; Berkowitz, 2002; Bosl and Nur, 2002; Rothert and Shapiro, 2003; Miller et al., 2004; Fischer and Horalek, 2005; Edelman, 2006; Fischer et al., 2008; Maxwell et al., 2010; Barnhoorn et al., 2010). Induced fracturing in formation rocks has been used to enhance oil and gas production in exploration industry for several decades, as was initially documented in the middle of the twentieth century (Clark, 1949; Hubbert and Willis, 1957).
Geometrically speaking, naturally-occurring and induced fractures vary in length scale, ranging from micrometers to centimeters. Induced fractures from hydraulic fracturing are closely associated with microseismic events. We assume that for the magnitudes of these events that usually lie between -1 and -3, there is a fraction of a millimeter to millimeter in displacement due to shear or a few millimeter squared in rupture area. Since there is no a priori or a posteriori structural information available, we undertake modelling studies.
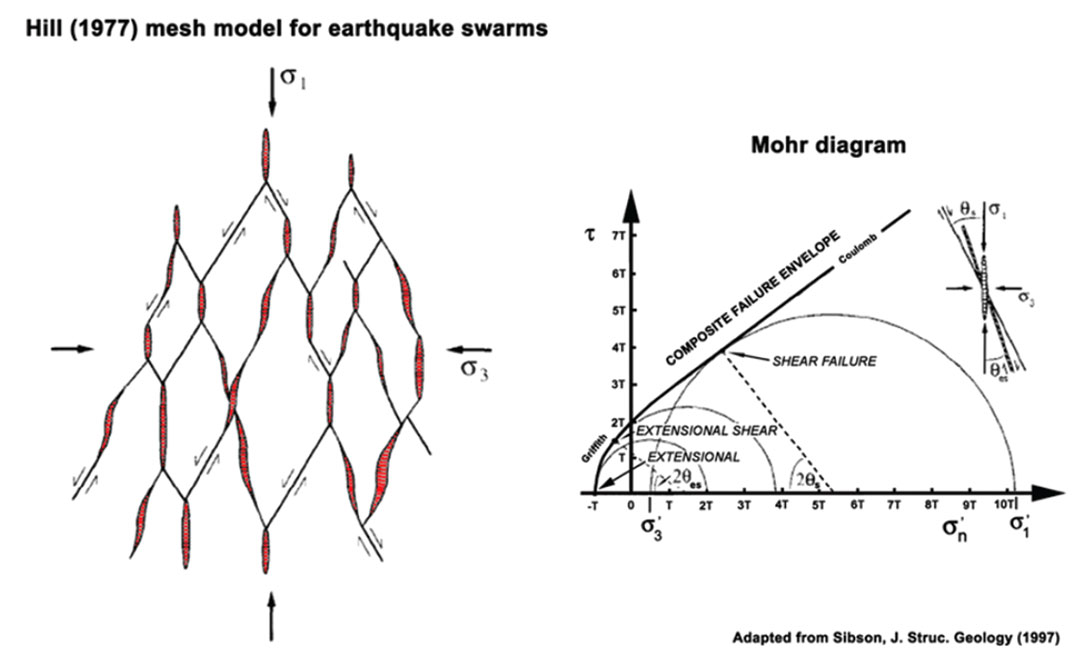
For the hydraulic fracturing experiment, we consider the approach of Sibson (1997) to be valid. As shown in Figure 2 (left), the formation rock is made up of layers of inter-linked “meshes” subsequent to hydraulic fracturing. For such a scenario, we use the Coulomb failure stress condition, as represented by the Mohr diagram (Figure 2 (right)). We look upon the red-hashed area within each mesh as being representative of the rupture geometry. Although the Hill model (1977) is representative of fractures, based on geologic evidence, what combination of double couple, non-double couple, and volumetric forces would emulate them is not an easy problem. The generality of the mesh model, however, is appealing since the embedded features in them can be easily incorporated into a complex network model for a study of the fluid-induced fractures, recently suggested by Vasudevan and Eaton (2010).
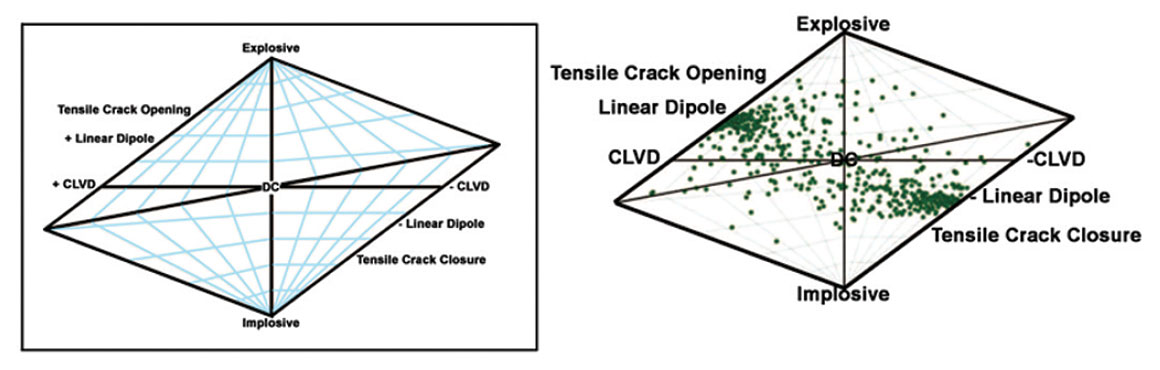
Figure 3. (left) A source-type diagram for microseismic events in a hydraulic fracturing experiment. A microseismic event with a hybrid source mechanism comprised of double-couple, compensated linear vector dipole, and isotropic contributions to the moment tensor enters as a point in this diagram; (right) A source-type diagram for one treatment in a well from a field.
In spite of the challenges, attempts have been made to use sourcetype diagrams (See Figure 3), with them populated with microseismic events satisfying certain hybridization of all different types of forces contributing to the source mechanism (Hudson et al., 1989; Urbancic et al., 1993, Baig and Urbancic, 2010). We consider in this paper how we deal with the generation of time-dependent Coulomb failure stress maps, given a microseismic catalogue generated from a six-stage hydraulic fracturing experiment.
Data processing
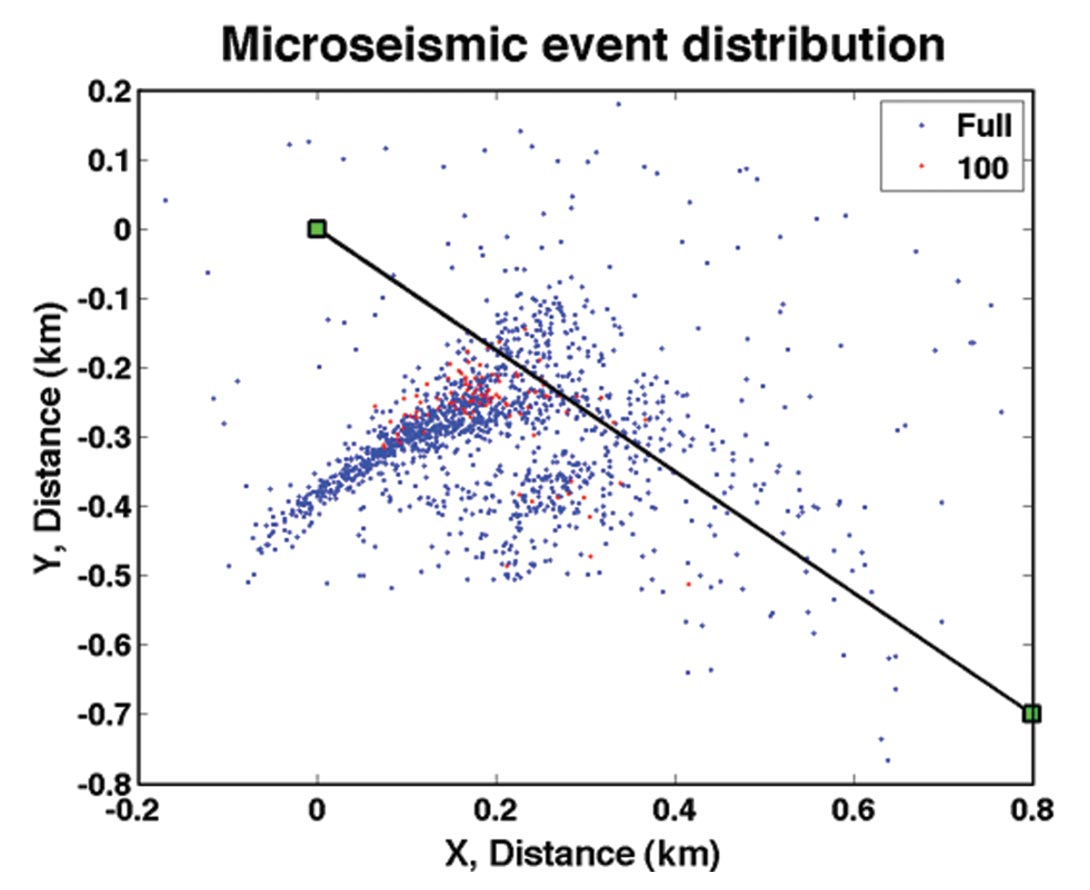
We use the stage 6 results from a microseismic catalogue derived from a hydraulic fracture treatment in central Alberta. In the map view of the location of the experiment, we illustrate all of the recorded events, marked in blue, and the first 100 events, marked in red, in Figure 4. The events have registered a magnitude less than -1 and greater than -3. This means that each one of the events has undergone not only very minute volumetric change but also slip or displacement due to shear. The data in this graph not only show distinctive clusters but also reveal near-field and far-field occurrences.
We compute the Coulomb failure stress changes using the recipe given by Okada (1985) and Toda et al. (2010). To keep the process tractable, we have made a few assumptions. We treat all microseismic events alike in the initial treatment. For any given window of microseismic events, we keep the total magnitude to be less than -1, thus honouring qualitatively the magnitude of any given event to be closer to -2. We assume that the minimum horizontal stress direction and the strike direction for all the events are the same. For simplicity, we keep the volumetric changes from crack opening and crack closing the same for all events. To accommodate non-double couple source mechanisms, we assume the CLVD to be a linear combination of double couple source mechanisms. Finally, in the spirit of keeping all microseismic events alike, we do not alter the source-characteristics for the events for any given double-couple forces. We use the software, Coulomb 3.2 (Toda et al., 2010) to do the necessary computations for Coulomb failure stress changes with input parameters associated with fracturing and the associated microseismicity in the upper crust.
Results and interpretation
With the conditions specified above, we calculated the Coulomb failure stress changes for the first 25, 50, 75 and 100 events from the catalogue. Here, we assume the role of only shear failure caused by the strike-slip mode. For the double-couple mechanism in operation, we present the Coulomb maps for the four panels in Figure 5. To conform to the general usage of the maps, the positive Coulomb failure changes are marked in shades of red and the negative Coulomb failure changes are marked in shades of blue. The zones corresponding to a positive Coulomb stress change are indicative of likely places where the “next” failure occurs with a new node to the fracture network. It is important to note that although the stressfield changes associated with microseismicity are very small, for an easy understanding of the process, we scale the stress-field images.
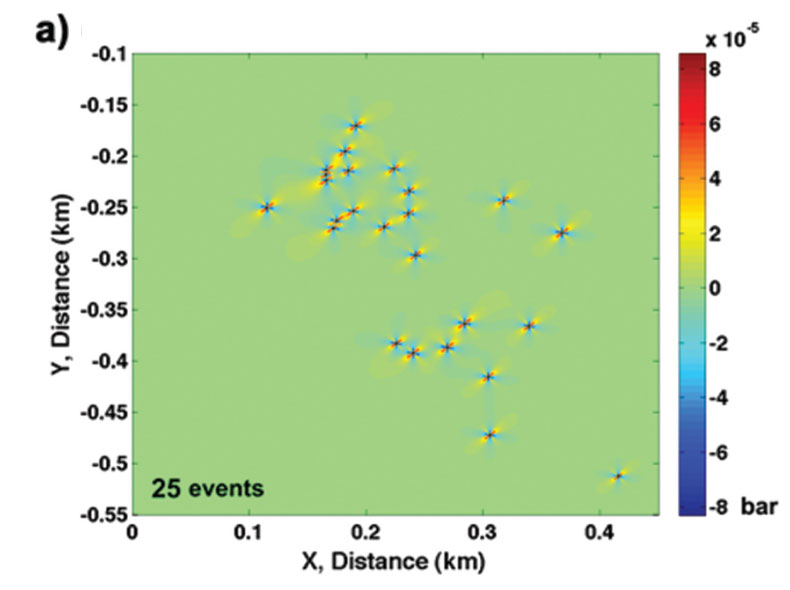
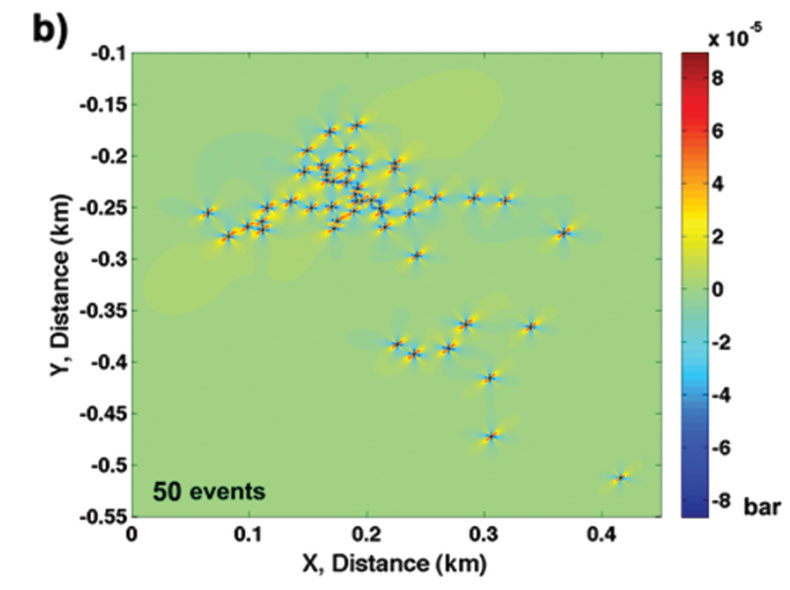
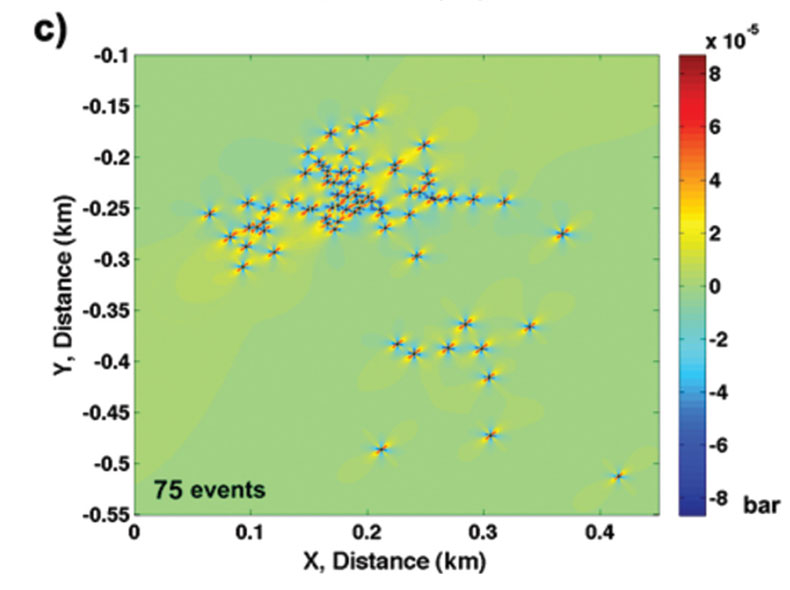
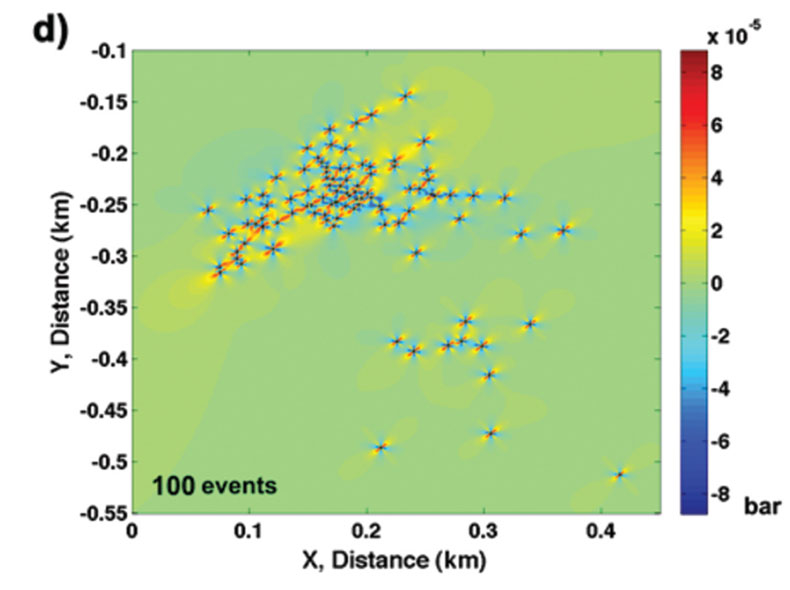
Even with the map view of the Coulomb maps, it is easy to ascertain the direction and orientation of the fracture growth. First, we go from the first 25 events to 100 events, the hydraulic fracturing in this instance near- and far-distance events with respect to the source. Second, the directionality, which is roughly in coincidence with the maximum stress-field direction, of the fracture growth appears to be established in the initial stages of hydraulic fracturing. Third, there is a notable absence of an increase in trend of microseismic events in zones where the Coulomb failure changes are negative, roughly in coincidence with the least stress-field direction.
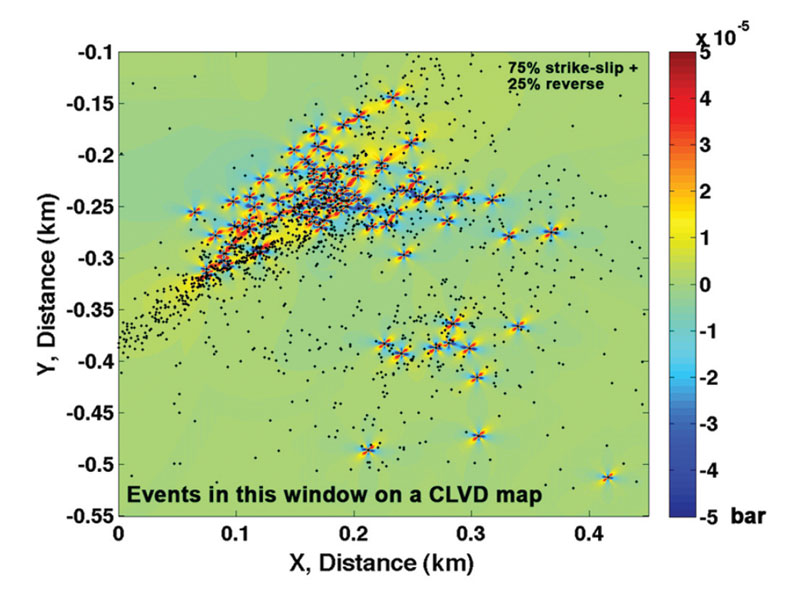
As was stated earlier, the hydraulic fracturing could be closely modelled after tensile crack opening followed by tensile shear (Figure 3). A close analogy to this is found with microseismicity in geothermal reservoirs or in seismicity- swarms noted around a cauldron of a volcano (Julian and Sipkin, 1985; Miller et al., 1998). In the latter case, moment tensor inversion of the observed seismicity-swarms points to forces that accrue from volumetric and deviatoric components. A unique way of representing the solution in terms of simple tractable components is not easy. However, for a model that would closely mimic the hydraulic fracturing experiments in some cases, the forces are non-double such as compensated linear vector dipole (CLVD) in nature. Any uniaxial compression or tension associated with high-pressure fluid injection follows the CLVD source mechanism. The CLVD can be expressed as a linear combination of two orthogonal double-couple forces. Again, we face a problem of the weights of the linear combination. For demonstration purposes, we show in three panels (Figure 6) the results of tensile extension and strikeslip occurring in a coupled fashion. They also lend support to source-type diagrams such as the one given in Figure 3.
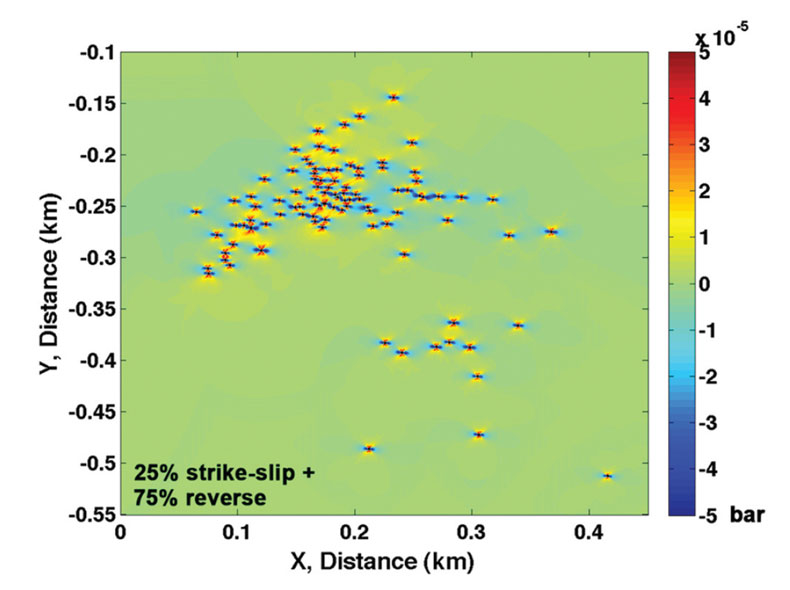
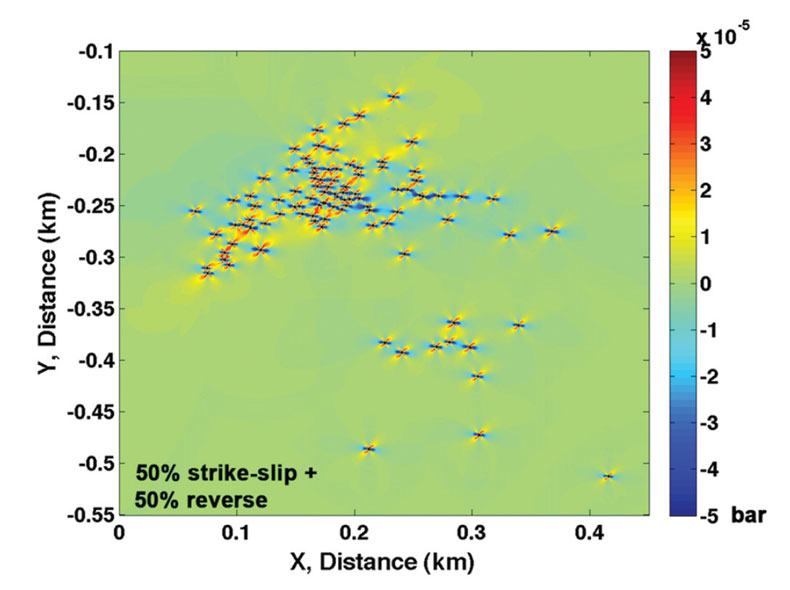
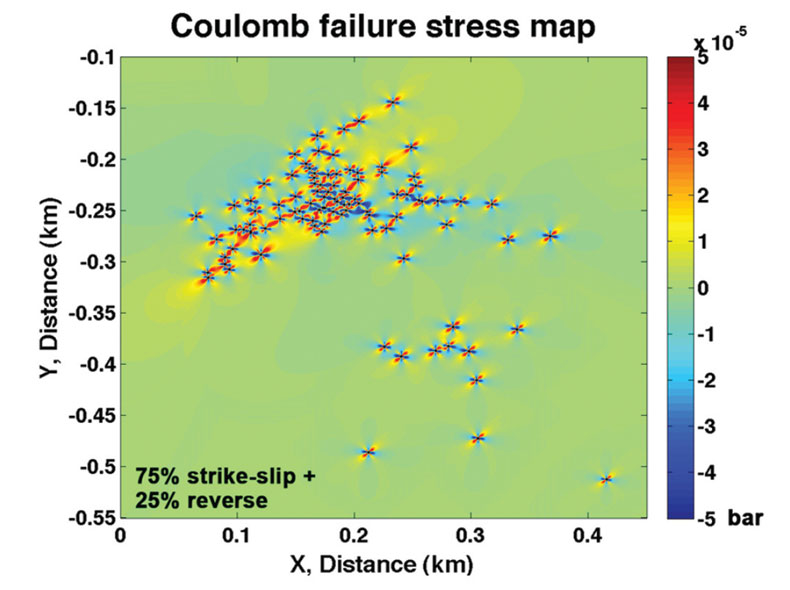
From Figure 6, it is evident that the weights of the linear combination dictate the relative direction in which the fracture growth could occur. Larger the strike-slip component is more pronounced is the direction in which the fracture growth is likely to occur.
In Figure 7, we overlay all of the microseismic events that fall within the study window used on the Coulomb map corresponding to Figure 6c. This simple illustration suggests that a majority of the events fall in the positive zone of the Coulomb failure stress map. Since we did not capture the Coulomb failure map with the advancing stress-front, i.e. mapping beyond 100 events, it is not surprising to see some events from the catalogue fall in the negative zone of the Coulomb failure map.
With this simple framework in place, it is possible now to relax the constraints imposed in generating the maps of the failure stress changes. One of the significant steps forward here might be that we could start quantifying the influence of hydraulic fracturing and the performance of the formation that has undergone it.
Conclusions
Understanding the conditions under which Coulomb failure stress changes in a brittle crust under the influence of pore pressure changes of the injected fluid become positive is important. The crust in hydrocarbon producing sedimentary basins is under stress even in its undrained state of the pores. Whether or not the formations have naturally occurring fractures and faults, any increase in pore pressure means an increased resistance to normal forces. When the shear stress failure criteria are met, slip will occur on the existing fractures and faults, or new fractures will form. Usually, these new fractures are oriented in the regional stress field. For a fluid injection along the minimum shear stress direction, i.e. the least principal stress axis, fractures appear in a direction perpendicular to this, i.e. along the greatest principal stress axis. Results of hydraulic fracturing experiments seem to suggest that in addition to shear failure, tensile cracking with initial extension and extensional shear could influence and in some instances, dominate the Coulomb failure stress changes. To accommodate this scenario, provision should be made for depicting the Coulomb failure stress changes when doublecouple and non-double couple forces operate. We have shown here examples of Coulomb failure stress maps in such instances.
Maps of static stress changes in the initial stages of fracture growth point to the orientation and direction of fractures within which microseismic events have taken place. Generating the Coulomb failure stress maps on a routine basis for analysis is impeded by the lack of information on exact locations of microseismic events and their source characteristics of microseismic events in many instances, thus lowering the expectation of reasonable sub-surface fracture maps from Coulomb stress field maps.
We also notice that fluid injection at any stage of the hydraulic fracturing experiment causes near- as well as far-field stress changes. This is manifested in the near and far locations of the events with reference to the source pulse.
In this study, we have provided examples of Coulomb failure stress maps in 2D, although the stress changes take place in 3D. This will be the topic of discussion in our future papers. Since the spatio-temporal occurrences and recurrences of microseismic events are complex, understanding the dynamic stress changes in any hydraulic fracturing experiment is crucial. In the light of observations noted above, it would be a useful exercise to supplement the observed microseismic experiments with Monte- Carlo simulations of hydraulic fracturing and generating the Coulomb failure stress maps of resulting fractured networks.

Acknowledgements
The authors would like to acknowledge the Natural Sciences and Engineering Research Council of Canada for financial support. They express their gratitude to Microseismic Industry Consortium for their support and providing their permission for publication of the material reported in this paper.
Related Reading


Join the Conversation
Interested in starting, or contributing to a conversation about an article or issue of the RECORDER? Join our CSEG LinkedIn Group.
Share This Article