Summary
Seismic waves propagating in the subsurface are attenuated. This loss is frequency dependent i.e. higher frequencies are absorbed more rapidly than lower frequencies resulting in a narrow frequency spectrum. Since the seismic trace is a superposition of many overlapping reflections it is often difficult to identify the exact reflection boundaries. So there is a need for a method to enhance the frequency content of seismic data to make subtle geologic features more easily identifiable. Enhanced seismic data shows a significant increase in resolution resulting in detailed reservoir stratigraphy, clearer pinchouts and structures as the event can appear more sharply defined and less affected by low frequency noise. But enhancement of frequency, in most cases, also leads to an increase in noise levels along with higher resolution. In this paper, an attempt has been made, to outline and compare several frequency enhancement techniques on a single dataset. The dataset used here is from a 3D shallow water survey off western coast of India with a clastic carbonate setup.
Introduction
Often we come across examples where the seismic volume leads to interpretations which involve complex fault patterns, subtle stratigraphic plays or reservoir extent. In such cases more accurate stratigraphic interpretation is required, but the available bandwidth of seismic data may be inadequate to image the proper resolution of the target.
This problem can be addressed by having data of reasonably good quality and making use of some high frequency restoration procedure that improves the vertical resolution . Amongst other things, this enables confident mapping of horizons of interest, clarifies detailed geological settings, and leads to more profitable seismic exploration.
There are many approaches for the frequency enhancement of seismic data, that range from spiking deconvolution, Q-compensation, Spectral Whitening to Loop Reconvolution (Young 2005). In this paper, we have compared some of these frequency enhancement methodologies.
Theory and Methodology
Depending on their depths, many subsurface hydrocarbon bearing reservoir are below the resolution limit of seismic data. Even if we are able to detect them, it is difficult to map and characterize the extent without increasing the bandwidth of the data. This problem is more pronounced in compact lithologies and carbonates which have higher velocities and hence will be prone to tuning at much less time thickness. Research and development of algorithms to measure and compensate for the effects of higher frequency attenuation in seismic data have been an ongoing effort for several decades.
The main objective of this exercise is to study the comparative performance of different techniques on a single dataset that can be used for stratigraphic interpretation.
It was expected that this exercise would help carry out data interpretation, so that we are able to (1) delineate porosity pods within carbonate layers (2) delineate transgressional shale providing top-seal for entrapment (3) image clear fault geometry, including minor faults (4) define bed terminations which can be useful for wedge out prospects.
The study area is from west coast of India with wide spread carbonate sedimentation from the Mid Miocene age and thick clastic sediments from post Miocene period.
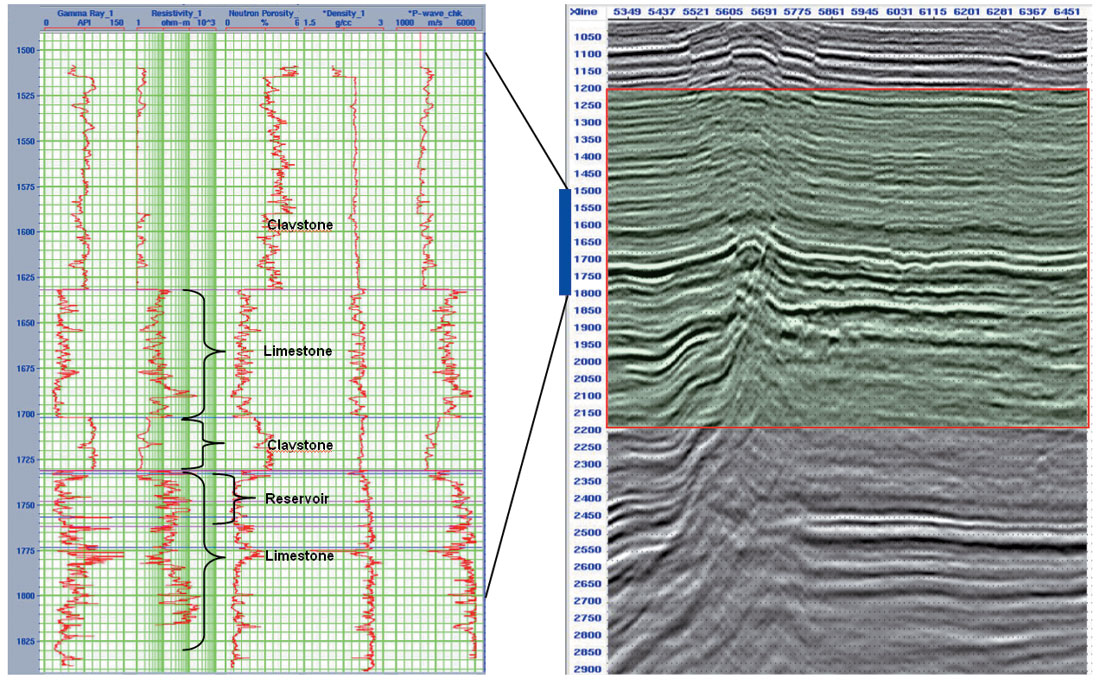
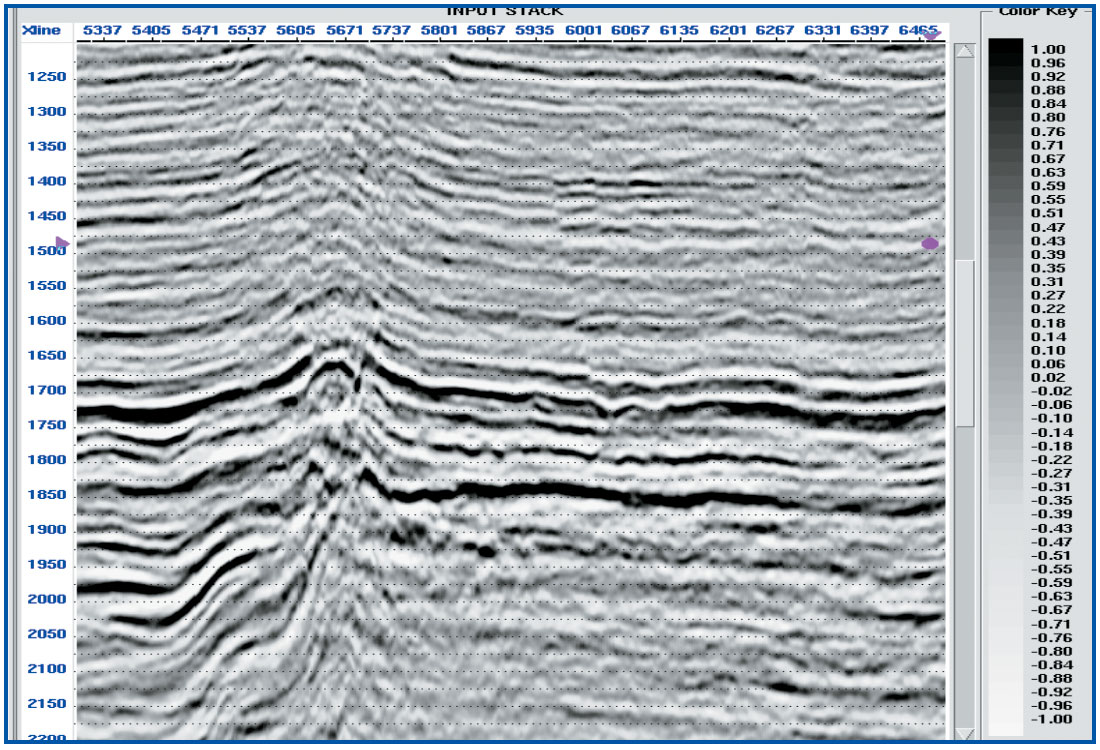
Figure 1 shows a stacked seismic time section of a line along with the well logs. Different lithological formations are very well separated in logs but it is difficult to map each individual unit, in seismic. Specially to mark the reservoir unit and top seal claystone, requires better vertical resolution. Selected area in the rectangle, 1200-2200ms (as shown in Figure 2) is used for the different enhancement procedures and the results are compared along with their spectrums.
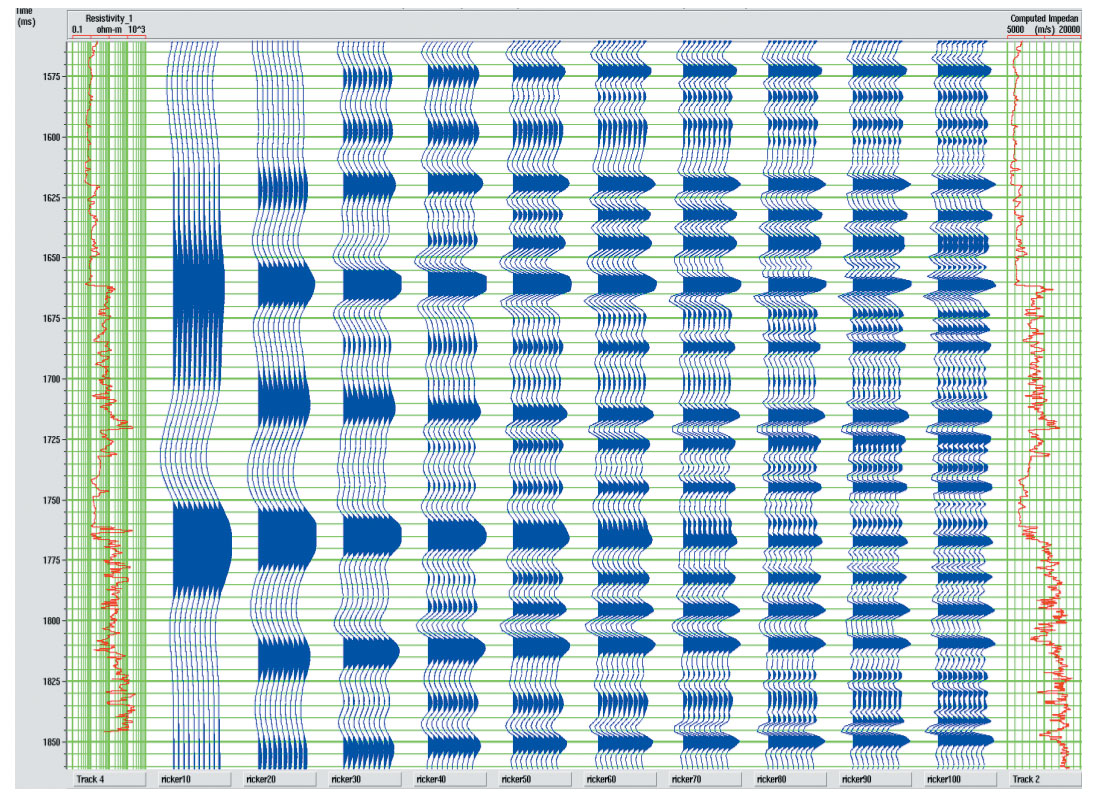
The current input data has a dominant frequency of 30 Hz. To identify up to which extent we have to increase the frequency content, zero offsets synthetics have been generated using different ricker wavelets from 10 to 100 Hz and compared in Figure 3. As evident, the events which are seen in 100Hz can also be seen in 60-70 Hz, upto a large extent, so we don’t really have to go for 100Hz bandwidth enhancement in this data. Even if we could increase the dominant frequency from 30Hz to around 60Hz, it would be a good value addition.
Conventional Methods
Spiking Deconvolution:
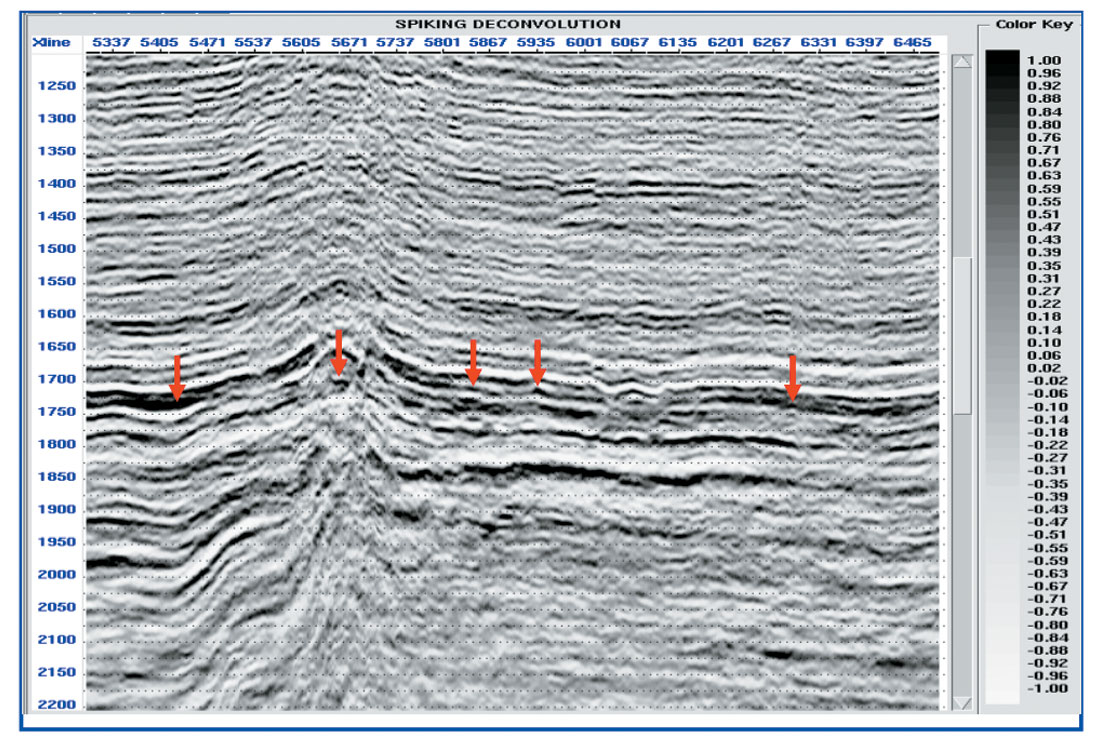
A conventional way of improving the resolution of seismic data is spiking deconvolution (Yilmaz, 1987) which designs an inverse filter to compress the seismic wavelet into an impulse. Figure 4 illustrates the stack section after spiking deconvolution. Now, low frequency broad events, which had impression of being doublets, have been split to become isolated continuous sharp events (as indicated with red arrows).
Q compensation:
Another commonly used method to compensate for frequency loss is the inverse Q filter. The essence of Q theory is that absorption causes a seismic pulse to broaden and decrease in amplitude in the time domain while losing spectral bandwidth in the frequency domain. An inverse Q-filtering procedure attempts to remove the Q-effect to produce high-resolution seismic data. There are many ways to estimate Q, of which the most popular is spectral ratio method. But due to the error in correct Q determination, often a series of constant Q values are taken and corresponding filter is designed on the basis of the theory of exponential attenuation of source spectrum with time. Here we have applied a constant Q=100 for the selected time window, 1200-2200ms. Figure 5 shows the section after Q-compensation.
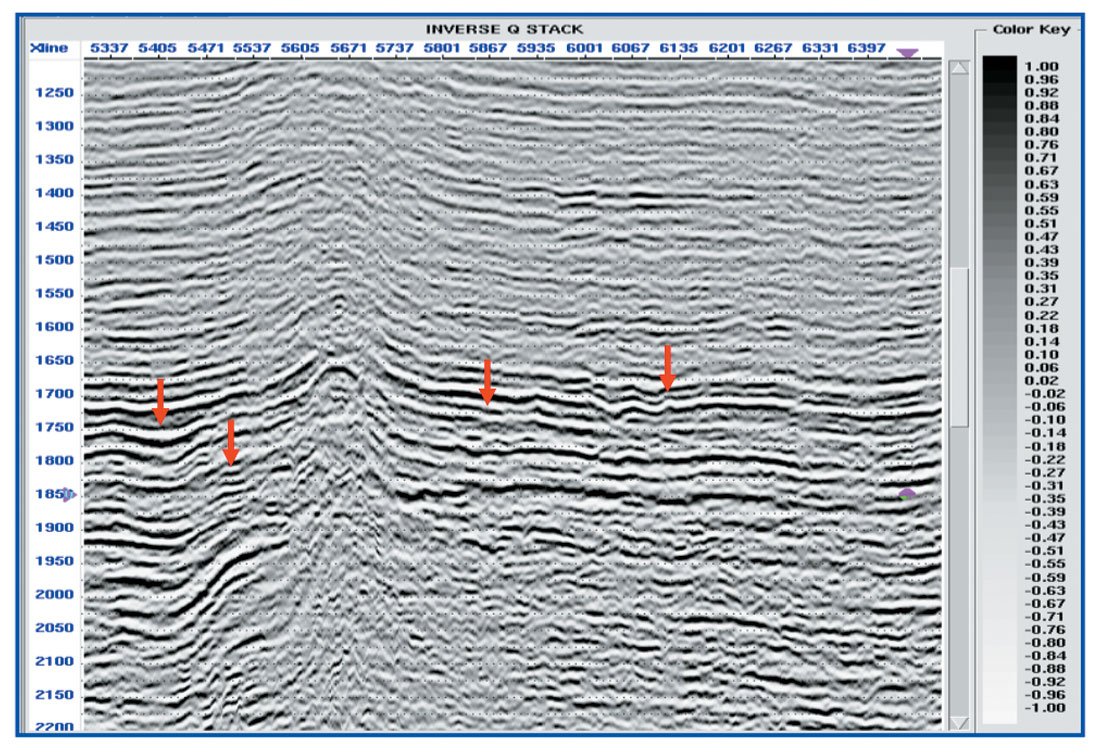
Truncations corresponding to 1850ms have come out better than spiking decon. Overall the features became sharp and crisp due to increase in higher frequencies but the random noise level is also boosted in especially in deeper part. A time-varying filter application is generally used after Q to attenuate the noise, but not applied in this section.
New Methods
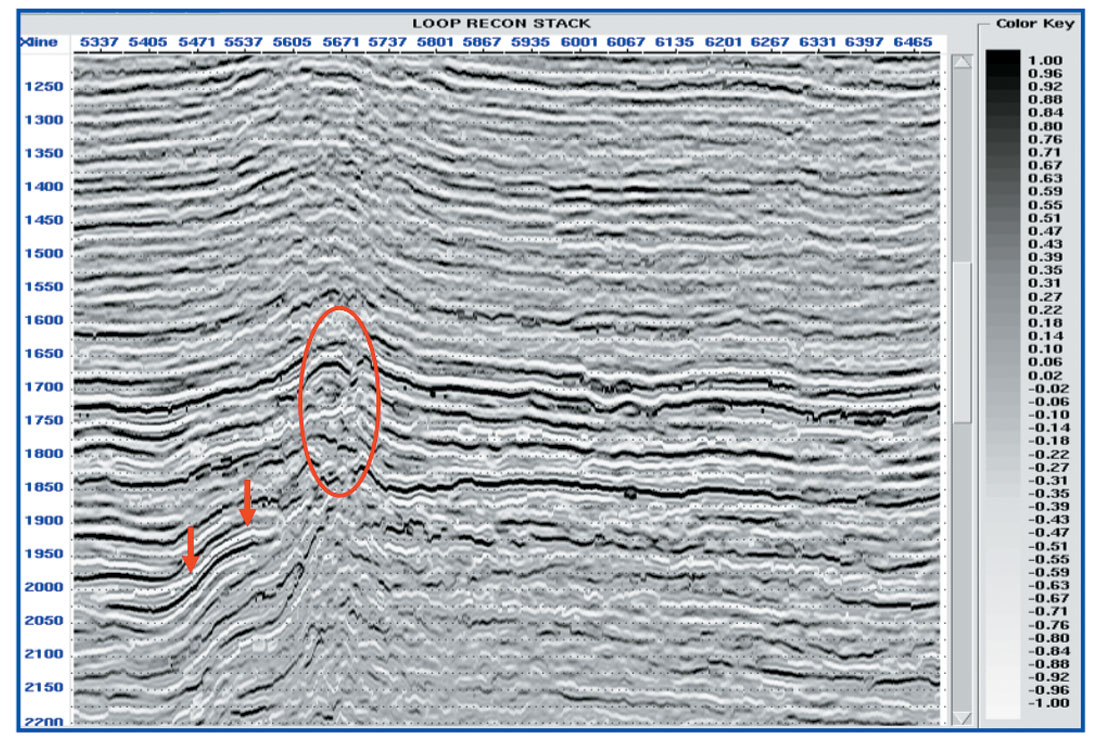
Loop Reconvolution:
An innovative method of cosmetic enhancement of seismic data has been described by Young (Young, 2005) which is based on loop reconvolution principle. This procedure generates a sparse spike reflectivity from seismic, weighted by interpolated amplitude at all maxima and minima. Then a suitable broad band wavelet can be convolved with the resulting series followed by spatial filtering for smoother appearance. Irrespective of whether this technique actually recovers any missing or hidden information from the data, it can help in interpretation because events can appear more sharply defined and less affected by low frequency, typical characteristic of conventional seismic data. Figure 6 shows the stack section after this process. The sharpness of events is best in this process in comparison to the earlier two, but it also suffers from the drawback of boosting some noise. However it has brought out better continuity of events in the fault zone.
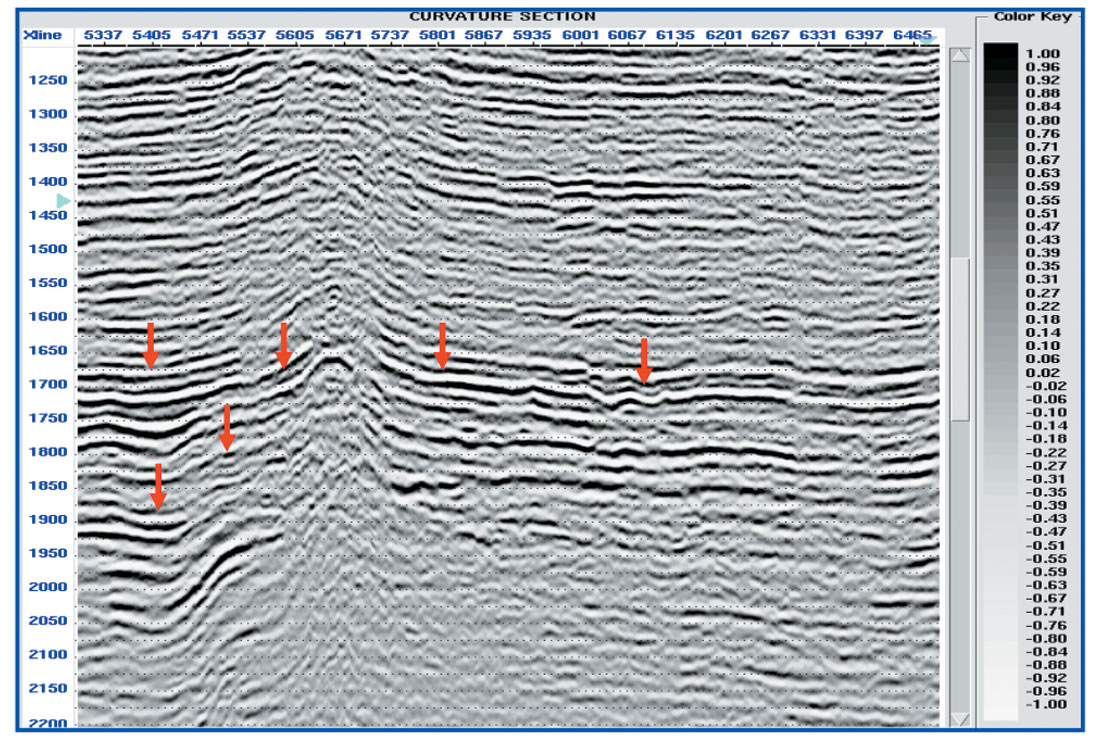
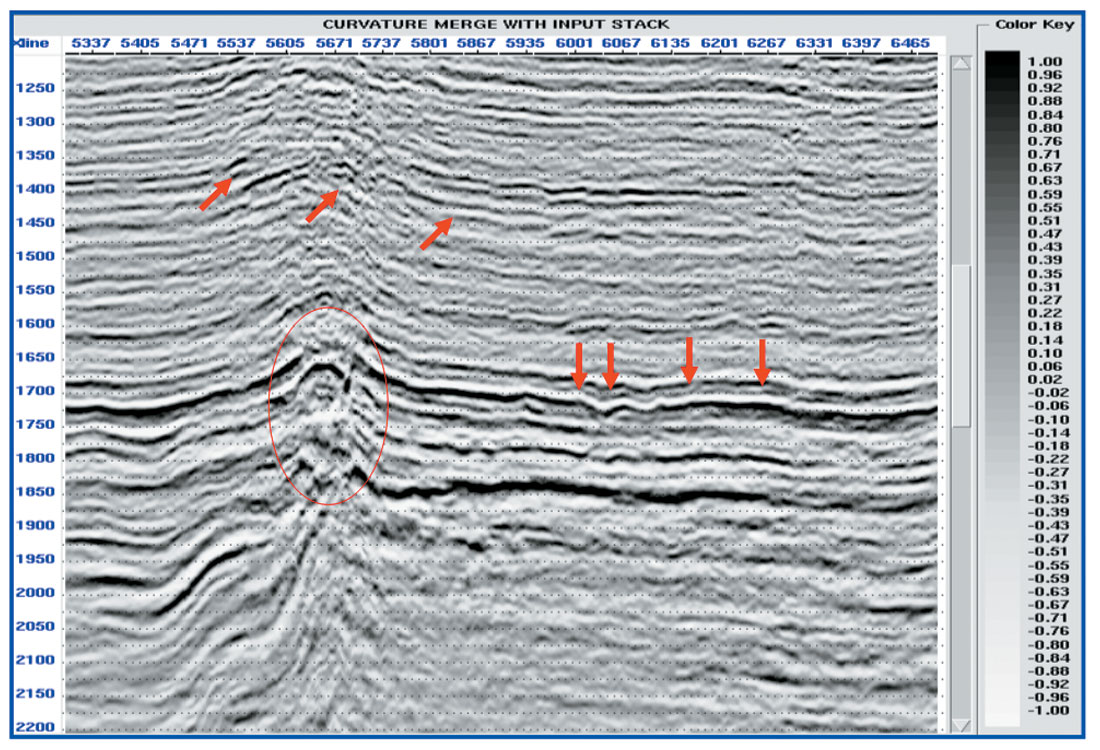
Curvature Attribute:
One of the recent advancements to enhance the small scale features in seismic is to use curvature attribute. Curvature is a measure of concavity or convexity of a surface so that sharp turns will have larger curvature. Curvature attributes along the horizon have been shown as a measure of predicting subtle faulting and fracturing which are below seismic resolution, from surface seismic data. With respect to seismic trace it can also be used to enhance peaks & troughs of seismic, if we calculate the curvature along the trace. For clarification, in this paper 2nd derivative of amplitude is taken as a measure of curvature. Figure 7 shows the corresponding curvature section generated by using this approach. As evident from the figure curvature is enhancing the higher frequency part of the seismic but lower frequencies are lost. Since we need a broadband spectrum, so a way to overcome this problem is to get lower frequency part of the spectrum from the input data and merge it with the higher frequency part of curvature section. Figure 8 shows the same section after frequency merge. The reflection events in the faults zone have been improved and also the internal geometry within the carbonate sequence is better defined.
Comparison of spectra after application of various methods:
To understand and compare the bandwidth enhancement in different methods explained above and to know the range of extra recovered frequencies, amplitude spectra have been compared. Figure 9 shows the amplitude spectrum after all these enhancement procedures along with the input spectrum.
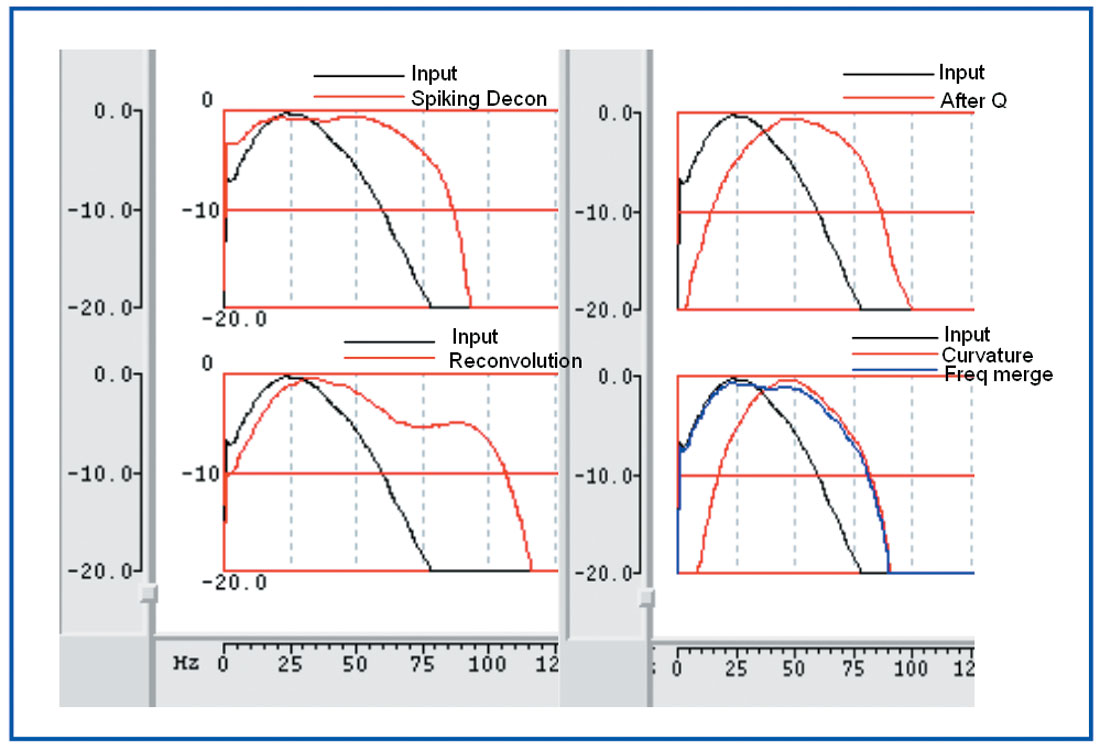
The higher frequency has been increased from 60 Hz to around 85 Hz. As is apparent, all these methods increase the bandwidth of seismic, but a question arises as to how confidently we can interpret the resolved events. Which method should be used? Whether we recover any missing information which was lost due to the attenuation of higher frequencies?
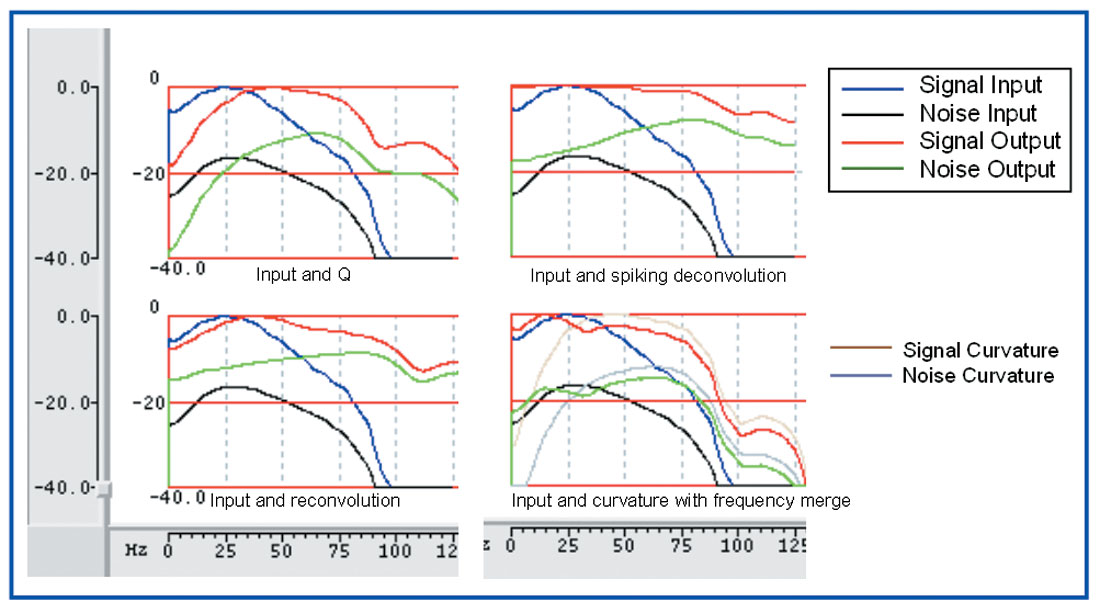
One way to check the effectiveness is to estimate the signal and noise spectrum after the enhancement. Figure 10 shows the respective signal & noise spectrums. As evident from the figure the input data had a 10db difference between the signal & noise level at higher frequencies, 80-85Hz. This difference has decreased after the spectral enhancement i.e. the noise has also been boosted. The difference is 10db, 9db, 6db & 4.5db, respectively, for curvature enhanced, inverse Q filter, spiking deconvolution and loop reconvolution. This suggests that the boosting of noise is less, in curvature enhancement procedure compared to others. This observation may be counter-intuitive, as 2nd derivative is expected to boost up the noise, but depending on the quality of the data, one can expect this.
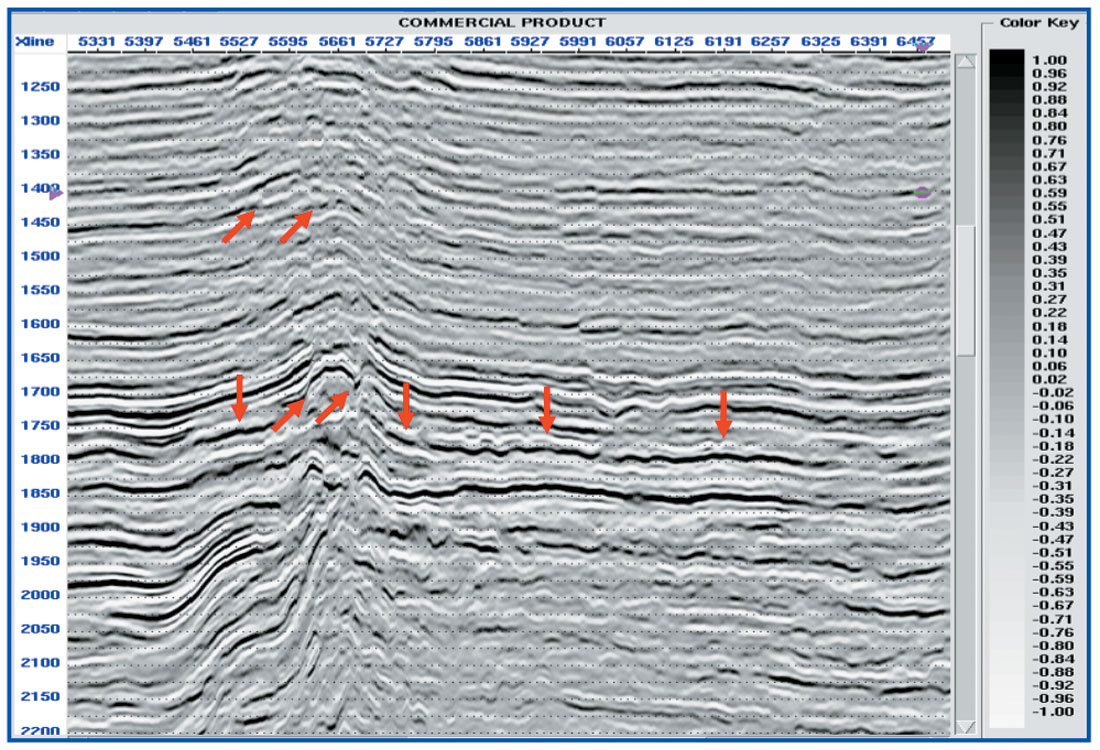
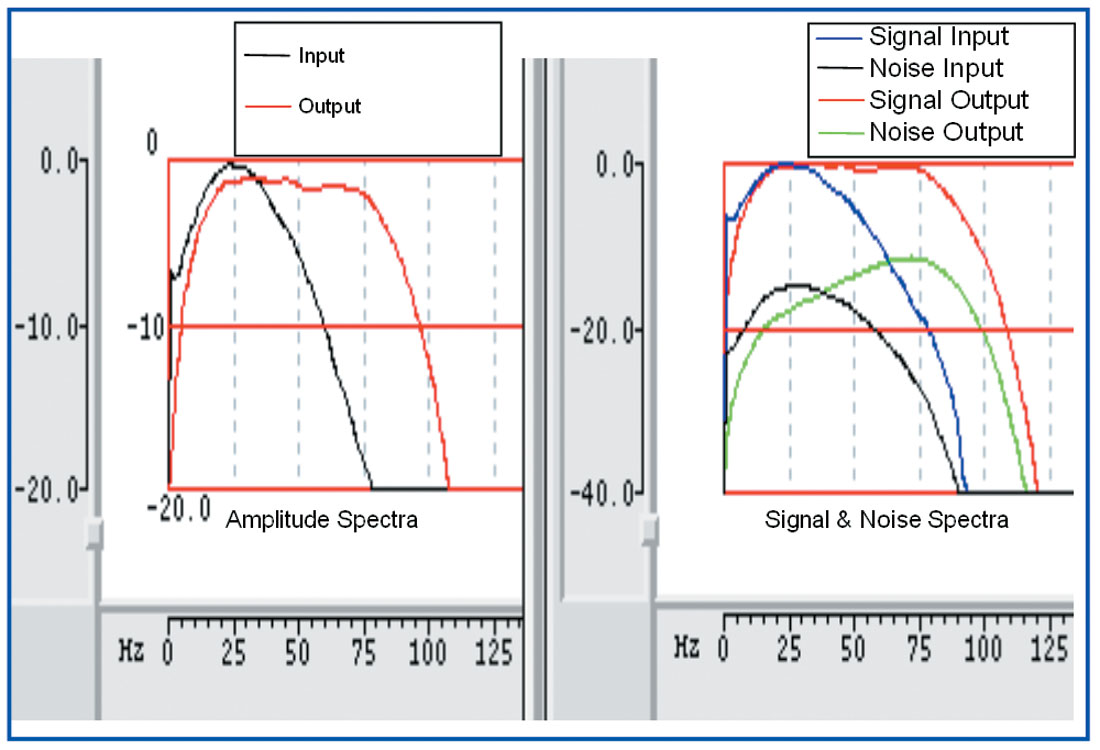
This data has also undergone a commercially available frequency enhancement method based on the principle of frequency vector rotation of seismic data towards higher frequency side. The results are shown in Figure 11 and spectra are shown in Figure 12. These results show that the faults are now more visually enhanced, horizon auto tracker is more stable and doublets have become discrete events so that subtle changes can be identified.
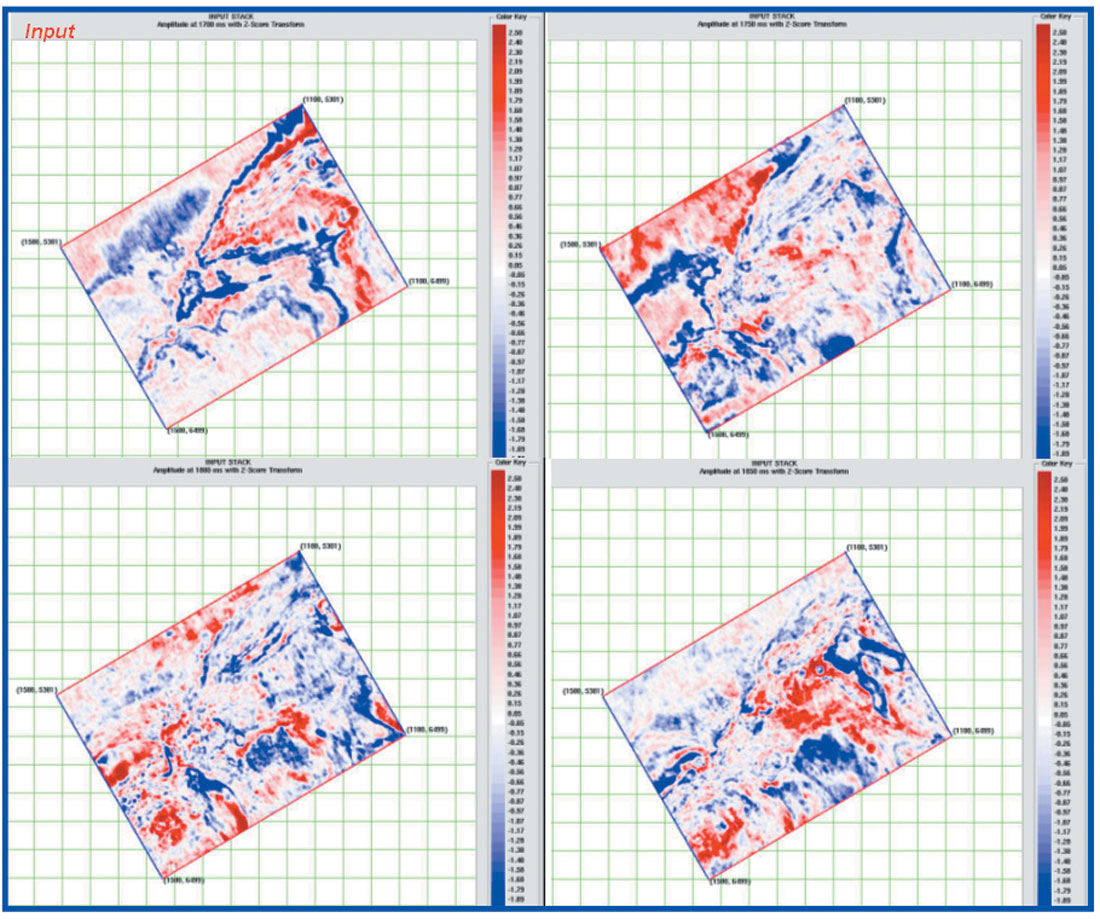
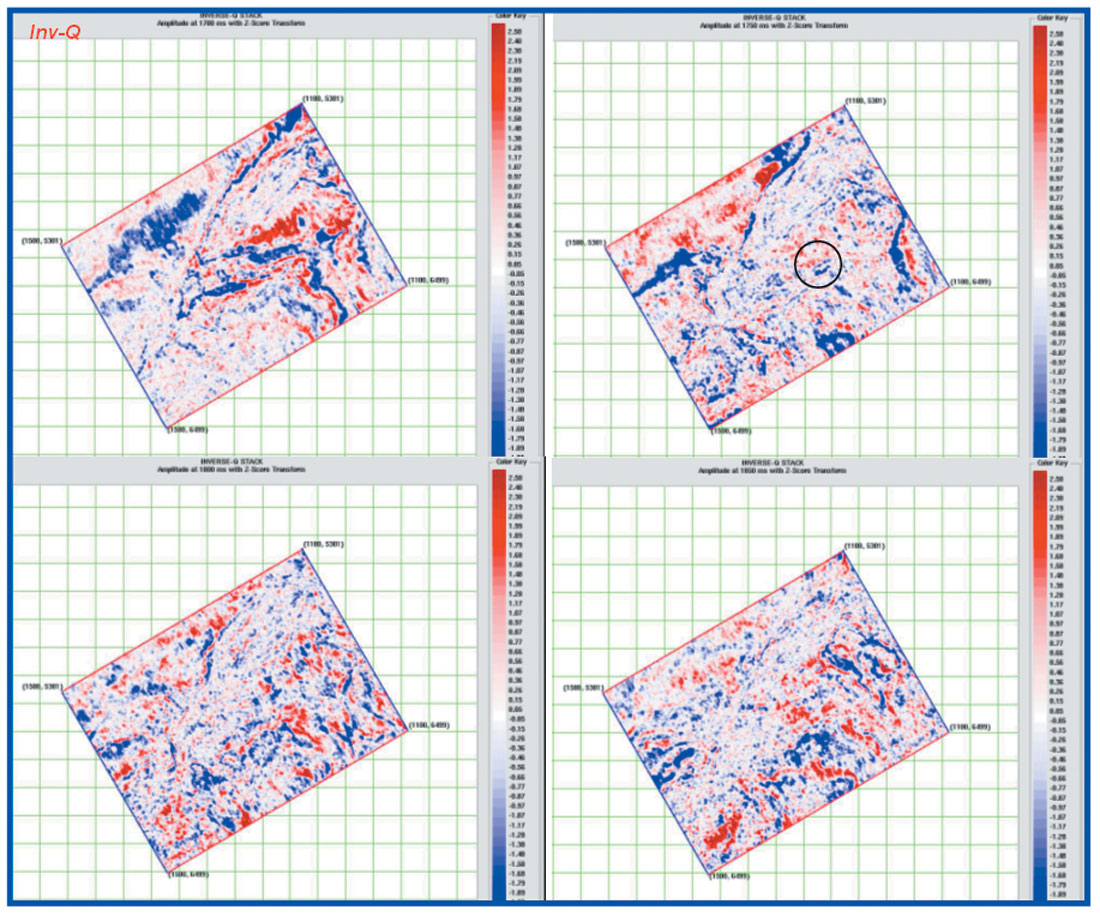
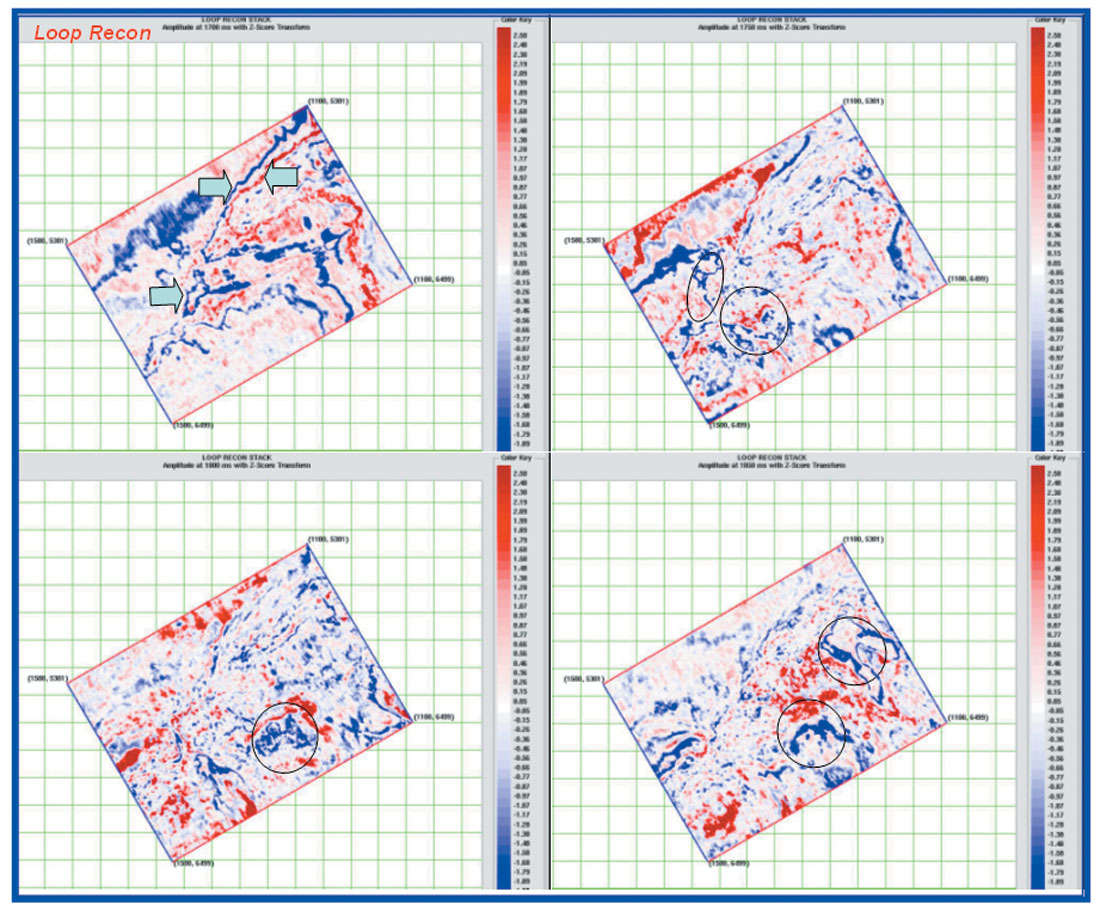
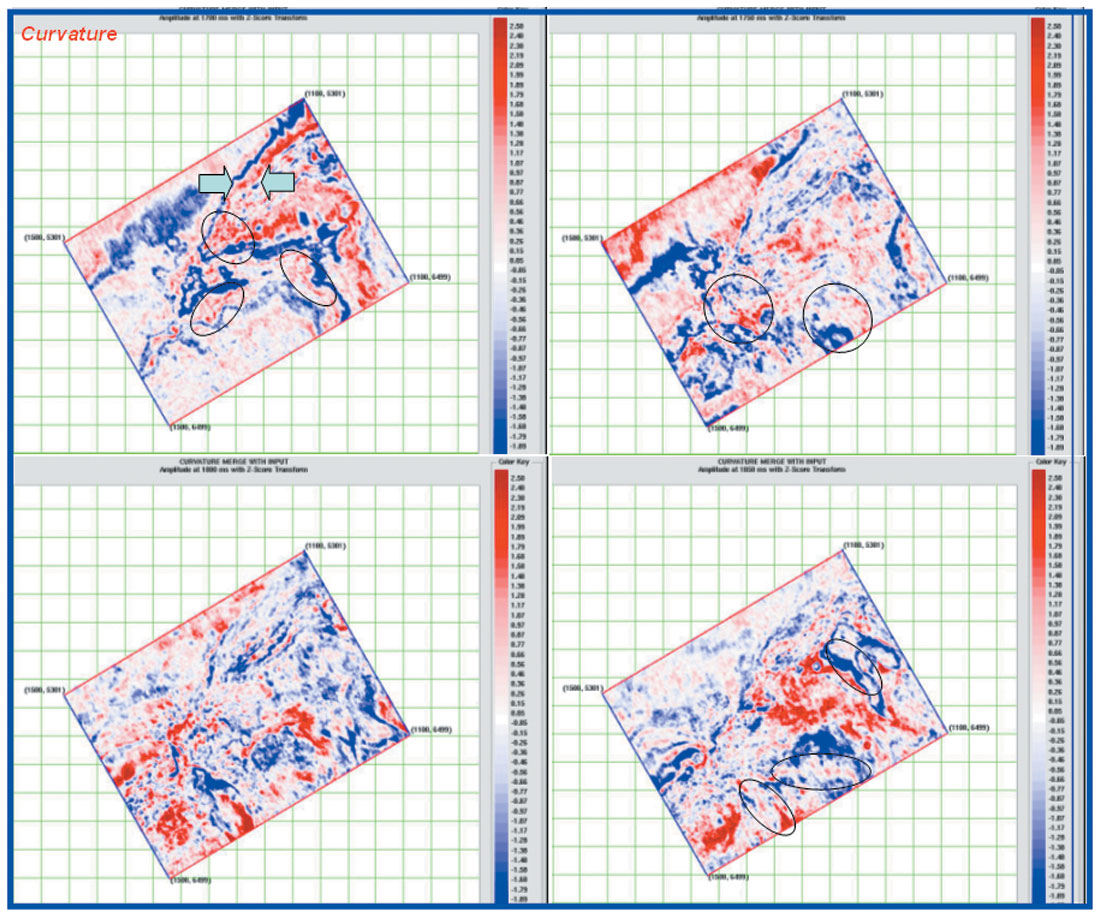
Comparison in 3D volume:
The procedure is repeated in a small 3D area ~100 sqkm to visualize the improvements in time slice. Figure 13-16 shows the amplitude extracted at 4 different times 1700ms, 1750ms, 1800ms & 1850ms for all these methods along with input. As expected, the features have become sharp and the areal extent is less uncertain to demarcate. Additionally some new subtle features have come up which were not easy to pick earlier. Leaving aside the increase in noise level, these details can be very crucial for quantitative interpretation.
Conclusions
- The results have decreased the interpretational uncertainty to some extent.
- The poor reflection zone in the seismic volume now shows greater reflection detail and continuity.
- These methods are quick and easy to implement especially the curvature method which we feel holds promise for data enhancement.
- Still, all these methods are susceptible to noise in the data, so to get a better bandwidth; input data should have a good S/N ratio.
- Also there is a limit to any bandwidth enhancement procedure and hence the method has to be conservative in approach, not to stretch it beyond the available useful information in the data.

Acknowledgements
The authors are grateful to Dr Ravi. N. Bastia, Sr. Vice President (E&P), Reliance Industries Ltd., Petroleum Business (E&P) for encouragement and permission to publish the above study. Additionally, authors thanks to Mr. Satinder Chopra, for his contributions and encouragement in writing this paper, Sh. Shankar Nayak, Sh. Shiv Malasi and M/S Geotrace for their valuable discussion.


Join the Conversation
Interested in starting, or contributing to a conversation about an article or issue of the RECORDER? Join our CSEG LinkedIn Group.
Share This Article