Introduction
Collaborative Visualization Environments (CVE’s) have been proven to be highly effective over the past 10 years, bringing decision teams together around their data to both save money and enhance results. This has been especially prevalent in the geophysical exploration and interactive drill-path planning work processes. These environments were first introduced simply as larger dual-monitors on a UNIX workstation allowing a few people to collaborate progressing to today’s very large, impressive theaters with bright stereo projection and state of the art surround sound systems holding in some cases over 100 comfortable theater style seats. Success cases documented fro m the use of these environments are many and compelling thus justifying their broad proliferation in the energy industry and the creation and growth of a number of companies who construct and provide specialty software for them.
A catalyst for the popularity of the CVE in Energy has been the rapid growth of 3D seismic volumes. Offshore data over salt or complexly folded geometries ushered in long offset surveys so that robust pre-stack depth imaging could be performed. A litany of attributes are calculated which are fed into inversion programs to extract rock and fluid property clues. Modern interpretation applications provide the capacity to calculate many of these attributes "on the fly" increasing the spectrum of data and information applied to the analysis adding clarity, resolution and fidelity to the decision. Due to this, the project models have expanded by orders of magnitude, the analysis has became multi-disciplinary and the need for a new and different type of environment to view it has evolved. Along with this, the value of the investment portfolio increases.
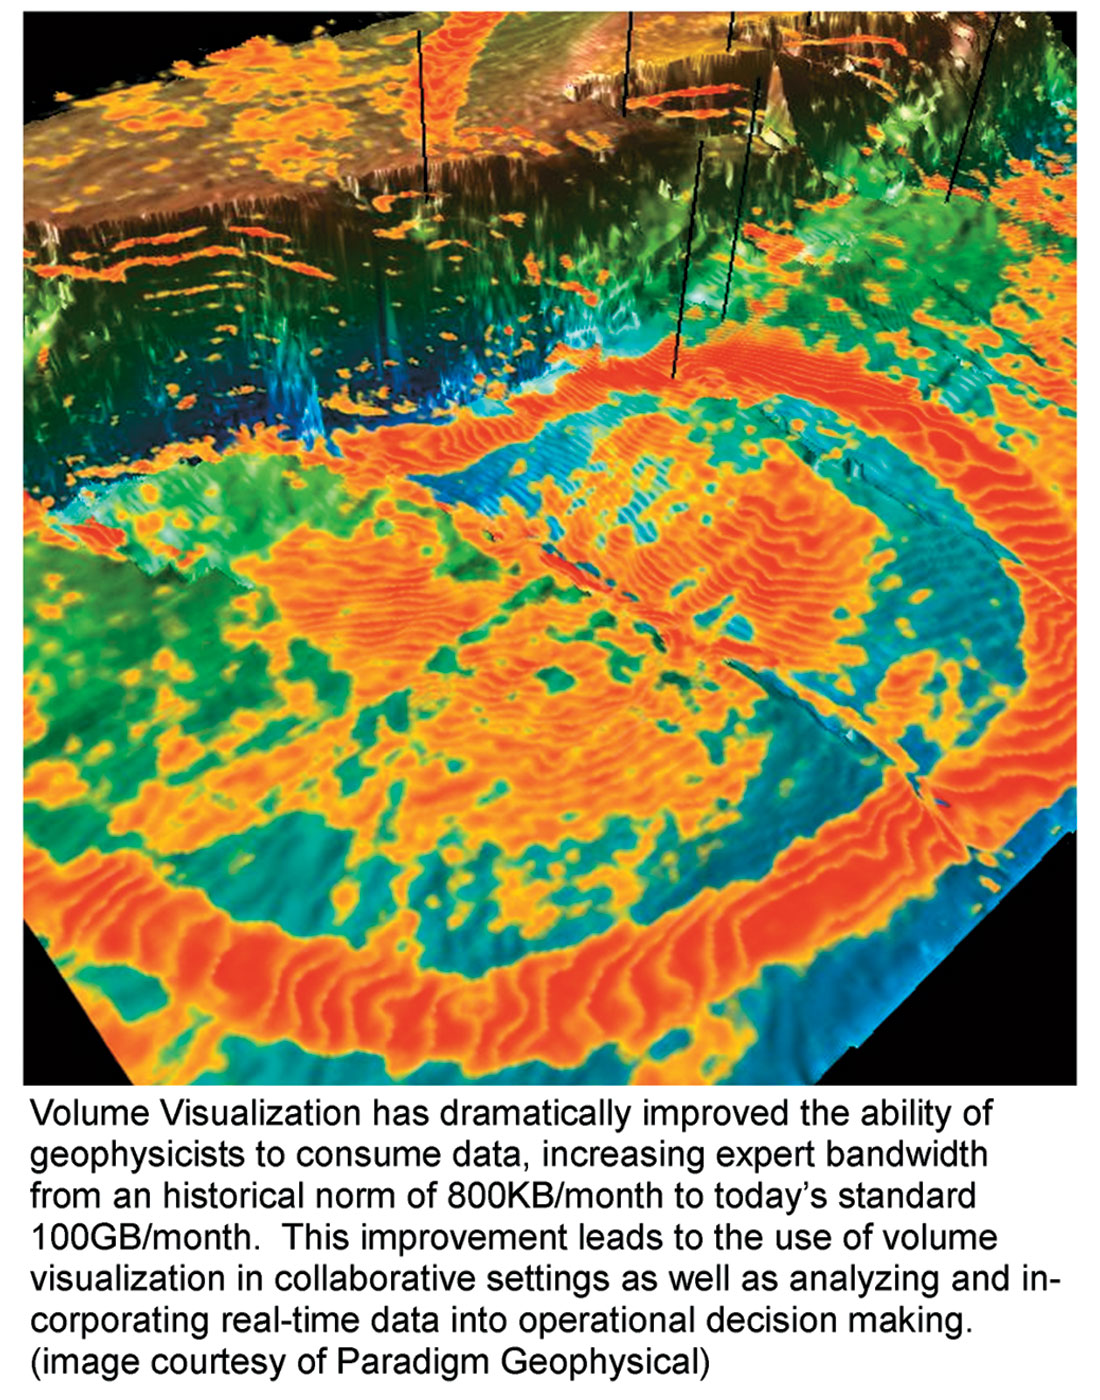
The remarkable increase in productivity enabled by the combination of powerful volume-visualization software and high performance graphics engines paves the way for extension of their use to real time data analysis sourced from distributed sensor networks. The use of volume visualization has increased the interpreter’s bandwidth 100,000 fold in 10 years. Not only does this allow massive amounts of data to be analyzed in a fraction of the time it previously took, but it brings these tools into the Real-Time-Reservoir-Monitoring (SmartField) domain because it processes data so fast in real time. New data streams enabled by the real-time aspect will monitor the changing reservoir, in some cases giving the first real views of the time variant behavior of the reservoir so that operational changes can be made as they need to be made to retain optimum operational performance.
Collaborative Visualization Environments – Business Benefits Yesterday and Today
The advent of computerized seismic interpretation in the middle 1980’s made it clear that the approach to interacting with seismic data had irreversibly changed for the better. The early adopters of this new work process paved the difficult road to make these tools user friendly enough for every day use sometimes earning deep scars in exchange for their unwavering evangelism. These early tools were clunky, had poor data import/export routines, created small views of previously wall-sized displays and the resultant "automated" maps all had to be redrawn to look geologic. But, they delivered value by increasing the interpreter’s bandwidth, accelerating interpretations and generating new prospects with better constraints in record time. This created measurable value in both the exploration portfolio and exploration success and illustrated the potential yet to be realized.
The middle 1990’s ushered in the next revolution in visualization – the interactive volume display. This dramatically increased both the amount of data that could be seen, and the rate at which it could be reviewed. Early versions did not allow interpretation, only visualization so the interpretation work remained on 2D sections which were imported into the volume displays for QC. The benefits of seeing the data and the interpretations in a volume setting were immediately obvious highlighting jumped legs and disconnected fault segments that were serious errors in the interpretation. Seeing, finding and repairing interpretation errors not evident from 2D examination both reduced the likelihood of drilling wells into low probability prospective areas and preserved play concepts that may have been abandoned had the well been drilled and found to be dry.
Around this time, high resolution projectors were becoming available and many conference rooms were becoming equipped with them. Setting up a collaborative session meant putting your workstation on a handcart and wheeling it down to the conference room where it was connected to the projector. This proved highly effective in collecting larger groups of people around the data and discussing various scenarios of what the data might imply.
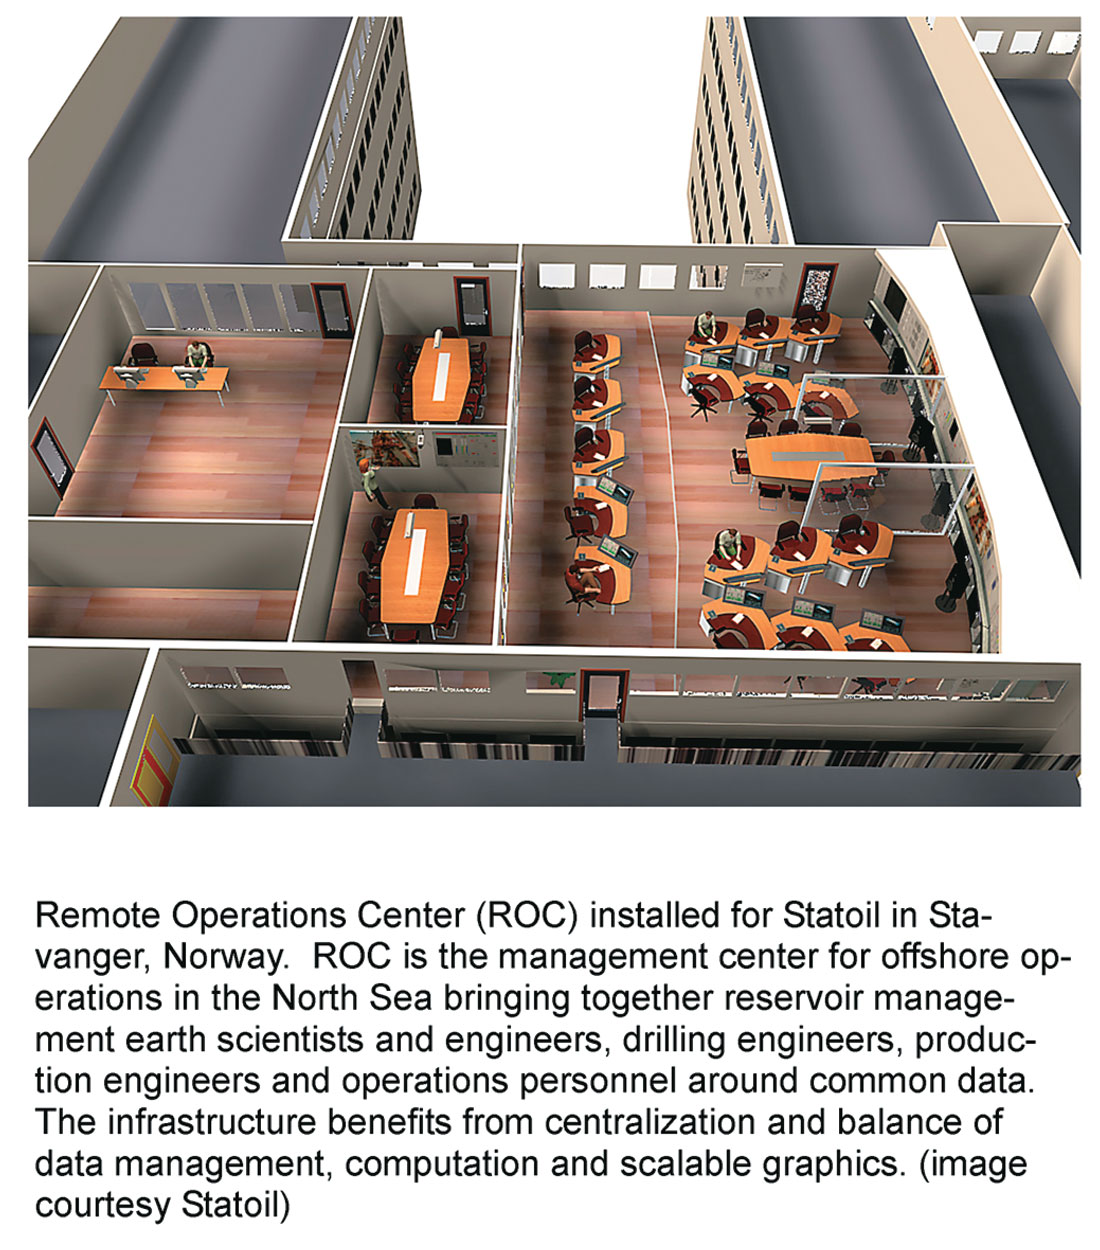
Today’s big wins are in modern visualization rooms outfitted with state of the art projection systems bright enough to have room lights on and back projected for easier interaction with the data. Today’s rooms are built either as the theaters we know so well, asset rooms to manage reservoirs and increasingly, Remote Operations Centers (ROC’s) to consolidate all the relevant information from an oilfield operation into a common space and bring the operators together with the field managers around their data to reduce cost and increase production.
The application category that has generated the most immediate and measurable value has been the interactive geosteering of drilling wells. These applications, which combine large volumes of seismic data with immersive tools to plan and monitor complex well paths have cut up to hundreds of millions of dollars off of drilling programs and added hundreds of millions of dollars of additional oil to the tank. The biggest cost savings are from two factors. First, reservoir planning in this environment has been proven to greatly reduce the number of wells necessary to recover the oil. Second, the incorporation of precision directional and formation evaluation data from measurement while drilling systems tell the earth scientists how to modify their geological model based on new drilling information. This is then sent to the drilling engineers who can recalculate the drilling plan, in real-time. By adjusting the plan while drilling, targets that would have been missed due to subtle variations in the seismic velocity model are now hit first time eliminating plug-back and redrill procedures of the past.
The increase in recoverable oil derives from the wells being more precisely placed in the reservoir. As the well is being drilled and new information is incorporated into the plan, well paths can be tuned to penetrate optimum locations, recovering maximum reserves from the well.
Major companies around the world have found that assets deliver up to $400 million more value by using these tools than if they do not.
Hardware and Software Infrastructure
The hardware and software information technology core to deliver these extended capabilities is mostly available and proven, such as are showcased in the large install base of Reality Centers and the growing number of Remote Operations Centers.
The hardware for the new trend, Remote Operations Centers has at its core powerful visualization servers that handle the large, volumetric data and interactive applications for seismic interpretation, earth modeling and interactive well planning and geosteering. But the visualization hardware and the applications only display pictures. The pictures are derived from modern computational servers connected via high-speed dedicated networks – Storage Area Networks – using shared file systems so that files are not replicated or transferred across the networks for analysis or visualization. This balanced system provides rapid and ready access of the data displayed either in large format screens or on the desktop.
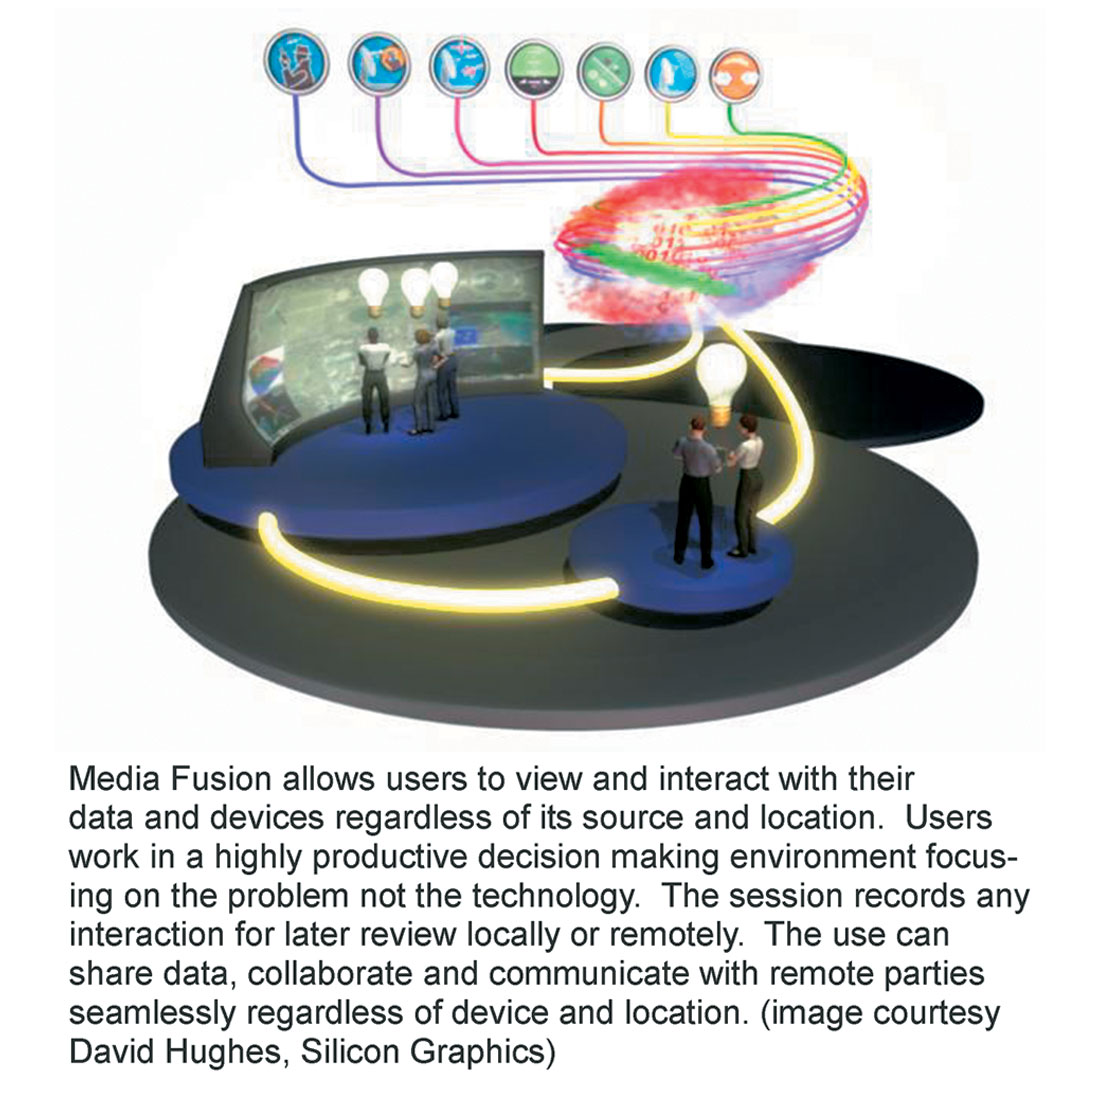
Exciting new concepts and approaches to supporting Remote Operations Centers are under development or are being integrated. Principal among them are innovative ways of fusing media in a collaborative format, bringing data from multiple sources into single, common views. This updates the approach where individual monitors or screens house windows dedicated to applications. The Media Fusion approach brings multiple data sources together into a single windowed view where the teams can assess, interact with, evaluate and make decisions.
New approaches to monitoring both subsurface and surface operations will generate new streams of data that mandate real-time assimilation into distributed decision models via graphical presentation to distributed teams. Examples of this are self-organization networks that link widely but densely distributed sensors forming a mesh network of monitors in the field, 4D seismic and new methods for passive (always-on) seismic.
Application and middleware fusion software will drive the decision environments linking operations teams with reservoir management and modeling teams. Scalable, extensible, reconfigurable, secure, distributed and system-balanced storage, computing and visual serving systems will be the infrastructure upon which existing and new powerful software will drive this new business process. This business process will be the catalyst to dramatically reducing operating costs while simultaneously increasing production, extending the economic life of the fields and increasing ultimate recovery from the reservoirs.
New Data Sources, New Transmission Backbones
A virtual onslaught of sensors such as fiber optic arrays, wireless-battery-powered-sensors in self-organizing networks, 4D seismic and passive seismic will challenge the capacity of all aspects of the infrastructure, but the business benefits that they will deliver will justify investments in maturing and deploying these technologies and the infrastructure. Broad-band wireless infrastructure on the horizon and the current capacity for self organizing mesh networks will facilitate the deployment of much of this equipment into operations where running copper or fiber cable is prohibitively expensive. As these technologies mature, they will create economically viable deployments of the infrastructure in areas never before possible and even replace aging wired infrastructure as a more economic solution.
A few forward looking researchers are envisioning and building the designs to deploy IPv6, which when coupled with broad-based, wireless, self-organizing nano-sensors will deliver real time information from virtually every square meter of the earth's surface, subsurface, air and space. GPS aware systems will communicate with data management environments to query both static and time-variant data associated with locations or regions. Queries will be analyzed by high-performance computers, the results transferred to visualization servers for transmission to decision makers or operators. The fecundity of this system will be dependent upon the performance of the information technology infrastructure, which will be defined by the smallest bottleneck. IT departments will need to assess where these bottlenecks are, what their cost is to the business and what the cost is to eliminate them thus providing a measurable ROI for the solution.
Challenges – Not All Technical
It is clear that many aspects of the sensor-network enabled oilfield are not mature and the eventual total solution may not be something we can clearly see in total today. It is certain that as these technologies develop we will be faced with unforeseen technical challenges that appear to threaten the viability of the approach. Identifying these roadblocks and mitigating them early will be a great but necessary challenge to meet.
Solutions are never broad-brush. They must apply to specific real world problems with measurable and predictable results. But every intervention into established routines carries risk and that risk must be assessed and managed relative to the value it might create. The typical risk evaluation focuses on technical risk which sometimes can be significant. But more often than not, the major risk is not the technology but rather its successful deployment, including and especially the transformation of the work process and company culture to take the greatest advantage of it. Smart people have tackled difficult technical problems time and again in the energy industry delivering extraordinary value. Moving these breakthroughs from prototype to standard operating procedure however can take decades, even after the technology is well demonstrated to create significant value.
Especially in operational settings, companies do not want serial number 1 of any product. And in today’s oil business, research and development has been largely outsourced to software, hardware and service vendors. Commercialization of new technologies must occur for future research to be conducted by the service industry, thus robust demonstrations of value to the industry must be conducted as early as possible to a willing audience. Early adoption will be mandatory for the operating companies to ride an earnings growth curve fueled by innovation. Discovering appropriate and affordable ways to demonstrate both value and potential in the early phases of commercialization will be a shared challenge of the providers and consumers of new approaches.
Tomorrow and Beyond
The oil reservoir remains vastly data underconstrained even after a century and a quarter of drilling, mapping and collecting and analyzing data. Seismic provides high spatial resolution compared to wells, while wells provide high vertical resolution compared with seismic. The combination is a sparsely sampled subsurface world, yet we make in some cases, multi-billion dollar decisions from this. Manufacturing process improvement conclusively illustrates that measuring the process improves its efficiency.
Even realizing the tsunami of new data on the horizon, the fields will remain underconstrained but this new information can and will create tangible and measurable business benefits if managed, processed and delivered to the decision makers in a fast, secure, robust and collaborative manner. How do we add high-density/high-resolution constraints to the subsurface? How do we measure the behavior of the reservoir in detail to modify it to meet business models? How do we manage the enormity of the data in a distributed work process that will come from successfully answering these first two questions?
Tomorrow’s information technology will deliver this, and deliver it transparently to the user. It must. Else it will not be used.


Join the Conversation
Interested in starting, or contributing to a conversation about an article or issue of the RECORDER? Join our CSEG LinkedIn Group.
Share This Article