As the new millennium dawns, it is natural to focus on the future and what it holds for exploration geophysics. In the second of a two-part series, The Recorder looks at some exciting new research in the interpretation sector that will have an impact on the profession a decade down the road.
3D Visualization and Immersive Technology
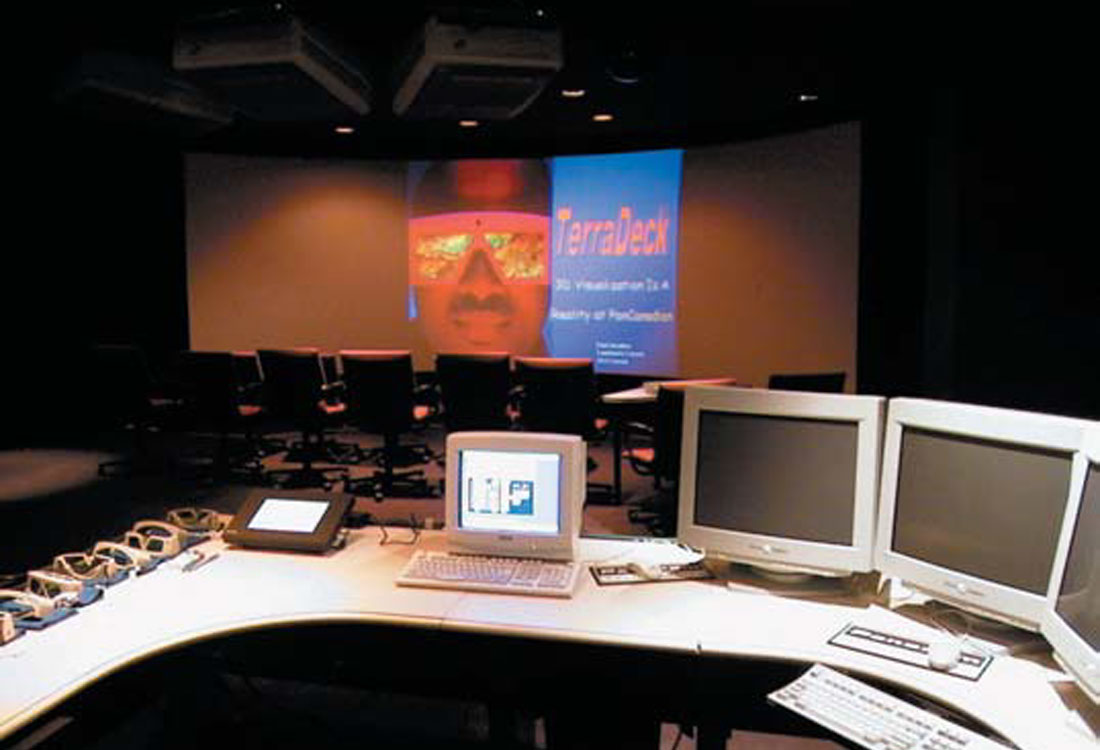
PanCanadian Limited recently unveiled Calgary’s first major 3D immersive environment. Installed in a 10 X 12 metre room painted completely black, the huge, 20-square-metre, semi-circular screen fills an entire wall from floor to ceiling, allowing up to 30 people to explore for oil and gas in stereoscopic splendor. “We call it our TerraDeck,” says Dick Walker, project manager. “It lets your mind go places you couldn’t have imagined before.”
Over the last decade, there has been an exponential growth in the size and popularity of 3D surveys, inundating the geoscientist with immense volumes of data.
This growth has led to the development of volume visualization, in which the seismic trace is sampled and converted into a voxel volume.
Depending on the user’s needs, the seismic trace conversion to a voxel volume can be defined for reflectivity, acoustic impedance and AVO attributes, and viewed within the same 3D space. “When combined with log data, it allows you to begin to understand the depositional system,” says Murray Christie, manager of Paradigm Geophysical’s Canadian operations. “You can see how a channel was formed, for instance. You can display data based on the rate of change; this allows you to clearly visualize lithological edges.”
Faults, fluids and layers also show up clearly in the data. “You can start to map out the internal architecture of the reservoir,” says Christie. “It is so detailed that engineers can do a well-path plan to exploit the sweet spots.”
Once the data has been interpreted, it can be displayed in a sophisticated, immersive environment in which geologists, geophysicists, engineers and management can all participate.
Landmark, with their Decisionarium system, is a pioneer in the field of 3D imaging and assisted PanCanadian with their TerraDeck visualization environment. “Management truly appreciates the value of these systems as they can really see what geoscientists are talking about,” says Nick Purday, product manager, volume interpretation, for Landmark. “Another advantage is getting the asset team into a single room, displaying all their data in the same 3D space, and then collaborating on an interpretation. Often, it is not until all the team members work in this type of environment that they understand the complex data relationships.”
Over the next decade, Purday predicts that immersive technology will expand to handle pre-stack and multi-component seismic data. “We are only just beginning to see the start of our data challenges; over the next few years many surveys will be recorded that encompass both compression and shear data. Even for normal seismic data, interpreters are asking for near and far offset stacks to help understand AVO effects. It is critical that future volume interpretation solutions allow interpreters to interact with all the data.”
Purday also foresees risk visualization as one of the next big steps in immersive technology. “You can’t eliminate risk, but you can quantify it. You have fixed points of wells, but you have a minimum and maximum risk (continuum) between these fixed points. We are working on ways to visualize risk dynamically by animating through different scenarios.”
For explorationists, the potent combination of 3D visualization and immersive technology heralds a whole new decade of opportunity. “Fifteen years ago, companies starting using 3D seismic as a tool, and there was a tremendous increase in field reserves and drilling success rates,” says Walker. “I believe this is the next threshold, and we’ll see another quantum change. I have no doubt in my mind that it will save lots of money, especially in offshore wells, where it will significantly reduce risk.”
4D
“4D (usually) refers to time-lapse, 3D seismic monitoring,” explains Keith Hirsche, a senior research geoscientist at Hampson Russell Software Services. “However, the name is misleading because the same technique can be applied to well-logs, VSPs, 2D, 3D or 3-component data.”
Hirsche has been involved in reservoir geophysics research for more than 15 years, and he has studied the growing use of 4D geophysics.
Currently, most companies use 4D seismic to explore in mature fields. Using pre-production legacy 3D data as a control, oil producers re-shoot seismic over a field in order to search for production-related changes in the data. “In its simplest form, when a field is discovered using bright spot techniques, you are looking for the remaining bright spots that might indicate bypassed oil,” says Hirsche.
While there is significant growth in the use of legacy and exploration related 4D, custom-designed seismic monitoring projects predominate the field. “These custom projects are designed (from the ground up) with 4D in mind, so they are highly repeatable,” says Hirsche. “I did an industry survey (in early 1999), and found that 60% of all current projects are done with time lapse in mind. These projects are tightly focused on the production process.”
Although time-lapse seismic monitoring is designed to illuminate production-induced changes in the reservoir, other factors can cause the seismic response to alter.
“Time-lapse differences in the seismic data fall into three major groups,” says Hirsche. “The first group are artificial differences, which are caused by such things as changes in acquisition geometry, processing sequences, and migration velocity.”
A second category is referred to as non-critical, real differences. “You can get real differences that have no relation to the production-induced changes that you are looking for,” says Hirsche. “Water temperature, tidal fluctuations, permafrost and shallow gas production can all have an effect.”
The third category is caused by production-related changes in the reservoir. “These are the differences that are caused by changes in fluid saturation and pressure in the reservoir. This is what you are interested in.”
A significant amount of 4D research is focused on eliminating changes caused by the first two categories, but a great deal of experimental work involves interpretation. “When you do see a production-related difference in the seismic, it’s simply a blob,” says Hirsche. “What does it mean? The same seismic response can be caused by a number of production scenarios.”
According to Hirsche, integrating geological, petrophysical, and geophysical information is critical. A consortium of oil companies have sponsored a project at Hampson-Russell to integrate 4D analysis software. “By bringing all the tools together, you can streamline the process and remove spurious effects,” says Hirsche. “You can then take your analysis of the production-related difference and check against the engineering data to see if they balance.”
While the current use of 4D is mainly reactive, Hirsche foresees the technique being employed to plan more efficient recovery. “We’ll proactively tie the information into reservoir simulators to design better production programs. This will be especially important in deep-water targets, where a field is produced with a small number of wells. In order to achieve optimum recovery, you’ll be able to put best production practices up front.”
Anisotropy
Arnim Haase is a senior researcher at GeoX with over 20 years experience in the oil and gas industry. “When it comes to exploration, we always make assumptions,” he notes. “They serve us well for a while, under certain conditions.”
One of those assumptions in geophysics is isotropy, or the uniformity of velocity of the seismic wave through a rock layer. “From the rock physics point of view, when you look at a single rock crystal, there are differences in velocity along the axes,” says Haase. “But, we make the assumption of isotropy based on the fact that that there are zillions of crystals deposited in a random fashion.”
Unfortunately, not all rock types conform to random deposition. “Shale is little platelets that lie flat – they don’t randomly stand on end. It’s all part of the physics of deposition. Isotropy is not true for shale.”
Twenty-five years ago, when 12 offsets was the norm, anisotropy wasn’t an issue. As the number of channels recorded grew, however, problems arose. “People noticed a difference to normal move out and AVO responses,” says Haase. “NMO curves should be flat, but they started to look like hockey sticks.”
The culprit was hiding in the assumption of isotropy. “NMO is based on the Dix approximation, which assumes hyperbolic move out,” says Haase. “But with anisotropy, this assumption won’t flatten the curve.”
Geoscientists began to catalogue various sources of anisotropy. VTI is vertical axis, transversal isotropy, and is common in shales. TTI is tilted axis, transversely isotropic, related to dipping beds. HTI, or horizontal symmetry axis, transversely isotropic, is often created by fracture planes. “There are half a dozen major causes,” says Haase. “Sometimes there are symmetries, other times it is very complicated and ugly.”
The western Canada basin is laden with shales, creating an anisotropic headache for geoscientists. Haase took a 2D seismic section from the western Canada basin and specifically focused on VTI. “We corrected for anisotropy and opened up the mutes to include more traces, and we saw dramatic changes in layering when compared to the standard Dix approximation. It can give you better noise reduction, eliminate multiples better, and improve the resolution of high frequency data.”
Over the next decade, Haase predicts that cataloguing of the various forms and regional locations of anisotropy will continue. “The hope is to reduce uncertainty.”
In addition, Haase foresees that anisotropy will become a powerful tool for reservoir planning. “It’s impossible to drain 100% of the oil from a reservoir, but we can improve on what we do now. We can use anisotropy as a tool to better understand fracture patterns, and this could lead to improved recovery rates.”
And for a seasoned geoscientist like Haase, making lemonade from lemons is a satisfying experience. “That’s what makes it fun getting up in the morning; you never know what awaits. As the saying goes; Opportunity knocks softly – be vigilant.”
Neural Networks
Neural network software mimics the multi-path, interactive nature of the brain to process information on the basis of probabilities, rather than the yes/no, binary-type computing. The process, also known as artificial intelligence (AI), is used in both processing and interpretation.
While processing applications, such as picking first breaks, have met with limited success, AI is making appreciable inroads into the interpretation field.
“I use AI to predict reservoir parameters such as rock type, porosity, fluid saturation and phase,” says John Logel, a senior geophysical adviser at Mobil. “It’s great for low-control areas; I’ve used it in areas that are hundreds of miles from well control, and over Hibernia.”
When building a neural network analysis, Logel’s first task is to supply examples of seismic targets in order to ‘teach’ the program what they ‘look’ like. “You load in lots of historical data,” he says.
The neural network then computes a series of attributes using a complex series of algorithms, and then tries to apply what it has ‘learned’ by making its own picks. “It takes tens of seismic trace attributes, such as instantaneous phase and derivatives and AVO attributes, and coalesces them,” says Logel. “The process takes relatively unrelated, known observations and puts them together to predict unknown information.”
While the technique has long had a reputation for falling short of expectations, Logel predicts that is about to change. “AI has become a lot more mainstream and will become more accepted. Instead of using simple models of reservoir and porosity, we will use – and have confidence in – much more sophisticated models.”
Over the next decade, an exponential rise in processing power will allow AI to expand its boundaries. “Right now, we’re limited by how many attributes it can compute in a reasonable time,” says Logel. “As computing power grows, it will allow us to scenario- test better.”
And Beyond....
While most of the recent excitement has been focused on 3D immersive environments, other explorationists are already thinking beyond the visual realm into the senses of touch, sound and smell.
“One of the most important senses is touch,” says Mark Sun, president of Genetek, creator of the EarthWorks Exploration System. “Some day, we’ll be able to use a tactile glove to reach into a data set and ‘squeeze’ an event. It could be hard, or soft, or bumpy or smooth. The importance is, you’d be able to tell the quality of the reservoir just as easily as you can tell if a melon is ripe by squeezing it.”
The sense of smell could also be used in exploration. Several retail firms are already experimenting with odor-emitters in conjunction with on-line grocery shopping; adapting the hardware to seismic interpretation would be relatively simple. “We all know what oil smells like,” says Sun. “What you’d have to worry about, of course, is sour gas.”


Join the Conversation
Interested in starting, or contributing to a conversation about an article or issue of the RECORDER? Join our CSEG LinkedIn Group.
Share This Article