Summary
The method of time-frequency adaptive noise suppression, or T-FANS, is designed to isolate and attenuate localized high-amplitude noise in seismic data. By “localized” we mean not only that the noise has a limited range in the space and time domain but also in the frequency domain. Strong ground roll energy is the most common noise of this type. A great number of applications to seismic data from different areas have shown that T-FANS is very effective at attacking such localized noise. T-FANS also preserves reflection signal amplitudes well. This makes T-FANS more appealing in terms of producing prestack gathers for amplitude sensitive data analyses, such as AVO inversion and analysis.
Introduction
Strong coherent noise, such as ground roll, has always been a factor that degrades the quality of seismic data processing. Numerous methods have been developed to remove or suppress such noise during data acquisition and data processing. However, its effects are still regularly seen in seismic processing products.
Bandpass filters are routinely used to attenuate ground roll noise. They are effective because much of the ground roll energy resides in a low frequency range where little useful signal can be extracted. Figure 1a is a typical shot record after a full sequence of prestack processing including true amplitude recovery, surface-consistent deconvolution, static corrections, normal moveout correction, muting and surface-consistent scaling, but with no attempt to attenuate ground roll noise. Figure 1b is the result of a bandpass filter on the record shown in Figure 1a. The bandpass filter was chosen such that it would not eliminate any extractable useful signal. It is evident that the ground roll energy is largely reduced. However, it is still very prominent at near offsets, and further attenuation is needed.
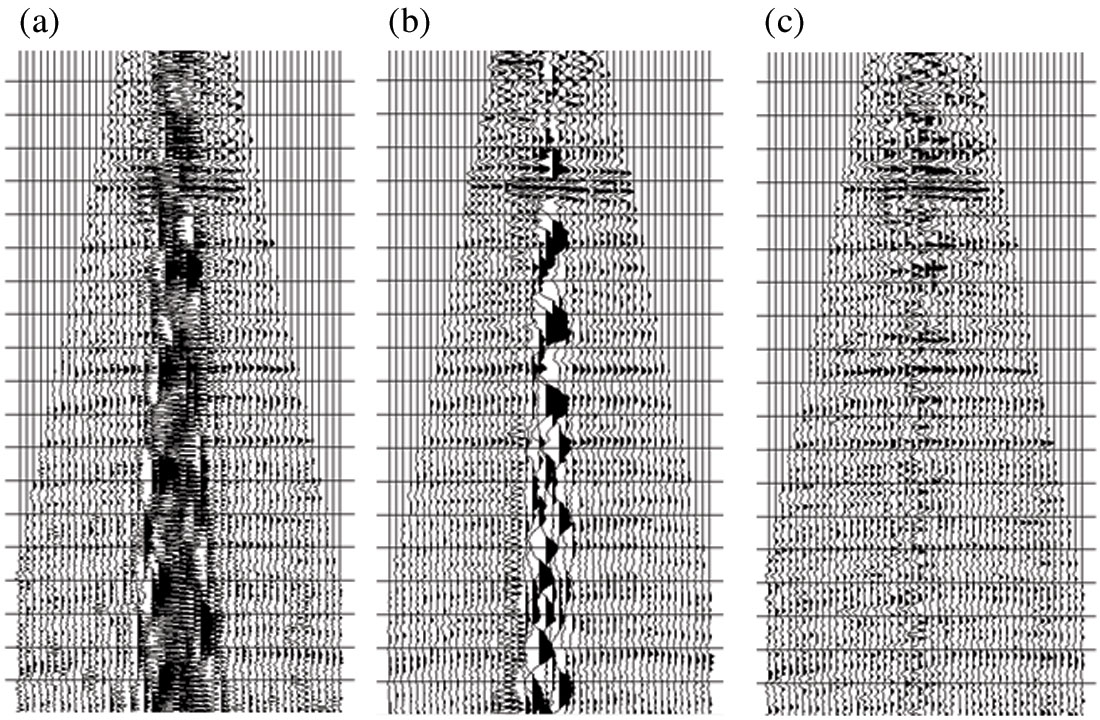
Time-variant spectral whitening (TVSW) can also effectively attenuate ground roll noise. TVSW decomposes a seismic trace into frequency sub-bands and separately scales these frequency-sliced traces in a time-variant fashion to a fixed amplitude level. The final output from TVSW is the summation of these scaled sub-band traces. The benefits of TVSW (Perz et al., 2005) include compensating for the attenuation of high frequencies with time due to Q, balancing the amplitude spectrum outside the deconvolution design gate, and noise attenuation. The suppression of ground roll noise is conveniently done by bringing down the high amplitude spectrum of ground roll at the low frequencies to the same level as some average signal spectrum in the whole bandwidth. Figure 1c shows the result of TVSW applied on Figure 1b, and it is obvious that TVSW has almost completely removed the ground roll noise. TVSW is routinely used in seismic data processing to attenuate noise and to improve the resolution of the seismic data. Its ability to successfully suppress high amplitude narrow-band noise has conveniently reduced the requirement to develop other methods of attacking such noise. The TVSW method is often implemented using AGC-type scaling algorithms on frequency domain decomposed traces. Such scaling methods, however, act without perfectly preserving signal amplitudes. Consequently, TVSW is generally considered inappropriate when true-amplitude processing is required.
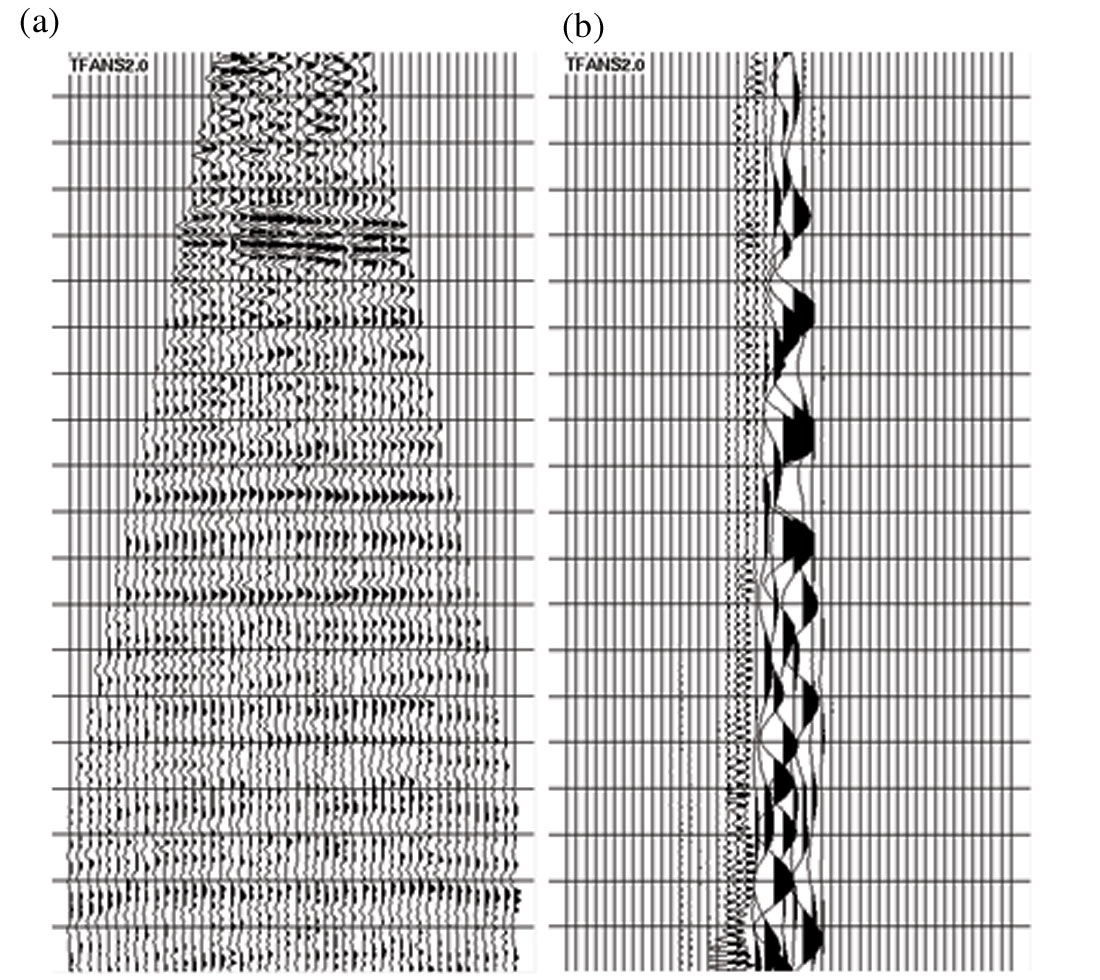
We introduce a new method that attenuates high amplitude noise without significantly degrading signal amplitude information. It is called time-frequency adaptive noise suppression, or T-FANS. It compares trace sample strengths within a specific time and spatial range and frequency bandwidth. It operates locally, so that samples that are far from high amplitude noise do not change. It is adaptive because the noise suppression rates change with the strength level of local signal and noise. Before going into a detailed discussion of T-FANS, we show how it works on the example in Figure 1. Figure 2a shows the record in Figure 1b with noise attenuated by T-FANS, and Figure 2b shows the noise identified by T- FANS. T- FANS has completely removed the ground roll noise, and no coherent reflection signal is lost in the process. Compared with the TVSW results in Figure 1c, not only is the near-offset residual noise removed, but the traces without ground roll are kept unchanged.
Numerous applications of T-FANS have been very successful in producing amplitude friendly prestack data. The following sections discuss the methodology of T-FANS and its implementation. More data examples are also provided with detailed discussions.
Methodology and implementation
The T- FANS method is designed to suppress high amplitude noise residing in a certain time range, a certain frequency range, and in a certain trace range. Ground roll energy, for example, usually resides at low frequencies and at small offsets that grow in range with time. It tends to be a good candidate for the T- FANS method. Here we analyze the procedure of the T- FANS methodology.
First, we quantify the “amplitude” of seismic trace samples in order to detect exceptionally high amplitude energy. This is not trivial since a time sample value (or absolute value of the sample) cannot be directly used. Such sample values are always “associated” with their neighbouring samples, and they can be easily changed by simple processing operations such as phase rotation, static shifts and filtering. One robust quantification of the “strength” (instead of still calling it “amplitude”) of a seismic sample is the average (mean or RMS or median) amplitude in a time window centered on that sample. Other quantities such as the trace envelope can also provide measures of sample strength. Different determinations of sample strength should not result in a significantly different performance of the T- FANS method.
To determine whether a seismic sample is too strong, one still has to compare its strength with those of some other samples. Choosing a proper neighborhood for comparing sample strengths is the next issue. The basic guideline for choosing such a neighborhood is to make the unwanted noise easy to identify.
In a comparison neighborhood, the amplitude of desired signal in the neighborhood should not change dramatically, and the undesired strong noise should be distributed sparsely. For example, the samples at each time level in a common shot or common receiver gather, or a super-CDP gather (after statics and NMO are applied) are good choices for the isolation of ground roll noise. The samples at a constant time level in a single NMO corrected CDP gather may not be a perfect choice because of the lack of statistics due to low CDP fold. Also, common offset sections are not proper candidates for the attenuation of ground roll noise because the ground roll energy distributes uniformly across a wide area within offset ranges. Surface-consistent scaling before T-FANS is essential since the balanced energy distribution amongst shots and receivers ensures the reliability of the relative amplitudes of reflection signal from trace to trace in a shot, receiver or CDP gather.
When a comparison neighborhood is chosen, a “normal” signal strength of this neighborhood needs to be defined in order to identify if “abnormally” large samples are present. The normal strength of a neighborhood can be the median or average value of the strengths of samples in the neighborhood. If a sample’s strength is greater than a specified multiple of the neighborhood strength, it is considered to be contaminated by high amplitude noise and this sample’s amplitude is reduced. The relative differences between a sample’s strength and its neighborhood’s strength will determine the suppression rate at this sample. Naturally, the more a sample’s strength exceeds the neighborhood strength threshold, the more noise this sample is likely to contain and the more its amplitude will be reduced. The proportional relationship between sample amplitude and suppression rate represents one aspect of the adaptive property of the method. The adaptive property is also reflected by the localization of neighborhood strength. Different neighborhoods may have different strength levels. Relatively weaker noise can still be identified if its strength exceeds the local threshold.
The procedure described above can certainly suppress some strong noise, but concerns arise because seismic samples with high amplitude noise often contain significant amounts of useful signal. If a sample is found to be too strong and its amplitude is reduced, not only is the noise suppressed, but the underlying signal is also suppressed at the same rate. It is very difficult to perfectly separate noise from signal in the natural time-space domain so further separation of signal and noise in another domain would certainly be helpful. This is where frequency decomposition comes into play; it utilizes the frequency domain locality of some noise, such as ground roll noise. If the unwanted noise only resides in a certain narrow frequency range, the suppression of such noise should only happen in this frequency range, and any signal outside of this range should remain intact. In our implementation of T- FANS, each input trace is first decomposed into several traces, each with a different frequency band of the original trace. Traces with the same bandwidth, gathered together as a bandpassed dataset, are run through the high amplitude energy identification and attenuation process described above, so that noise in different frequency ranges is suppressed separately. The final output is the reconstruction from all the bandlimited, noise suppressed traces. Choosing a narrower frequency bandwidth for each decomposed dataset produces more components and a more detailed isolation of noise from signal.
Seismic trace decomposition based on frequency ranges might not be the best for all types of noise. For example, random noise is also randomly distributed in the Fourier domain. Frequency domain decomposition does not further separate random noise from signal. In general, any trace decomposition should be workable as long as the undesired noise is further isolated in the decomposition domain and the original traces can be accurately reconstructed from the decomposed components. We have not implemented any other decomposition scheme, but could do so in the future.
With prior information, the whole T- FANS process , including trace decomposition, noise identification and suppression can be designed to work only on the frequency range where the target noise resides. This implementation allows efficient focused analysis of certain types of noise, and leaves the rest of the energy unchanged. For the attenuation of ground roll noise, the decomposition can be carried out for frequencies up to about 25 to 30 Hz, and data above this frequency can be left unanalyzed and unchanged. A significant amount of computational cost can be saved in such cases.
Examples and discussion
Using a low-cut frequency filter aggressively will eventually remove all the ground roll energy but usually a significant amount of low frequency signal is sacrificed. This is not acceptable in almost any stage of seismic data processing. Figure 3 compares the removal of ground roll noise on a shot record using bandpass filters versus the results obtained with T- FANS.
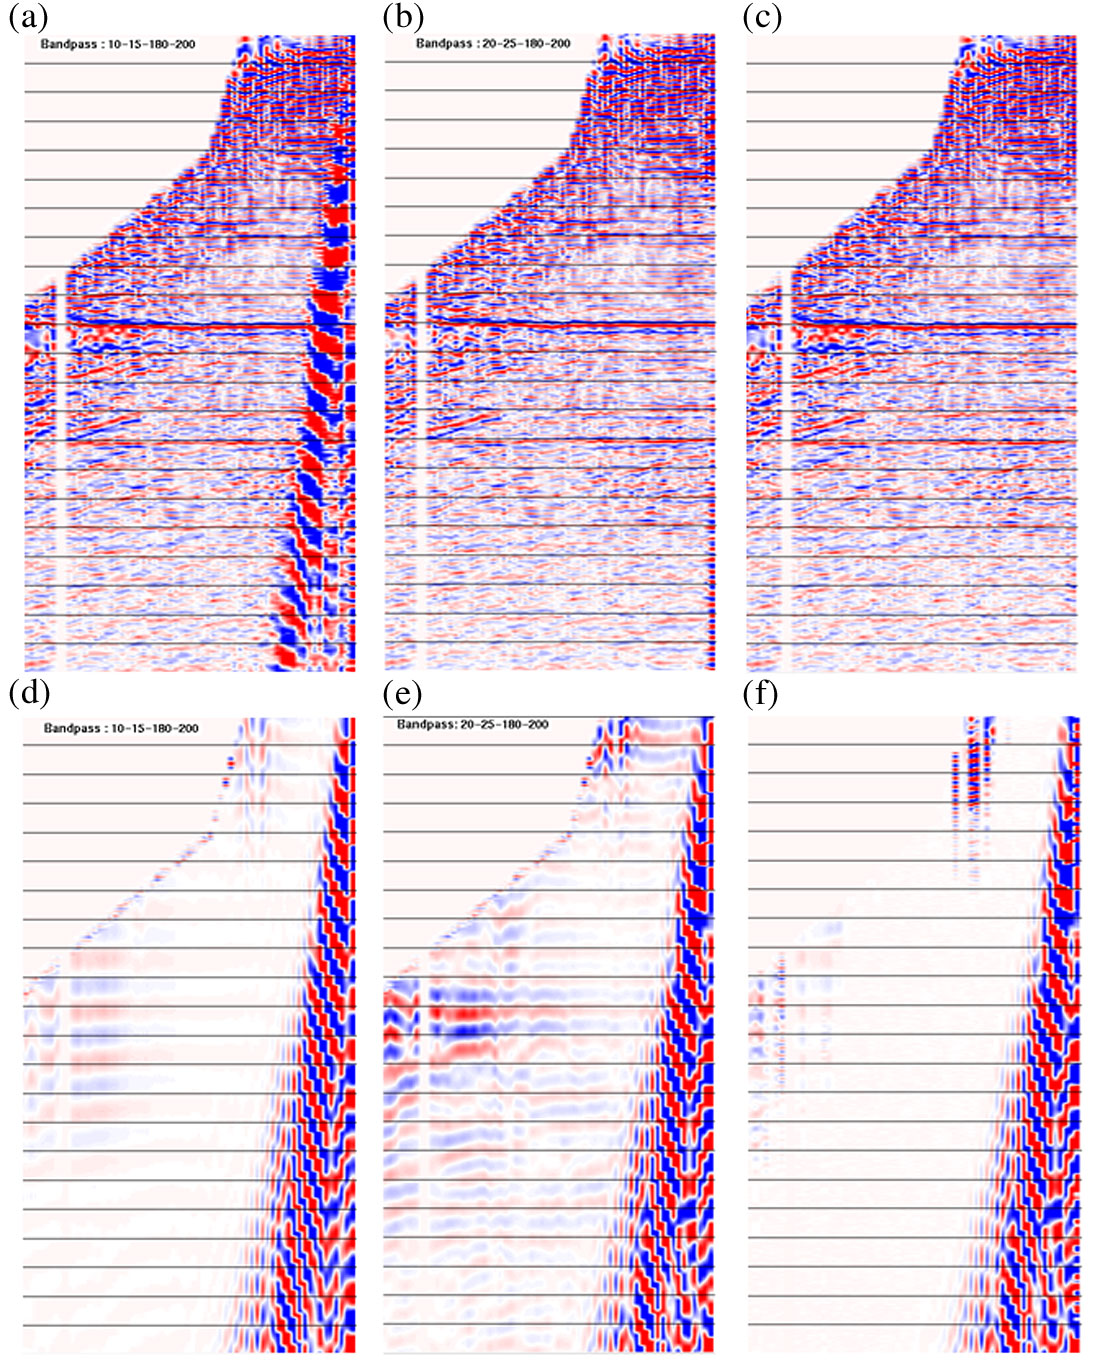
Figures 3a and 3d, aligned vertically, are the accepted part and rejected part, respectively, of a bandpass filter (10-15-180-200 Hz) that is probably acceptable for a final seismic product. The rejected energy does not contain much useful signal, which is good news. However, the filtered record still contains a lot of ground roll energy on the near offset traces. Figures 3b and 3e are the accepted part and rejected part, respectively, of a more aggressive bandpass filter (20-25-180-200 Hz). The ground roll energy is almost completely removed, but the rejected energy contains too much reflection energy. Figures 3c and 3f, again aligned vertically, are the signal and noise parts separated by the T-FANS method. The high amplitude ground roll energy is attenuated without losing any visible reflection signal.
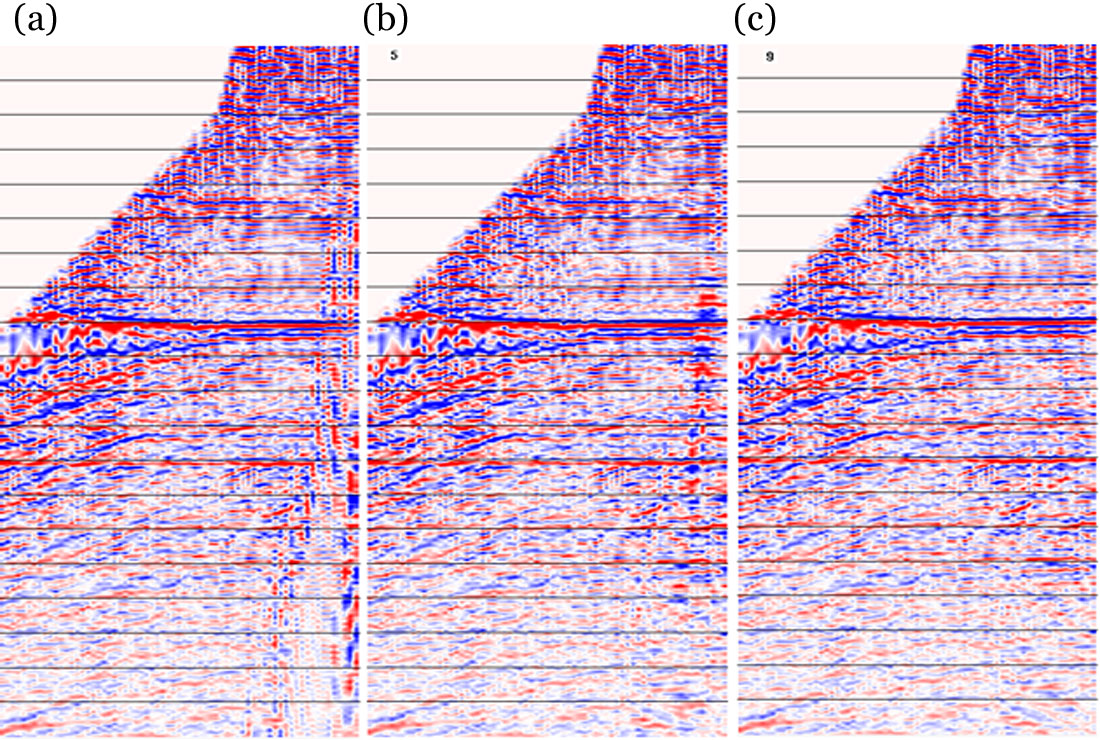
T-FANS without frequency decomposition can attenuate high amplitude noise but it is less effective at separating signal and noise when applied this way. Some noise cannot be identified when its amplitude is not exceptionally high compared to the signal in the full bandwidth. In addition, without frequency decomposition, the suppression of narrowband noise requires the suppression of signal in other bandwidths. Figure 4 shows the experiments of T-FANS applied to a shot record using different numbers of frequency panels for decomposition. Figure 4a is the result from T-FANS without frequency domain decomposition, Figure 4b is the T-FANS result using 5 frequency panels, and Figure 4c is the T-FANS result using 9 frequency panels. The amplitude threshold and other related parameters were the same for all three experiments. It is evident that the result with 9 panels (Figure 3c) is the most successful in attenuating the ground roll energy. Many examples from different areas have shown that using frequency panels with a width of about 5 Hz provides enough detail for most seismic data. In this example, the 9-panel experiment (Figure 4c) uses panels with about a 5-Hz bandwidth. We have not shown the rejected parts from these three experiments because none of them contains visible reflection signal.
A critical parameter that needs to be tested before the application of T- FANS to the data is the threshold value. The threshold value determines how strong a sample must be to be considered “too strong”. Smaller threshold values detect more noise and could mistakenly identify some useful signal as noise; larger threshold values, on the other hand, may leave too much noise identified as signal. In some cases, one fixed threshold value can produce satisfactory results for all the time levels and all the data in a survey, especially when high amplitude noise occurs only in a relatively short time period. However, we have found that a time-variant threshold function is often needed to produce the best results. More carefully chosen threshold values not only attenuate more noise but also preserve signal amplitudes better.
A suite of trial runs may be made to establish threshold parameters that ensure that no useful signal is removed. The noise detected in a test dataset using a series of constant threshold values is shown in Figure 5. Figures 5a to 5f show the results with threshold values of 1.0, 1.5, 2.0, 2.5, 3.0, and 3.5, respectively. We can see that at early times, smaller thresholds have identified some signal as noise, indicating that larger threshold values may be safer to use. At later times, however, it seems that larger threshold values have not identified some noise that smaller ones have. In this case, a time-variant threshold function might just be what we want.
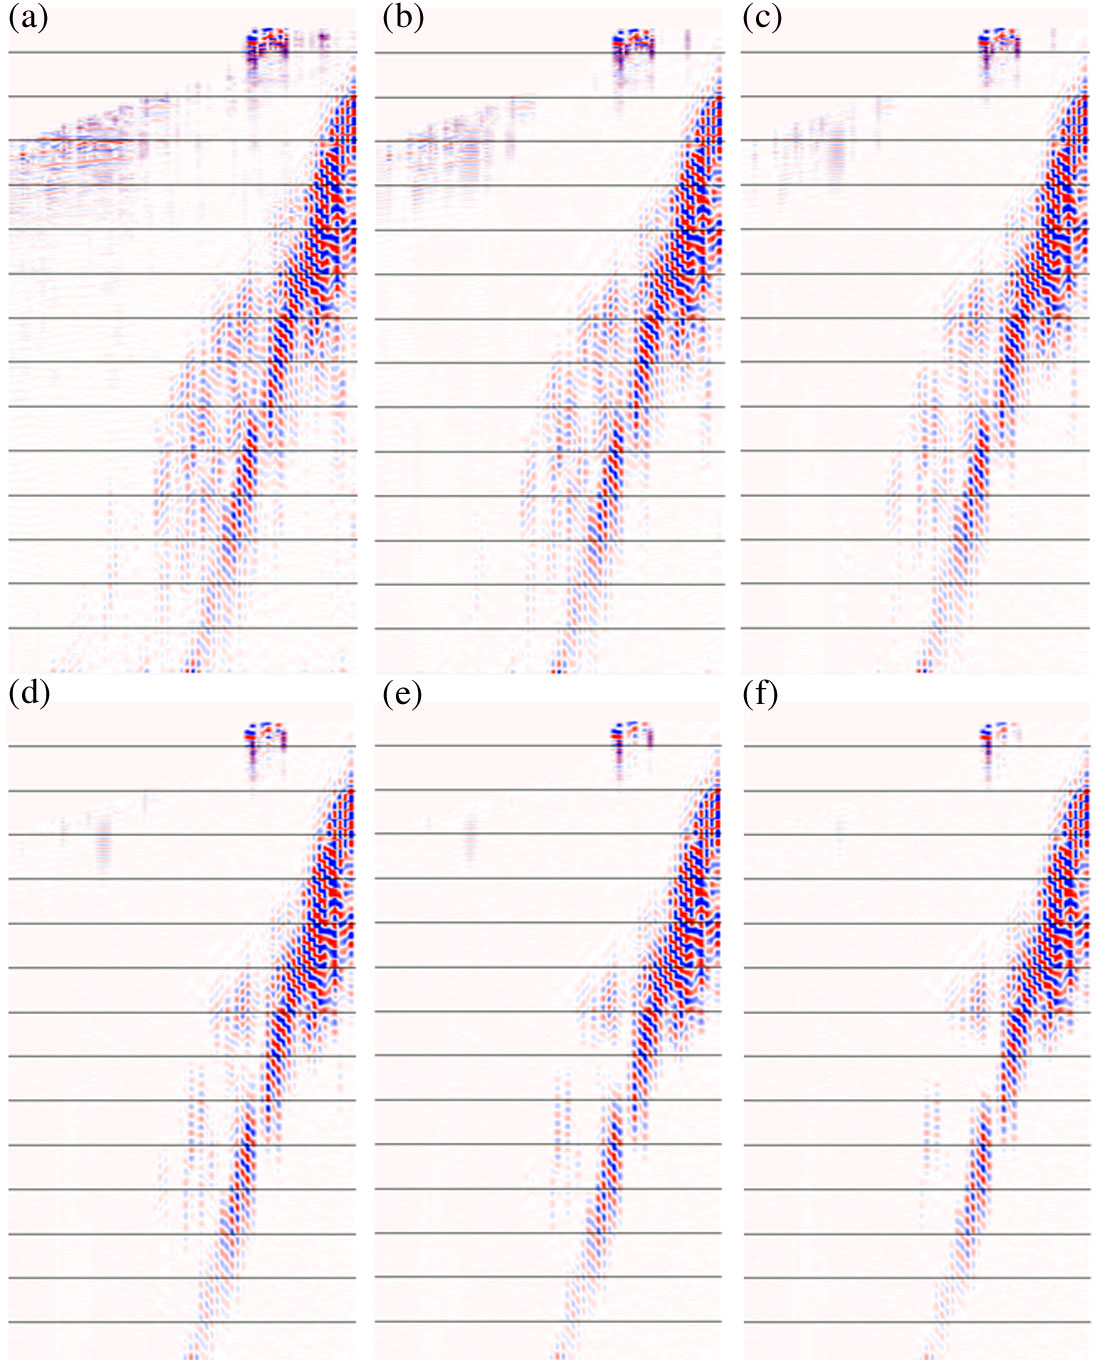
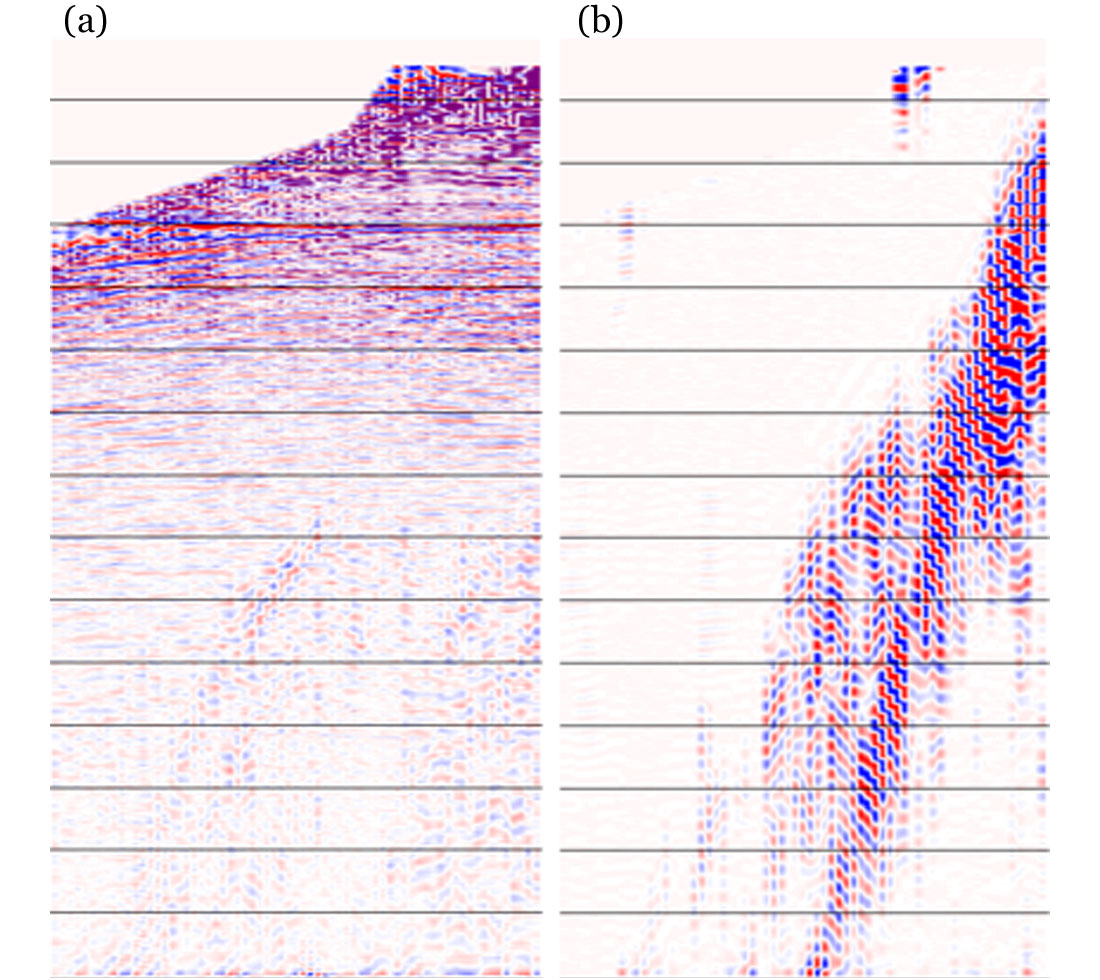
Figure 6 shows the result obtained using T-FANS with time-variant thresholds, when applied to the input record used in Figure 5. The T-FANS processed record is shown in Figure 6a, and Figure 6b is the noise portion identified by a time-variant threshold function.
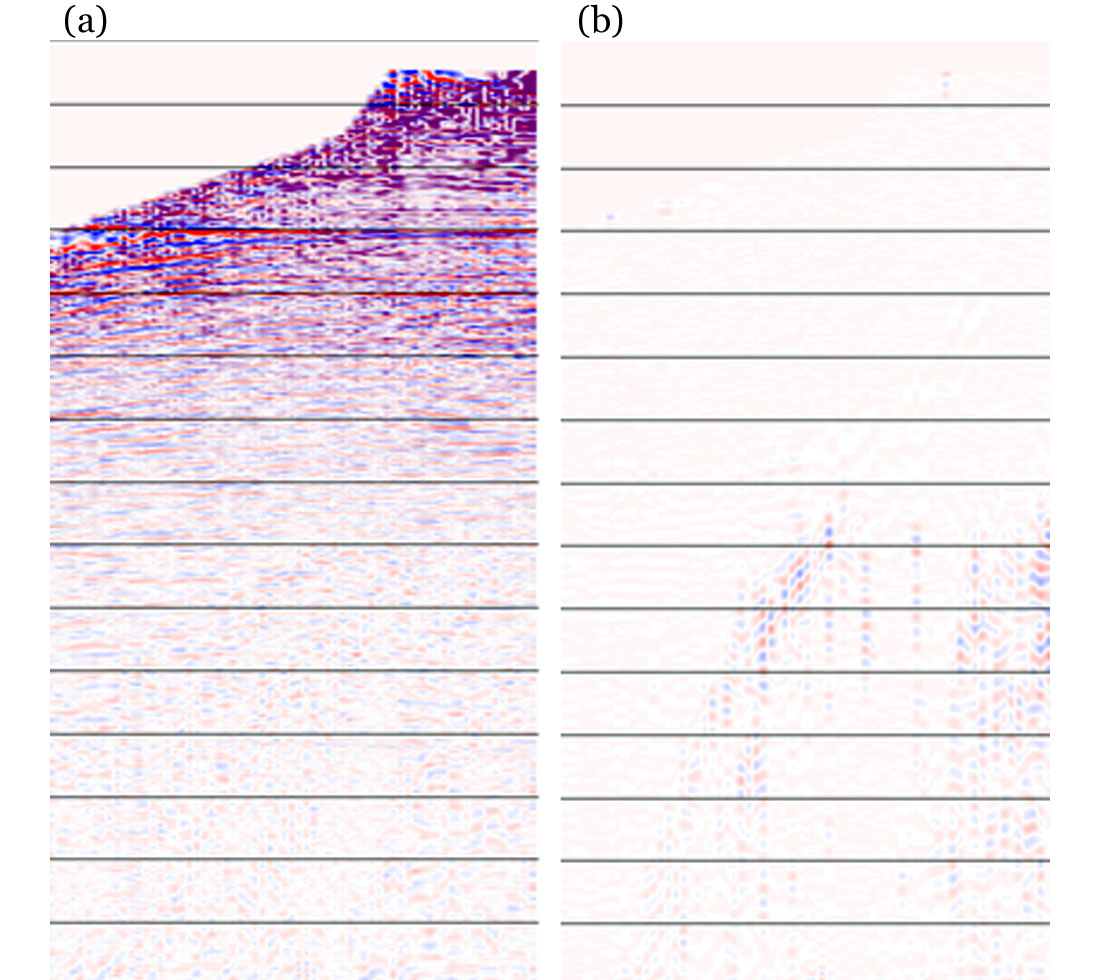
The record shown in Figure 6a is significantly improved by one application of T-FANS. However, there is still some visible coherent noise at later times that might be identified by T-FANS. A further application of T-FANS with a focus on later times was carried out and the results are shown in Figure 7. Figure 7a is the T-FANS processed record and Figure 7b is the identified residual noise. This example also suggests the possibility of focused noise analysis and T-FANS application for a certain time range only. At the times where no noise suppression is needed, very large threshold values could be used.
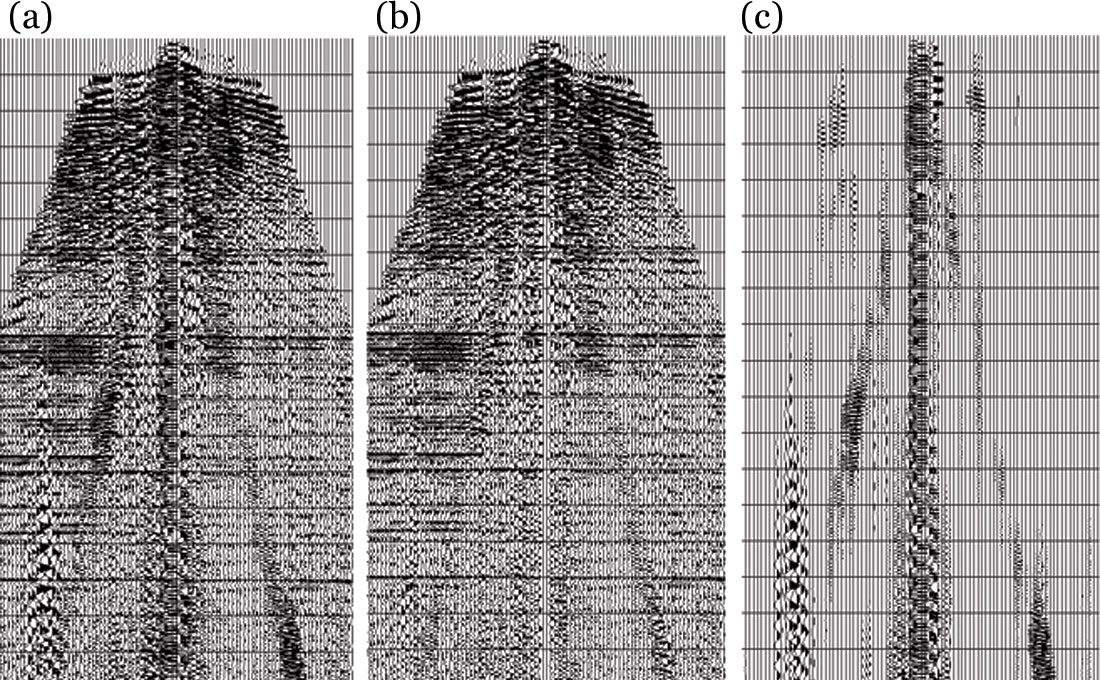
The examples shown so far have focused on the attenuation of ground roll noise. In fact, T- FANS can also attenuate other types of noise as long as it can be detected as anomalously high amplitude energy. Figure 8a shows a record which does not have very strong ground roll but it has other types of noise. Figure 8b is the record processed by T- FANS and Figure 8c is the identified noise.
Conclusion
We have introduced and explained the methodology behind T- FANS, a method of noise attenuation that is highly effective at separating signal and high amplitude noise that is locally separable in the space-time domain and the frequency domain. This method of attenuating noise is especially useful in preparing data for studies such as amplitude-versus-offset analysis because of the excellent preservation of true signal amplitudes.


Join the Conversation
Interested in starting, or contributing to a conversation about an article or issue of the RECORDER? Join our CSEG LinkedIn Group.
Share This Article