We report on the development of a downhole sparker source that is able to generate acoustic signals with peak frequencies between 2 and 1000 Hz. The sparker can be configured such that the energy of the produced acoustic signals lies within a spectral band that is suitable for transmission lengths of the order of thousands of feet, making it a viable source for Cross Well Tomography, Single-Well Imaging, and Reverse Vertical Seismic Profiling. The sparker produces repeatable shots and allows a firing rate of the same order as typical listening times in borehole seismic applications. This paper summarizes the development of a prototype tool and results from recent field tests.
Introduction
Over the past couple of decades, the need for a suitable source for Cross Well Tomography (CWT) and near-surface site characterization drove the development of downhole sparkers (Baria et al., 1989; Mahrer & Zook, 1993; Rechtien et al., 1993; Dyer et al., 1996). Sparkers are desirable due to their simplicity, repeatability, and broad bandwidth, providing the necessary resolving power for the source-detector distances and geological features considered in these two applications. In the literature, one therefore finds descriptions of borehole sparkers that typically use stored electrical energy of the order of 100-1000 J to create an acoustic pulse in the borehole that has been observed up to several hundred feet away in sedimentary rocks.
While the mentioned energies and broad bandwidth serve the requirements of CWT and nearby targets, they become a limitation if one wants to use downhole sparkers in Single-Well Imaging (SWI) and Reverse Vertical Seismic Profiling (RVSP) of oil and gas reservoirs. In these applications, acoustic pulses need to travel distances of the order of thousands of feet, at least. Attenuation along such comparatively long travel paths consumes a large part of the energy contained in a broadband pulse as it is generated by the above-mentioned sparkers. Increasing the stored electrical energy will certainly help increase the energy contained in the acoustic pulse, but this measure strongly depends on the sparker’s efficiency and is limited by the size of downhole tools.
In addition to the general requirements for seismic sources, as outlined by Kramer et al. (1969) and Omnes (1990), for example, we believe that for SWI and RVSP applications a viable downhole sparker needs to provide:
- an acoustic pulse whose energy is concentrated in the first couple of hundred Hertz of the spectrum;
- an adjustable bandwidth to fine-tune this pulse to different lithologies;
- directionality to focus the acoustic energy to where it is needed;
- a firing interval of the order of seconds;
- shot repeatability;
- controllability from the surface.
In the following paragraphs, we will describe the development of a downhole sparker aimed at fulfilling these characteristics.
Basic Sparker Physics
A sparker consists of two closely spaced electrodes immersed in a fluid that are connected to a capacitor, a power supply, and a switch. The capacitor is charged by the power supply and discharged by closing the switch. Discharging the capacitor creates a voltage between the electrodes high enough to cause dielectric breakdown of the fluid in between. During this breakdown, the fluid becomes first ionized and a current starts to flow between the electrodes. This happens extremely fast, an observer usually sees a short spark between the electrodes (Figure 1), and produces heat, which almost instantaneously vaporizes the surrounding fluid and a vapor bubble of high pressure and temperature is formed.
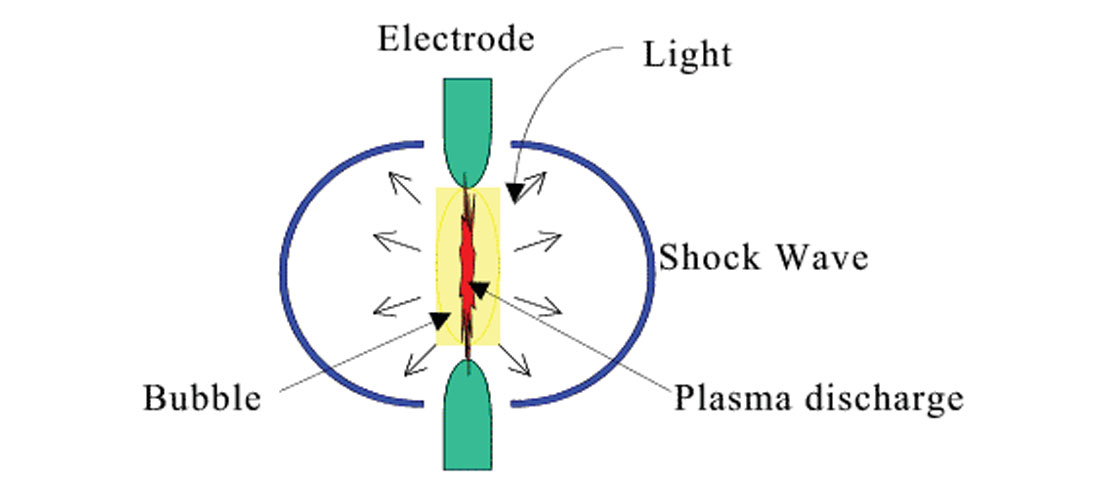
This vapor bubble immediately begins to force outwards the fluid around it, thereby generating a pressure shock wave in the liquid. The bubble expands for a short time and when the pressure inside the bubble has fallen below the ambient pressure level, it collapses and creates a second pressure pulse similar to the first. During the collapse the liquid reverts back to its equilibrium state.
The characteristics of the shock waves radiating outward from the sparker determine the character of the acoustic signal thereby created. Under typical downhole conditions, sparkers generally produce signals having a very broad acoustic energy spectrum with peak frequencies of 1000 Hz or more. With the low-frequency technology reported here, we are able to adjust the sparker from the surface to produce acoustic energy spectra that peak at frequencies between 2 and 1000 Hz. This greatly increases the theoretical and actual range of the acoustic signal.
Initial Laboratory Testing
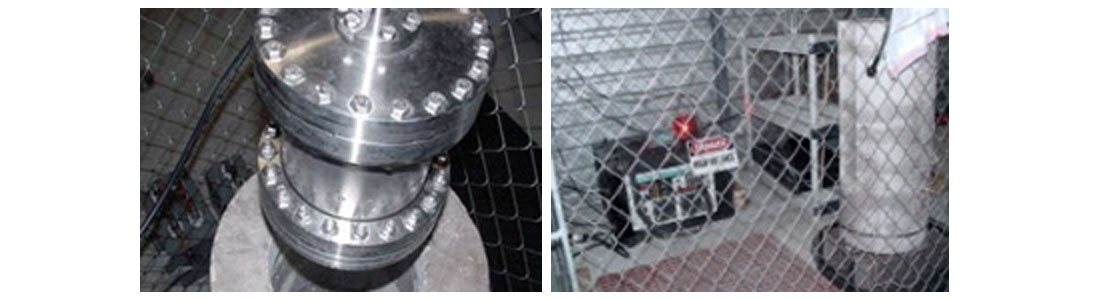
To create the technology behind a controllable low-frequency sparker seismic source, the last three authors decided in 2006 to undertake a study of sparker designs, mechanisms for coupling the vapor bubble expansion and contraction to the surrounding medium, the effects of fluid properties and dynamics, linear and non-linear acoustics, and signal directionality. Numerous lab tests were conducted, including a series in which a sparker was suspended in water inside a 40-inch long cylindrical sample of Sierra White Granite of 16-inch diameter with an 8.5- inch bore in the center (Figure 2). A calibrated hydrophone was placed in the water-filled bore, and accelerometers were affixed to the outside surface of the cylindrical rock sample. Data were collected with sparker power levels ranging from 400 to 2200 J.
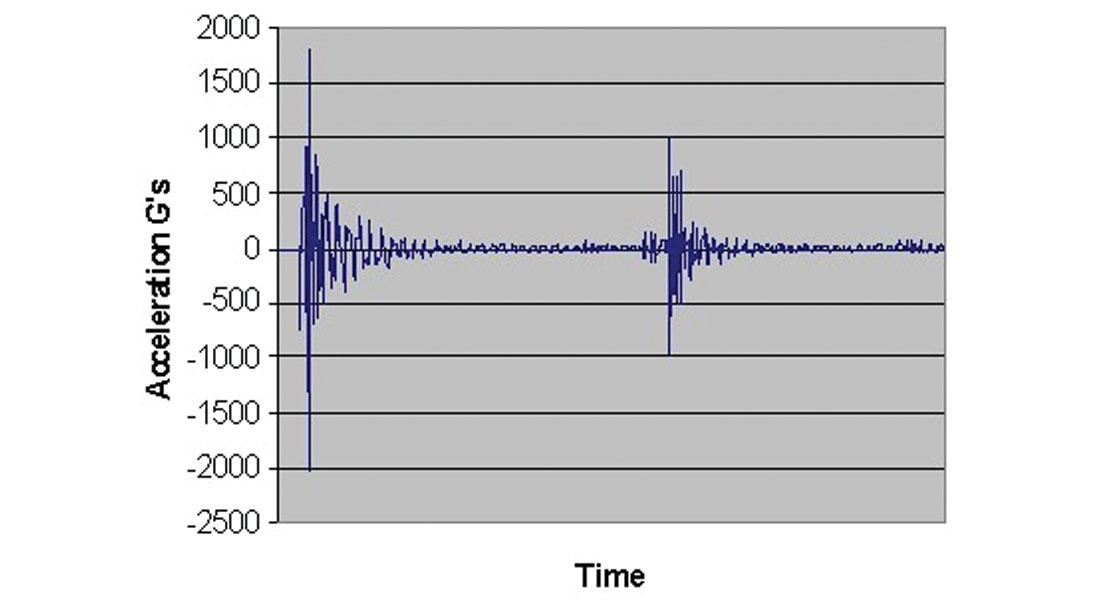
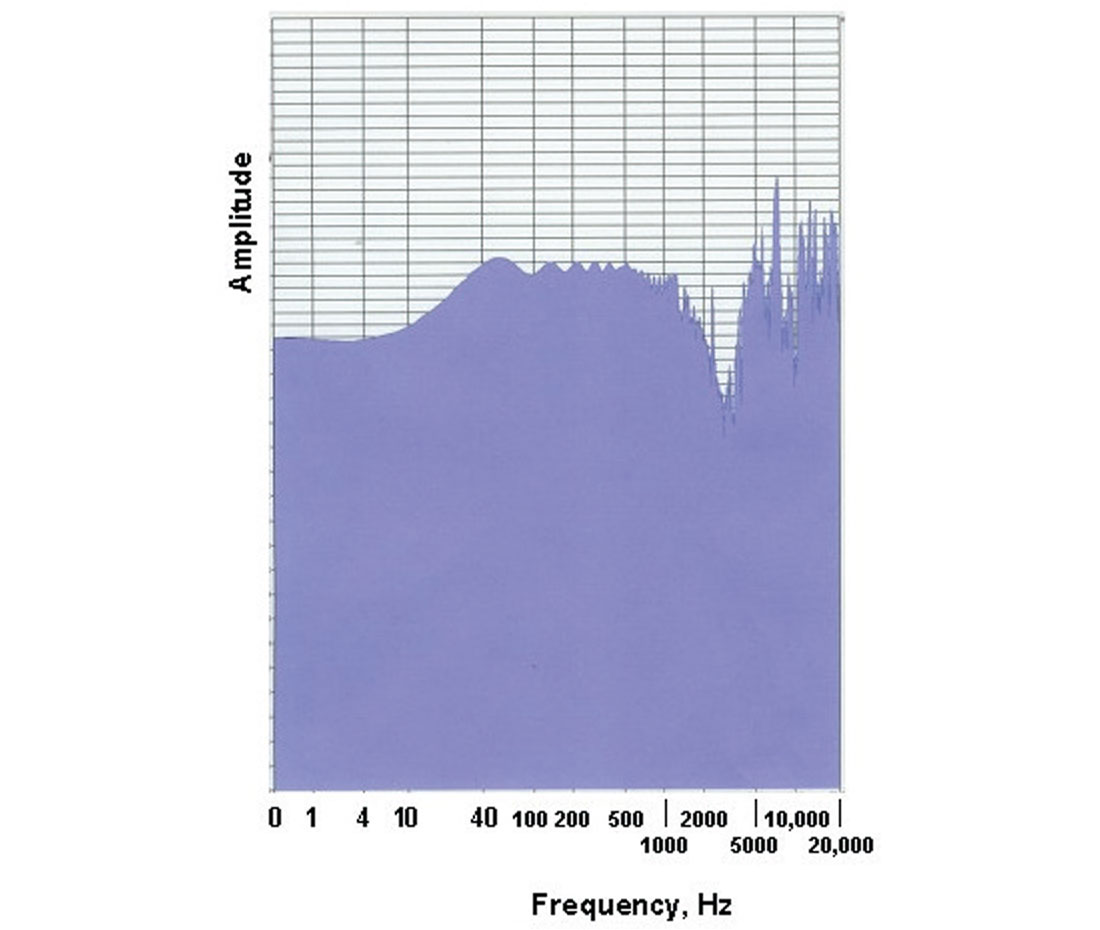
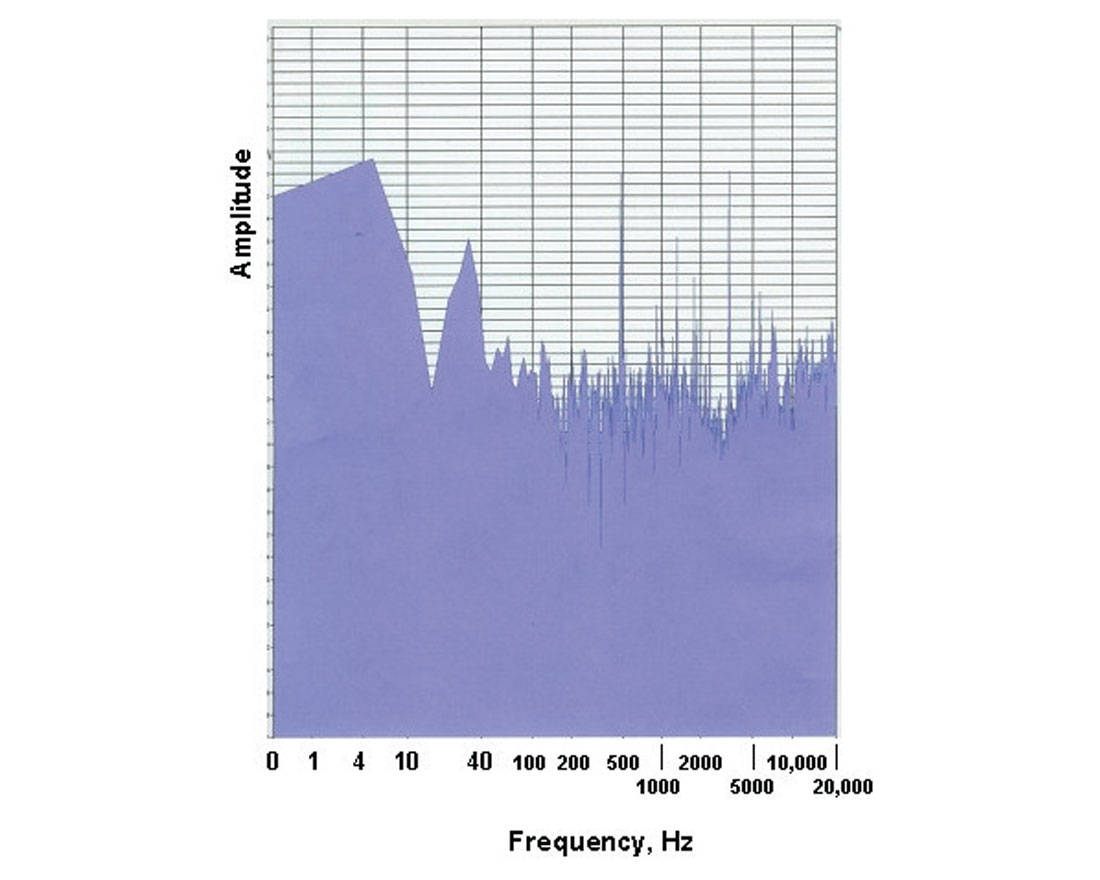
Figures 3 shows an accelerometer recording of a single spark discharge; the two shock waves from formation and collapse of the bubble are clearly visible. The fundamental frequency for these conditions lies between 40 and 100 Hz (Figure 4). Although there is significant energy in the kHz range these experiments showed that it is possible to create low frequencies with a sparker.
Successful modeling of these results led then to lab testing of various (high-frequency) sparker configurations. The best performing configuration was selected for a field test at the University of Texas Devine Seismic Test Site near Hondo, Texas. While surface seismic recordings showed success in demonstrating that the sparker at 1800 feet would provide sufficient signal strength at the surface when powered with 2200 Joules, it became apparent that extreme power levels would be necessary to achieve the same goal at greater depths. A way had to be found to create more energy at the lower frequencies and be able to control it.
Additional tests in the simulated wellbore led to the discovery that with some (patent pending) adjustments to the spark discharge process the peak frequency of the spectrum could be shifted either up or down over a wide frequency range. Shown in Figure 5 is the frequency spectrum for the same test set-up as in Figure 2 but with the spark process adjusted to produce a peak frequency of 5 Hz (cf. Figure 4). Note that the frequency spectrum is now shifted towards the lower end, that the first peak is at around 5 Hz, and that there is significantly less energy at the high end of the spectrum.
Drillstring Prototype
This discovery energized the development program and led to the fabrication of a drillstring-deployable sparker tool to evaluate the technology in a real well. The prototype tool is 26 feet long, 8-inch in diameter and powered by a mud-driven downhole turbine alternator. It was field tested at the Rocky Mountain Oilfield Testing Center (RMOTC) near Casper, Wyoming. The test well has casing from surface to approximately 650 ft; the sparker tool was placed at 4,000 ft for the tests. Two orthogonal surface seismic receiver lines were laid out close to the wellhead location, each of which employed 48 receivers at 55-feet spacing. The two lines crossed directly above the bottom hole location of the borehole, approximately 500 ft west of the wellhead location.
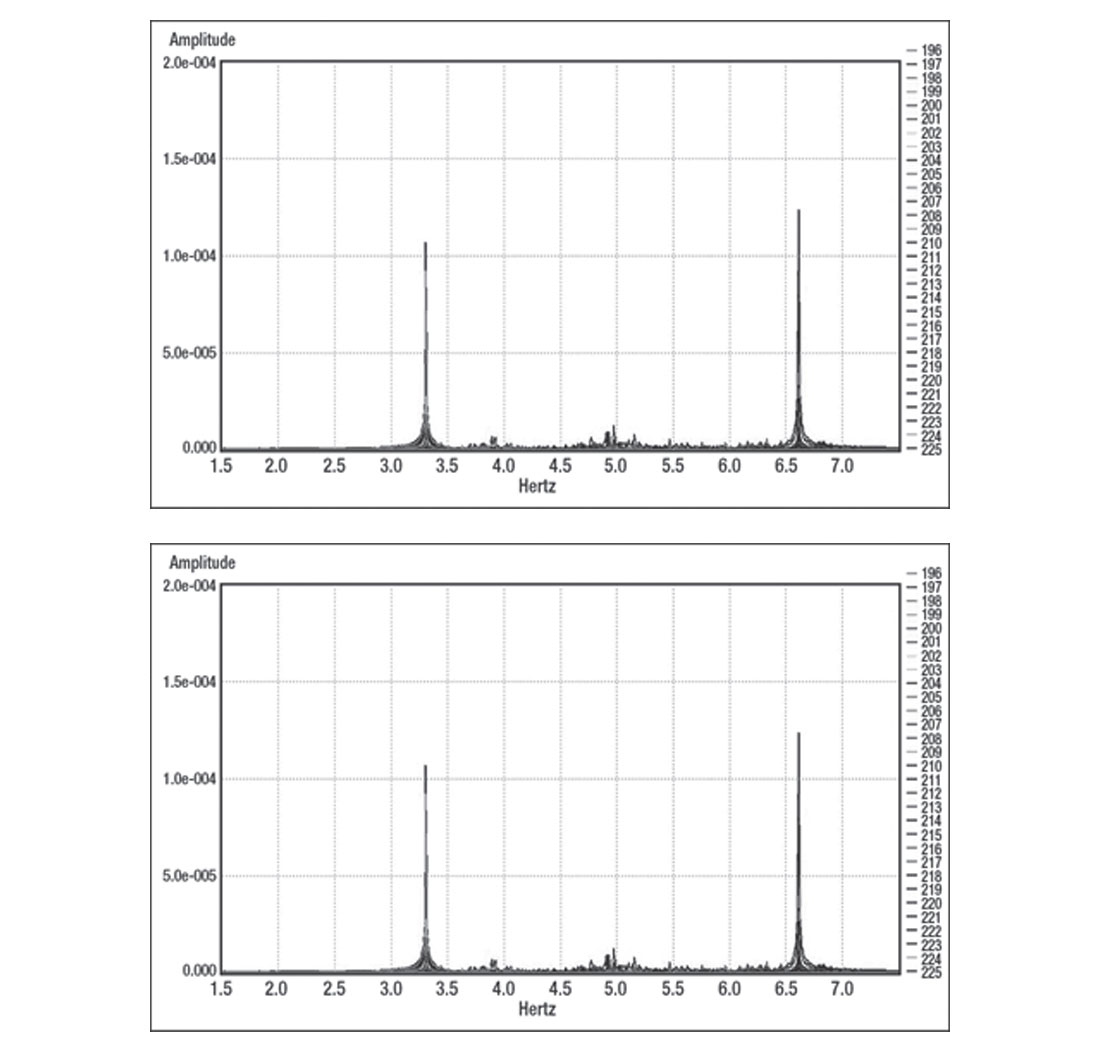
The sparker tool was set to produce a peak frequency of 2 Hz, since that was assumed to be below the general bandwidth of the background noise. This background noise was generated by mud pumps with 3.3 Hz and 6.6 Hz frequencies, as shown in Figure 6 (top). Unfortunately, it was found that the seismic recording system was not capable of detecting signals below 3 Hz, so the 2-Hz signal from the sparker tool could not be observed directly. It was discovered, however, that the 2-Hz tool signal modulated the 3.3-Hz mud pump signal, creating a spectral peak at 5.3 Hz (Figure 6, bottom). This demonstrated that a low-frequency acoustic signal can travel over longer distances, and therefore the possibility of creating a downhole sparker suitable for RVSP and SWI applications. A more detailed account of this development phase can be found in Radtke et al. (2009).
Wireline Prototype
Based on these encouraging results, a wireline tool employing the lowfrequency technology was designed and built. The 16-ft long, 3-inch diameter tool has a built-in power supply that operates on standard wireline voltages. It was recently field tested in two different wells.
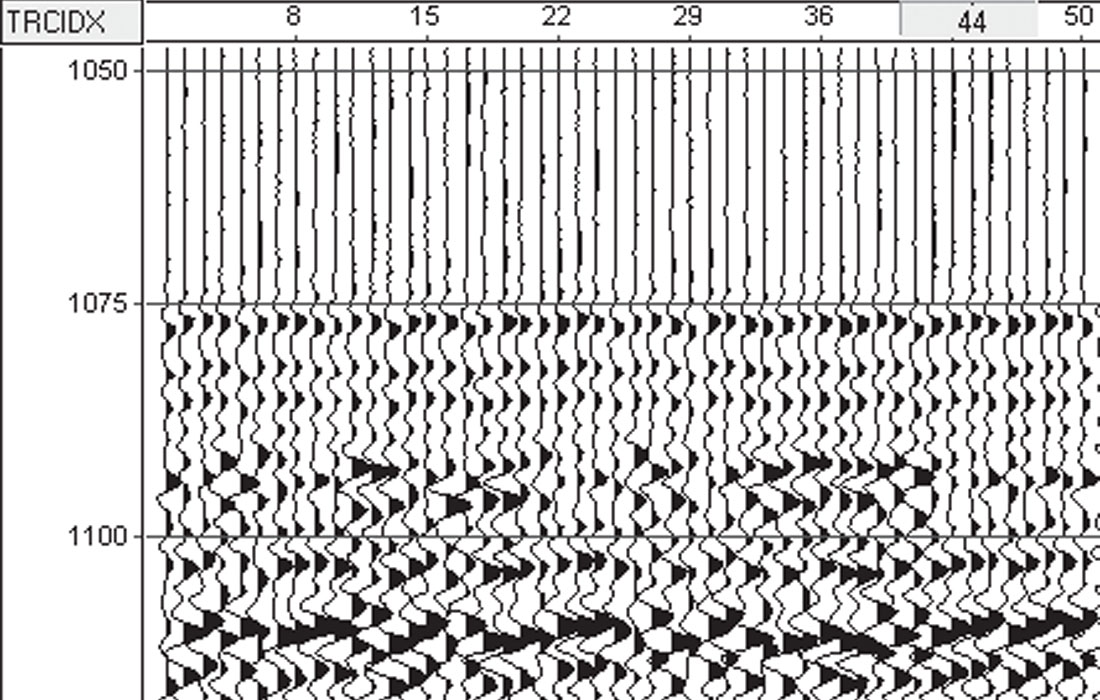
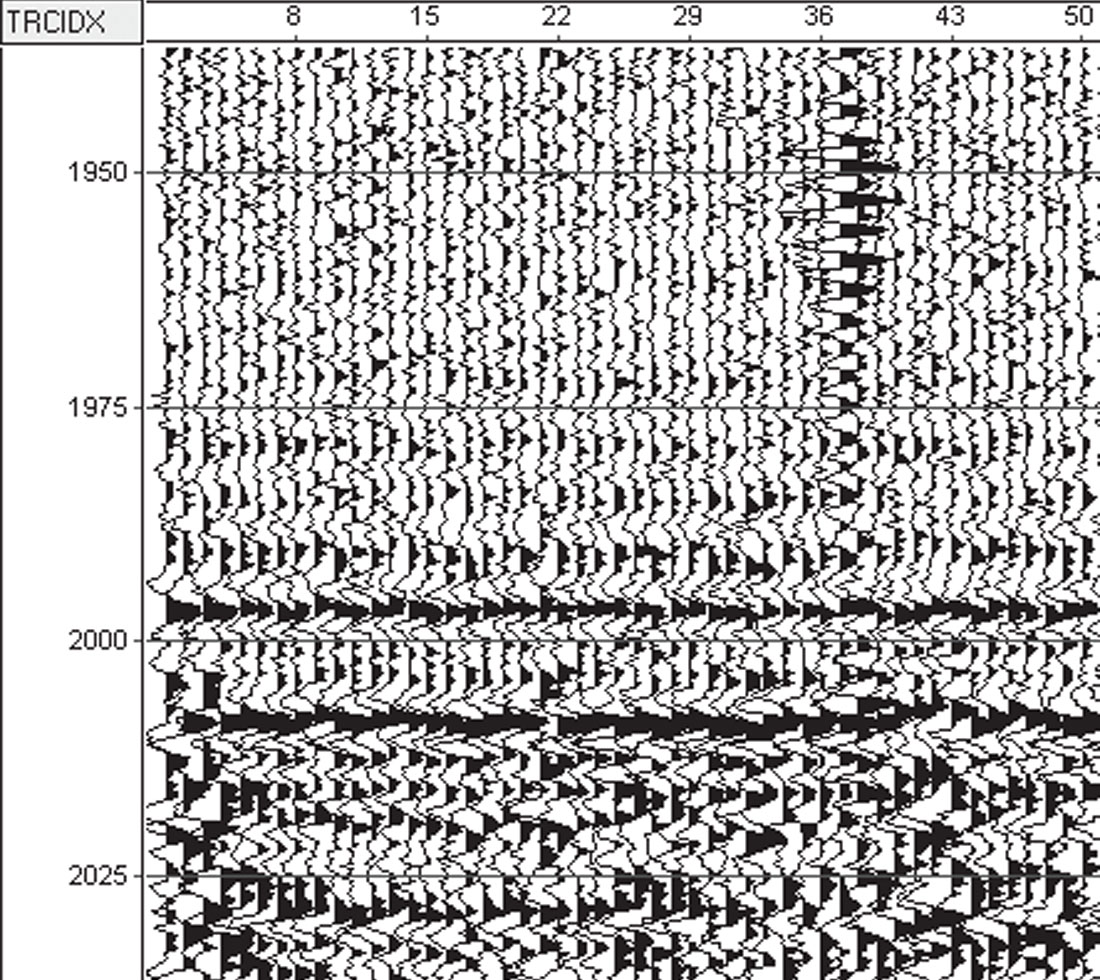
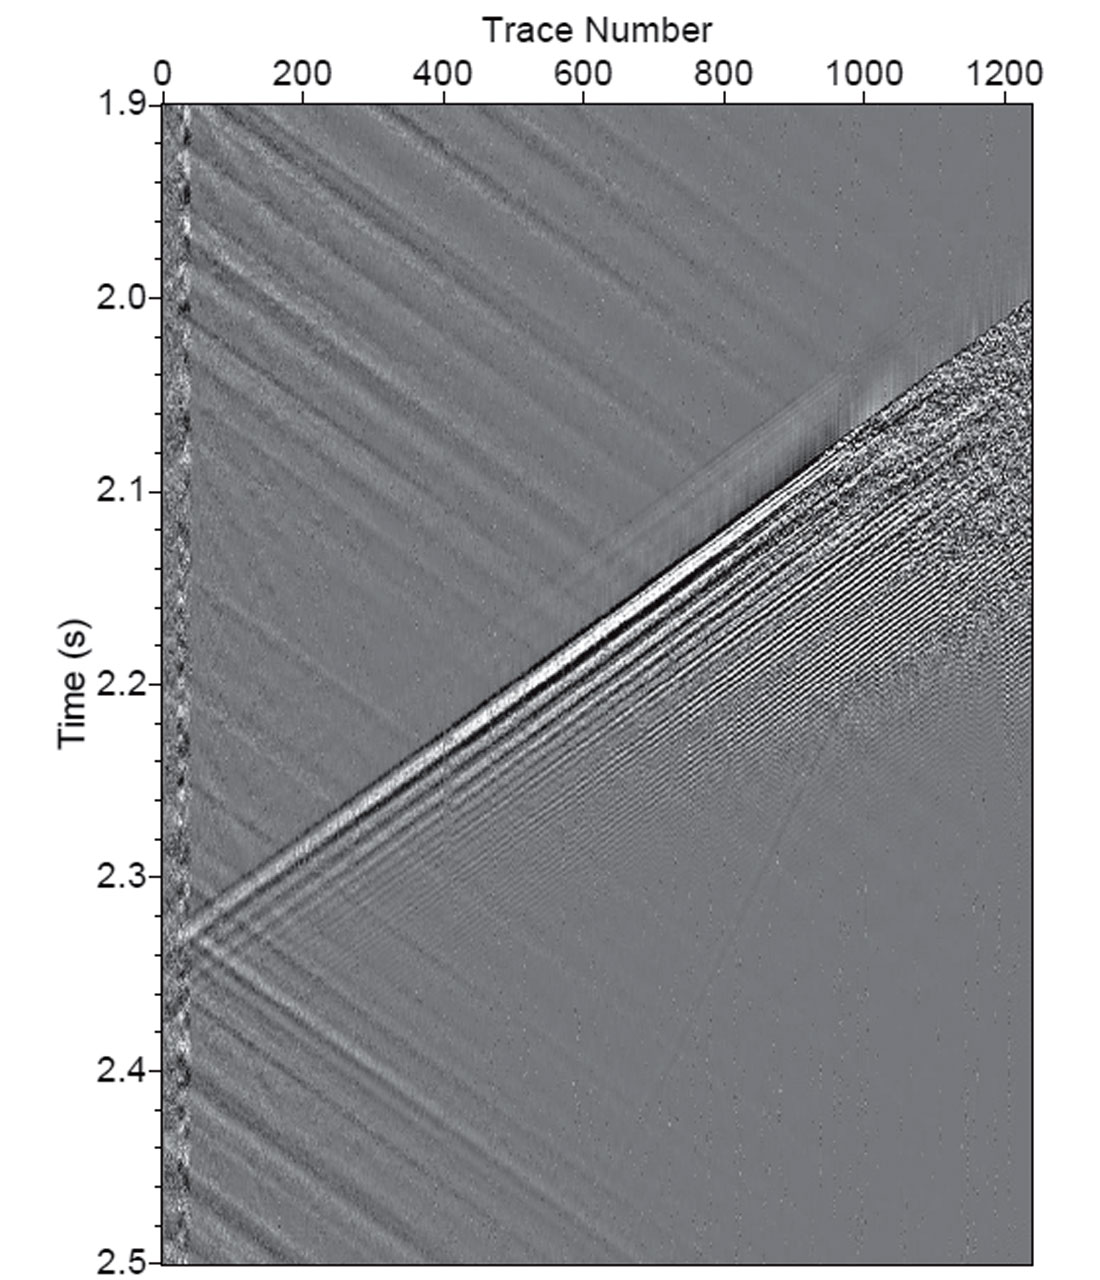
In 2011, the tool’s repeatability from shot to shot and its range in Tertiary sediments was tested in a well in Northern Houston. The sparker was lowered in one well and a toolstring with eight three-component geophones in another. The geophone string remained at a fixed depth and spanned a 350 ft interval. The sparker depth and its frequency setting were varied throughout the testing, and at each depth a sequence of one hundred shots was taken per frequency setting. It took about 15 minutes on average to acquire a hundred shots. The straightline distance between the sparker and the geophones varied from some tens of feet to about 4600 ft. Figures 7 and 8 show common receiver gathers for near and far offsets from one of the tests with the sparker set to a fundamental peak frequency of 50 Hz.
In fall of the same year, the wireline prototype sparker was taken to a deep well in a producing field in Oklahoma to simulate an RVSP situation with attenuating overburden (several thousand feet of red beds) and to expose the tool to higher temperatures and pressures. Two lines of geophones were laid out running E-W and N-S and crossing each other near the well head.
The sparker was fired at depths varying from 6,000 to 12,000 ft and with various frequency settings. The tool operated fine up to its temperature limits. However, the complex near surface geology together with surface noise from nearby producing wells prevented us from observing a convincing signal in the geophone data.
Further Lab and Field Tests
During the year 2012, the sparker prototype tool underwent a detailed check down to the component level. Specifications were verified and any component not complying with specs was replaced. In addition, the power supply was provided with an additional capacitor bank in order to store more electrical energy and to have greater flexibility in adjusting acoustic power to field needs. The upgraded version of the sparker tool was then tested in tanks in the laboratory. Shot repeatability, signal power and frequency content as well as radiation pattern were measured and results were as expected. We did find that the time between shots had an influence on the repeatability of the signal. Apparently, the fluid near the sparker electrodes needs a longer time than anticipated to return to its original equilibrium state. We found good repeatability with 10 seconds between individual shots. This is not surprising since the upgraded sparker has twice the electrical energy available and therefore a larger bubble and more heat is produced during the discharge process.
In the summer of 2013, the sparker was tested in a deep well near a salt dome in Mississippi. The original plan was to combine the sparker tool with a string of geophones (standard VSP tool) in order to have three-component recordings. Unfortunately, overcoming the technical and organizational challenges was not achievable within the time frame the well was available for testing. Instead, the data was recorded with an optical fiber inside the same wireline that was used for deploying the tool. One can think of this configuration sparker-fiber as a sonic tool with a low-frequency transmitter and a receiver section extending from the transmitter up the well to the earth’s surface.
The objectives of this test were then (1) to see what the response of the system sparker-fiber is with one or more casings, and (2) to test whether reflections from a nearby salt flank can be recorded. The second objective, single-well imaging, is somewhat hampered by the sensitivity of an optical fiber, which is maximal along its axis and minimal perpendicular to it. Thus, the near-offset sensing points of the optical fiber should see the salt flank reflection at low amplitudes while the far-offsets should see the reflection at increasing amplitudes.
Shots were taken at 200 ft intervals from 200 ft down to 10,200 ft where the temperature limit of the sparker tool was reached. At each level, five good shots were acquired at 10 s intervals and later stacked. Figure 9 shows a stack of five such shots taken at 4,000 ft. Analysis of the data was ongoing at the time of writing, and will be presented elsewhere.
Current Achievements and Outlook
- As discovered during laboratory testing and demonstrated in the field, low frequencies can be generated by an impulsive-type sparker source.
- The low-frequency acoustic signal obtained with our sparker system has been transmitted over distances up to 4600 ft.
- The power and frequency of our low-frequency sparker system can be adjusted as needed to meet varying demands of depth, rock properties, and other geological variables.
- Recycle time of the original sparker system between shots is much less than typical the recording times of 3-5 s. We found 5 s to be sufficient.
- We have not observed significant variation in arrival time and waveform signature from shot to shot.
- The upgraded version of the tool has a recycle time of about 10 s.
- Being able to concentrate the acoustic energy within the first two to three hundred Hertz, and the resulting increase in range, makes the current sparker a viable source for salt flank imaging and reverse VSP.
Presently, our efforts are directed towards analyzing the data from the field test in Mississippi and preparing for a potential field test in Canada whose objective is to measure the velocity between horizontal wells before and after hydraulic fracture treatment.
Our wireline prototype sparker tool is in a state that allows its commercialization. We envision the following applications for the tool:
- Cross Well Tomography (CWT)
- Single Well Imaging (SWI)
- Analysis of cement quality between multiple casings
- Reverse Vertical Seismic Profiling (RVSP)
- Drillstring Acoustic Sonde for Seismic While Drilling (SWD)

Acknowledgements
All authors would like to express their gratitude to Apache for their financial support and permission to publish and to Halliburton for their contribution to the wireline deployment system and for provi-ding access to their test wells. The last three authors gratefully acknowledge financial support from the U.S. Department of Energy’s National Energy Technology Laboratory. Special thanks go to the many contractors that manufactured components for the prototype tools, which all performed flawlessly.


Join the Conversation
Interested in starting, or contributing to a conversation about an article or issue of the RECORDER? Join our CSEG LinkedIn Group.
Share This Article