A comprehensive seismic project including conventional and multi-component surface seismic and borehole seismic was acquired in a producing field in northeast British Columbia, Canada. Delineating productive zones within the fractured shale reservoir was the primary goal of the seismic recorded in the project. The borehole seismic includes a conventional P-wave 3D VSP which was expected to provide useful images, and provide borehole calibration information for accurate processing of the surface seismic data.
This article covers some unique solutions to common problems in land 3D VSP processing. These problems needed to be solved before the basic goal of providing high resolution images could be met. This 3D VSP data set offered us the opportunity to make in-situ measurements of velocity, anisotropy and Q. Some of the most important multiple generators in the field were identified, and a de-multiple technique for VSP images was developed. We then looked at determining fracture orientation information from this same data set. The results from a feasibility study of elastic Full Waveform Inversion (eFWI) using data from this 3D VSP are also shown in this article. eFWI plays an important part in the future of borehole seismic, as it allows us to extract the most important medium properties directly from the unprocessed vector data recordings.
3D VSP background
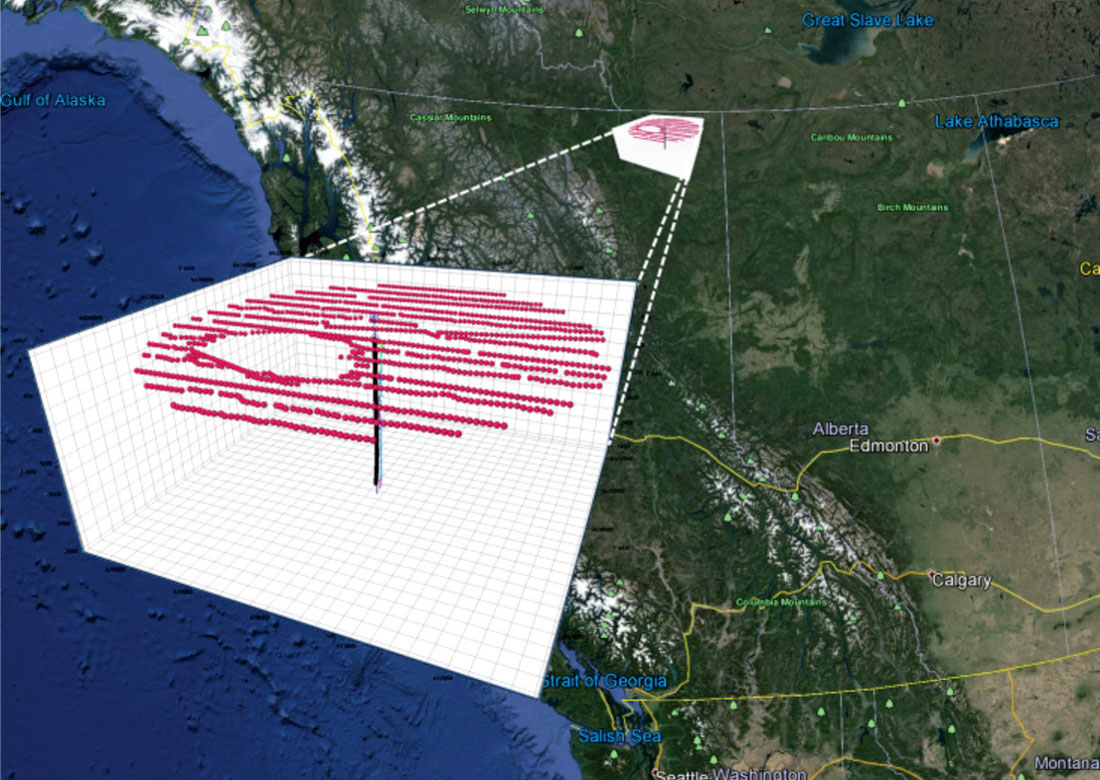
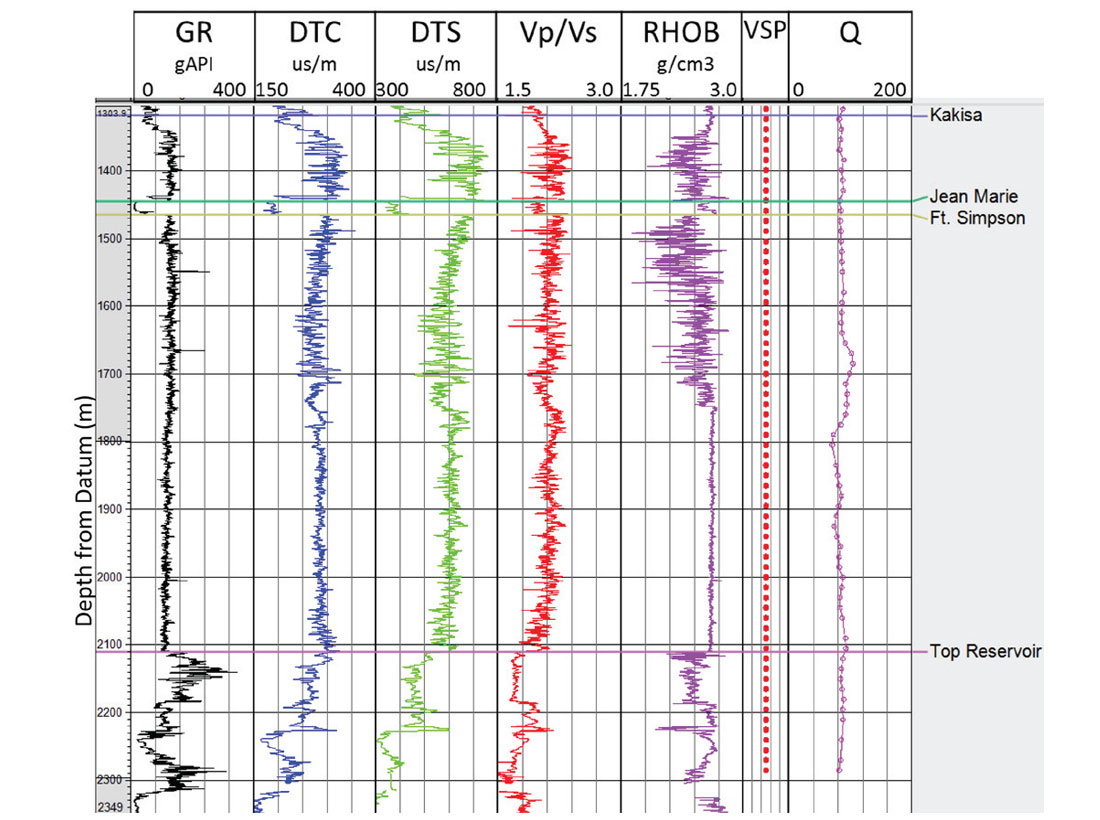
The 3D VSP dataset was acquired for Nexen Energy ULC. in Northeast British Columbia, Canada (Figure 1). The 3D VSP was acquired simultaneously with the conventional surface seismic program. Vibrator sources from the surface seismic survey which were within 2500 m from the wellhead were used for the 3D VSP analysis. The three-component down-hole receiver array had 135 depth levels extending from below the top reservoir to surface (Figure 2).
Processing and imaging
Prior to processing the downhole data using a VSP processing flow, noise attenuation and amplitude compensation methods used in surface seismic processing were adapted for application to the VSP data. Anomalous Amplitude Attenuation (AAA) is commonly used as a surface seismic noise reduction technique. AAA aims to attenuate random noise by transforming the processing gather into the frequency domain and applying a spatial median filter. Frequency bands that deviate from the median amplitude by a specified threshold are either zeroed, or replaced by good frequency bands interpolated from neighboring traces. By using AAA, the high amplitude noise was suppressed from the raw VSP data with minimal loss of signal.
With land data, due to variability of the near-surface conditions and inconsistent coupling of the vibroseis source, it is typical to observe a rather random scatter in the recorded amplitudes versus offset. Surface Consistent Amplitude Compensation (SCAC) compensates for this amplitude variation from shot to shot. SCAC is commonly used in land surface seismic processing and compensates for shot, detector and offset amplitude variations that are caused by acquisition effects and are not a consequence of the subsurface geology. For this land 3D VSP, SCAC was used by applying the compensation along the offset and shot axis (Figure 3).
To generate upgoing waves as input to migration, traditional median filtering enhanced and removed downgoing waves from the vertical channel wavefields. To maximize the offsets used in the p-wave migration, shear noise was reduced using a Radon filter prior to deconvolution. An inverse Q filter was also applied prior to deconvolution.
Q is commonly estimated from the downgoing arrivals of the borehole data. This data set allows us to estimate Q, using a spectral ratio technique, from the near surface to the reservoir. A log of effective Q was determined by setting a shallow receiver as reference and calculating Q between the reference and all other trace spectra. Q values from one near shot are plotted in Figure 2. An average Q value of 100 was estimated from several near offset sources, and applied as an inverse filter. The data were deconvolved using standard up-by-down deterministic VSP deconvolution.
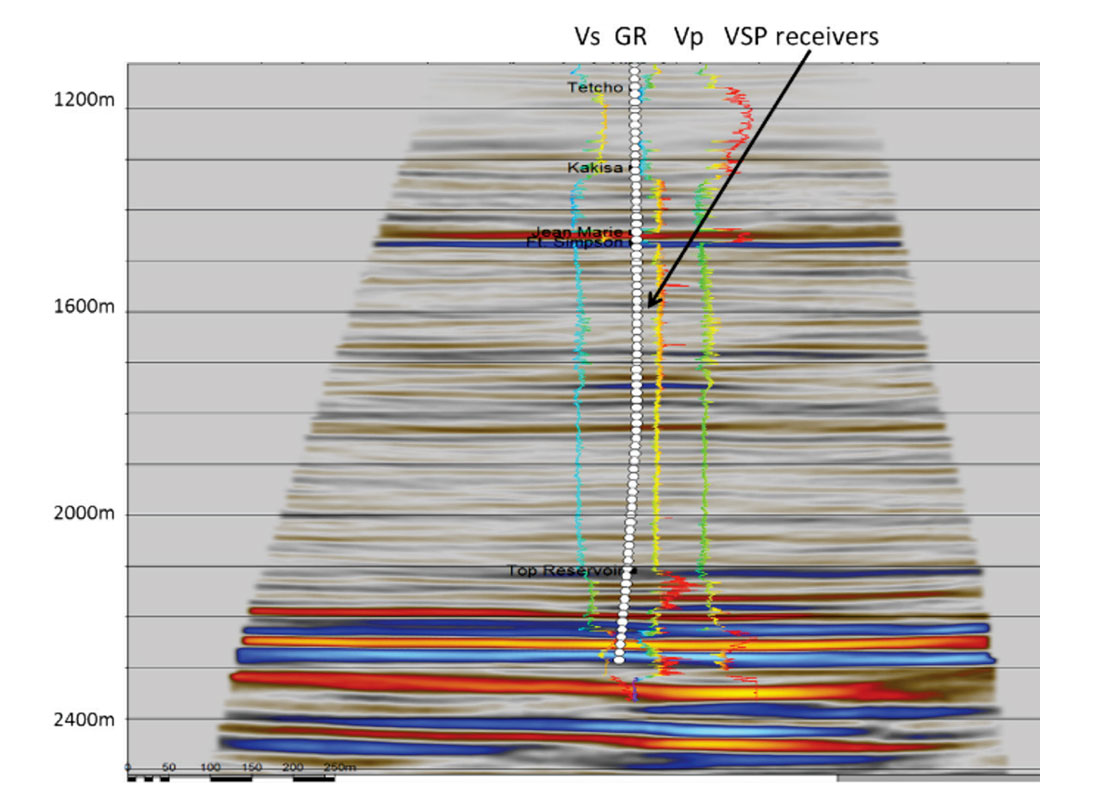
The deconvolved upgoing waves were migrated using GRT (Miller et al., 1987) migration. Figure 4 shows a 2D slice extracted from a 3D volume centered on the wellhead. In the same figure, Vs from the dipole shear log, density and Vp from compressional sonic logs are plotted on top of the image. The reservoir shale does appear to generate an interpretable reflection on these Pp images at about 2,100m depth. More work is currently being done on a quantitative interpretation of the images.
Anisotropy
This 3D VSP dataset has a geometry ideal for the estimation of anisotropic parameters. We have receivers in situ, from the reservoir level to the near surface. The surface seismic imaging project could benefit from a more accurate estimate of anisotropy, or at least a calibration of the anisotropy being used in the NMO correction and imaging steps. Estimation of VTI anisotropy is an integral part of the imaging model calibration.
For the depth imaging of our 3D VSP, an initial v(z) profile at the well location was generated from the sonic logs. The picked direct 3D VSP travel times were iteratively fit by perturbing interval anisotropy parameters and velocities to determine best-fit anisotropy. The resulting VTI model is shown in Figure 5. In this case, the gamma VTI measurement of shear anisotropy from sonic measurements, together with 1/Vp and a compaction law constraint were used to constrain the magnitude of anisotropy in the inversion. Using these constraints, a depth-variable anisotropy model was created.
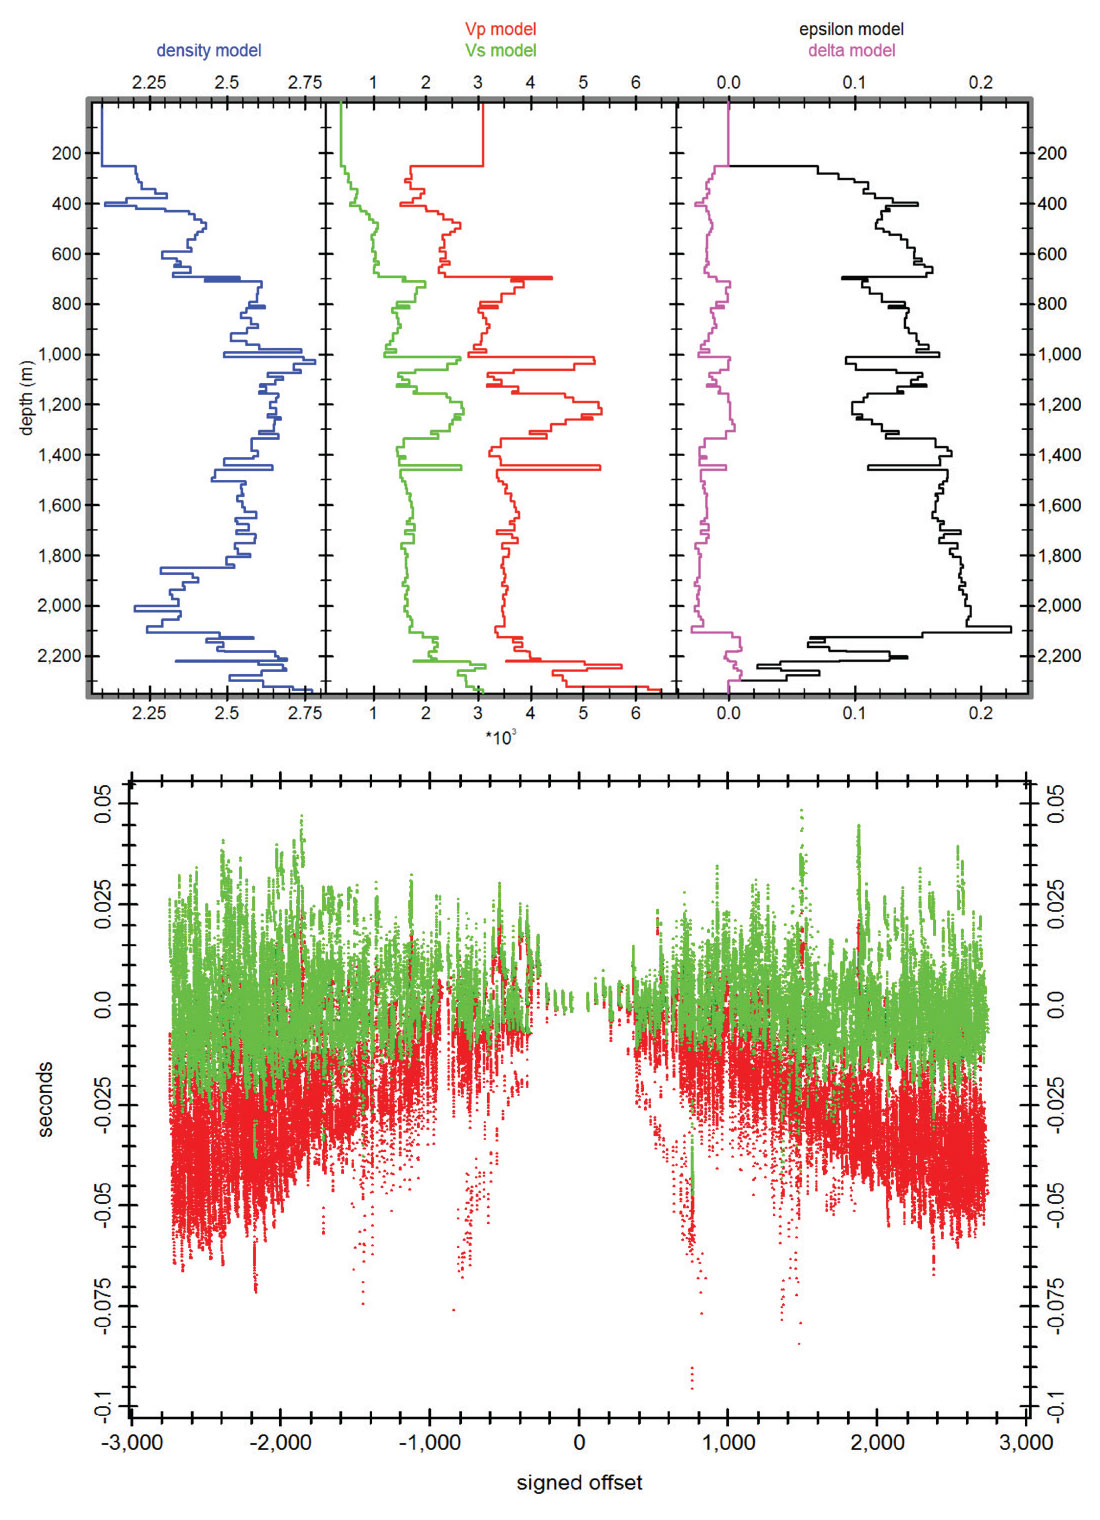
The velocity model must explain both the surface seismic and borehole seismic data. To confirm that the model explains the borehole data, we ray-traced direct arrivals through the VTI model, and compared the modeled arrival times with the observed direct arrival times. The residual time should be near zero for a perfect model. Figure 5 shows the residual times in red for an isotropic version of the model, and green for the VTI model. Residuals are small and centered on zero for the VTI model.
Multiples
VSP deconvolution is typically used for zero phasing the data and in the attenuation and identification of multiple energy. In this survey, a shot near the wellhead is the equivalent to a standard Zero-offset VSP (ZVSP). Inside and outside corridor stacks of the deconvolved ZVSP data can be used to indentify interbed (or internal) multiples and their generators (Lines and Burton, 1996). The outside corridor stack should be multiple free along the receiver array and the inside corridor stack should contain both interbed multiples and primaries. The blue-shaded area on the deconvolved upgoing from a near offset shot shown in Figure 6 defines the data that went into the inside corridor stack. The pink-shaded area shows the data that went into the outside corridor stack. An interbed multiple can be clearly seen on the inside corridor stack between 1.3s and 1.4s. In depth, this is very close to the top of the reservoir at about 2100m. The multiple is observed to be interfering with the target reflection. The inside corridor can be targeted to examine multiples generated by high reflectivity interfaces.
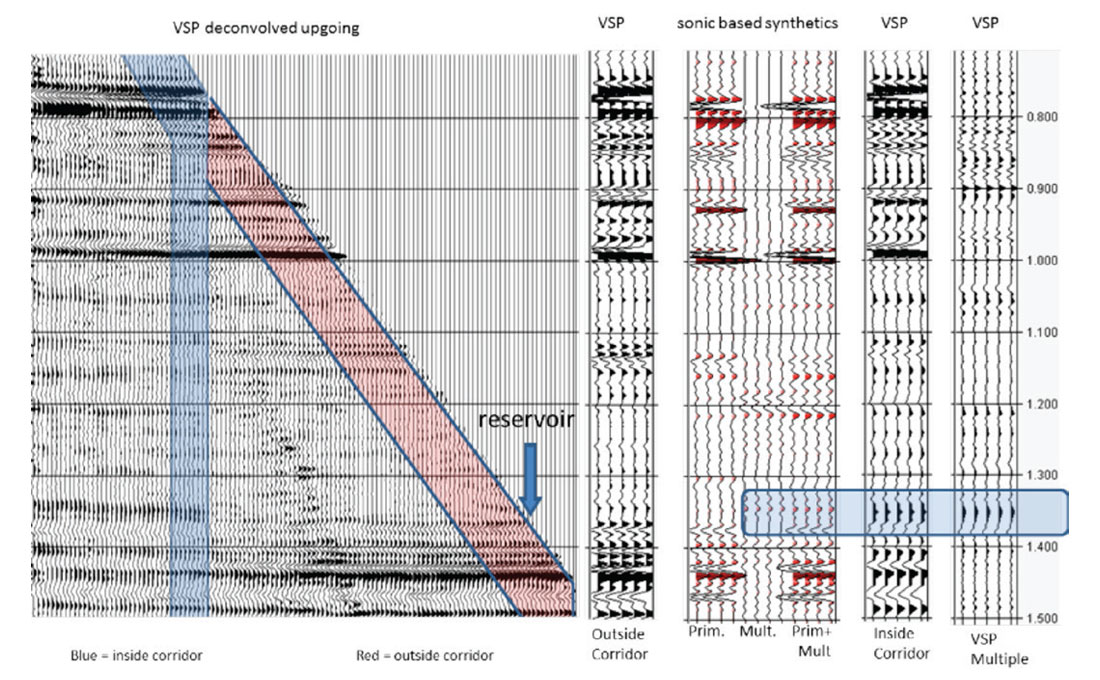
The interbed, or pegleg, multiples were generated from the reflectivity estimated from the compressional sonic log. This is an excellent tool for locating multiples in seismic sections. These synthetics were used confirm the multiples detected by our inside/outside corridor stack methodology. Our multiple of interest was confirmed on the multiple only synthetic, and the primary plus multiple synthetic.
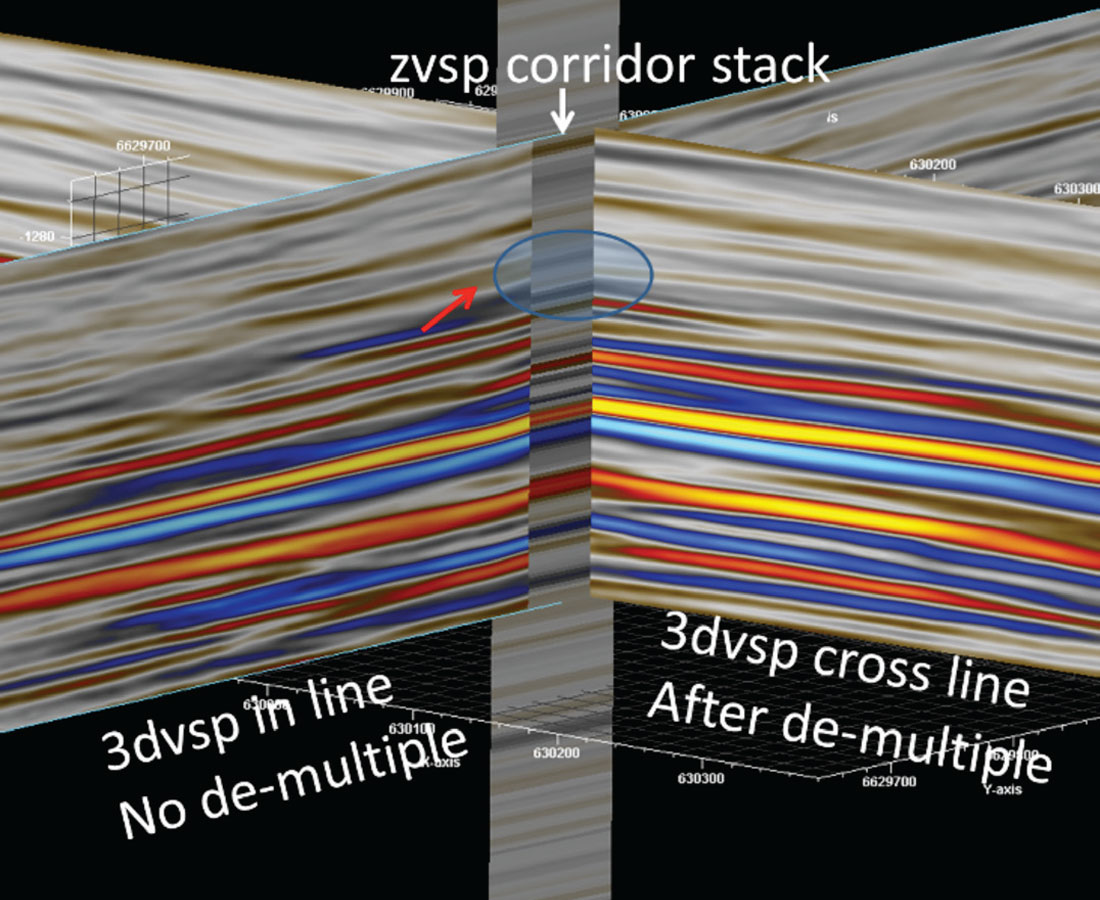
From the inside and outside corridor stacks, we used adaptive subtraction to estimate an interbed multiple model for this 3D VSP. The multiple model is the right-most stack in Figure 6. After estimating the interbed multiple model, and using a 1D assumption, the multiples were adaptively subtracted from the 3D VSP image cube. The initial results of this methodology demonstrate the promise of the technique (Figure 7) in attenuating the interbed multiple interfering with the top reservoir.
Fracture Orientation from Shear Waves
The downgoing mode-converted shear waves recorded in a walkaround VSP can be informative on fracture or stress orientation. This technique requires a circle of constant offset sources, with the horizontal channels oriented to the radial and transverse directions. Downgoing mode-converted shear waves recorded on a walkaround VSP will split upon encountering a zone of fractured rock. As described by Horne (2003), the presence of energy on the transverse channel as the source moves in a circle around the well is a good indicator of the shear splitting caused by azimuthal anisotropy. There are certain azimuths where the energy on the transverse channel dims as the source moves around the well. These azimuths correspond to vertical symmetry planes aligned with the fracture plane and fracture normal directions
From the full 3D VSP data set, a circle of sources was extracted for the walkaround analysis. An optimal offset distance where mode conversions were consistently generated was chosen. On the radial channel data we observed a strong downgoing shear wave passing through our zone of interest. This shear wave was analyzed on both the radial and transverse channels for evidence of splitting as it propagated past the receivers. Ideally, the shear wave being analyzed should have it’s origin close to the zone of interest, to avoid the possibility of multiple shear splittings.
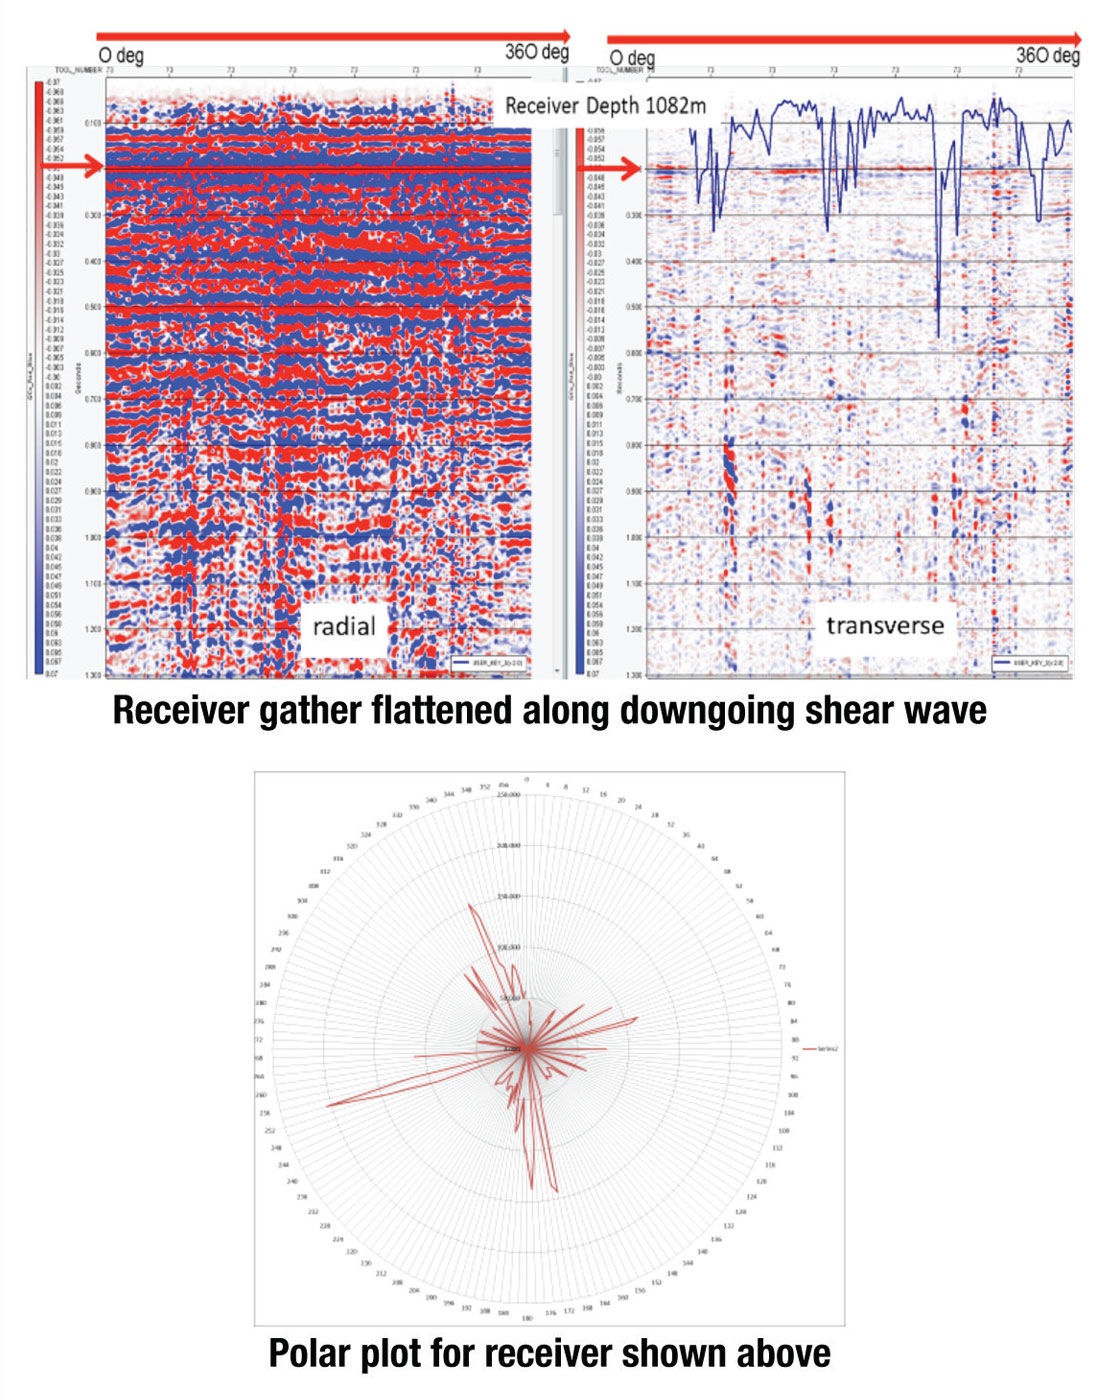
The Root Mean Square (RMS) amplitude of the downgoing shear was estimated on both the radial and transverse channels, in a window around the downgoing mode converted shear wave. The R/T ratio should go to a maximum where the transverse channel is dimmest. Figure 8 shows clear dimming and brightening in the amplitudes on the transverse channel, every 90 degrees for the receiver shown. The dimmings and brightenings on the transverse channel show up as maxima and minima on the R/T graph plotted on top of the transverse channel data. The R/T ratio numbers are very large, indicating the effect we are looking at is very weak, but is still measurable. The maxima on the R/T polar plot indicate the symmetry axis orientation directions. Where the horizontal data were good quality, there was a fairly consistent trend of maxima in the R/T ratio, approximately in the east-west (70 to 80 degrees azimuth), and north-south azimuths.
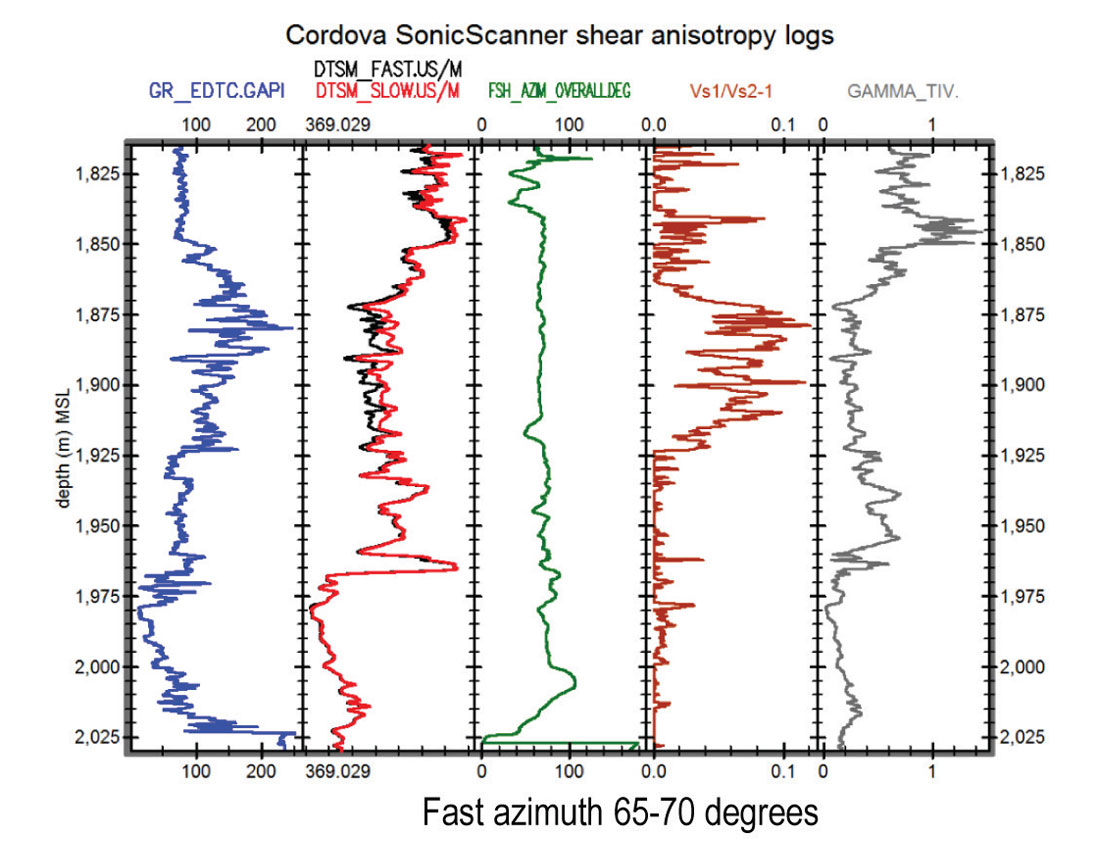
Figure 9 shows sonic shear anisotropy results over the bottom section of the well. The fast shear azimuth is seen to be consistent and close to what is seen (N70E) in the converted shear R/T analysis. Also shown in Figure 9 is the sonic “gamma_tiv” curve, which is the horizontally polarized shear (Sh) VTI anisotropy number, and since it is significant it is of interest to consider an orthotropic reservoir model. Gamma is seen to be lower but positive where HTI is large and higher above and below. Thus a VTI/orthorhombic/VTI layering is suggested.
Elastic Full Waveform Inversion
Even more valuable than the high resolution images provided by this 3D VSP would be a direct estimation of the medium parameters Vp, Vs, density, epsilon and delta in a volume around the well. The recent developments in elastic Full Waveform Inversion (eFWI) detailed in Podgornova et al, 2014, make this possible. The method is currently 2.5D, uses the vertical channel and the in-line horizontal channel, and is fully anisotropic. EFWI as described here uses elastic wave equations in anisotropic VTI media to model the wave propagation. Five parameters are inverted: compressional velocity, ratio of the compressional and shear velocities, density, and the Thomsen anisotropic parameters epsilon and delta.
The inversion minimizes the misfit between the modeled data and the real data by updating the model’s medium parameters. The starting model is the borehole calibrated VTI model generated from the well data. The modeled data are saved as synthetic seismograms. The FWI algorithm performs a simultaneous inversion for medium parameters and the source wavelet. Inverting for the source wavelet is a critical component of FWI with land data due to the variability in surface conditions.
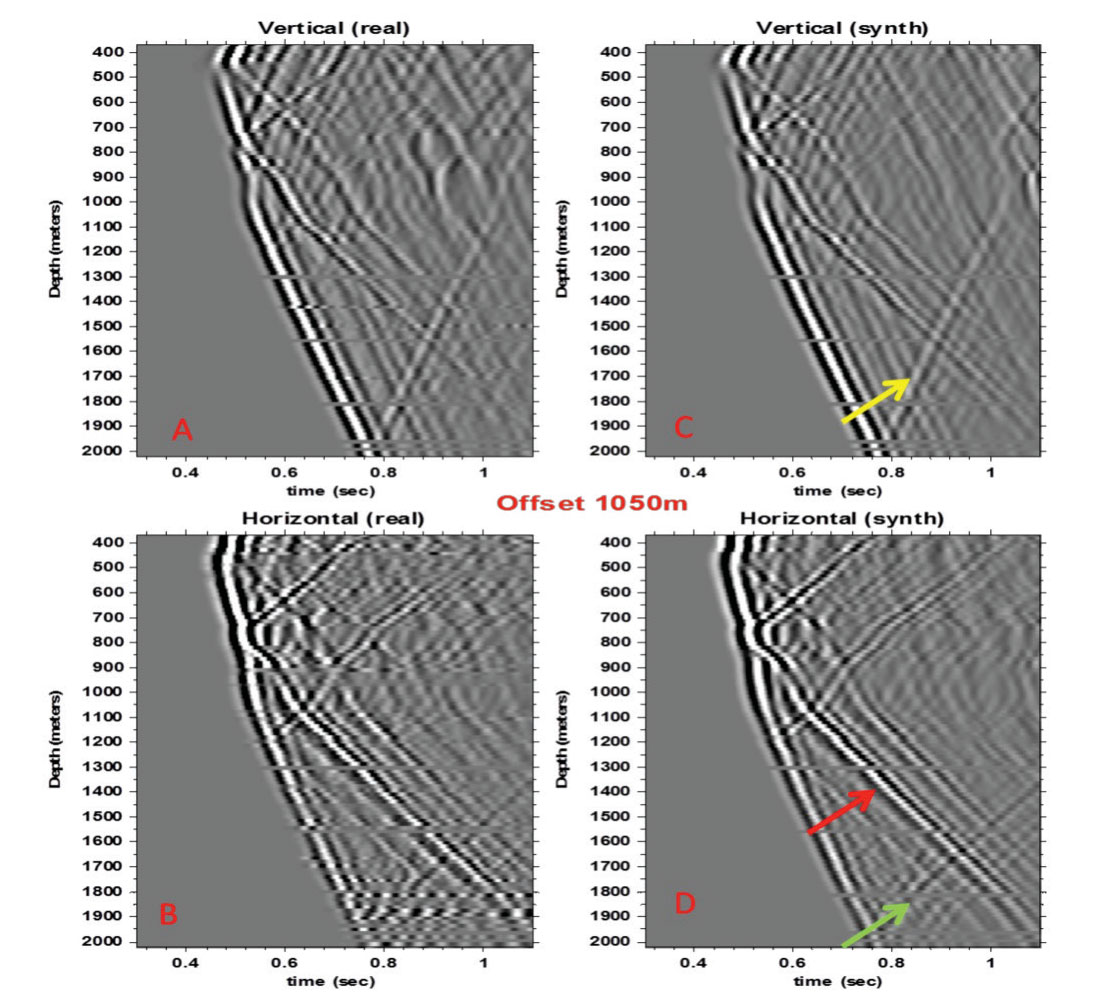
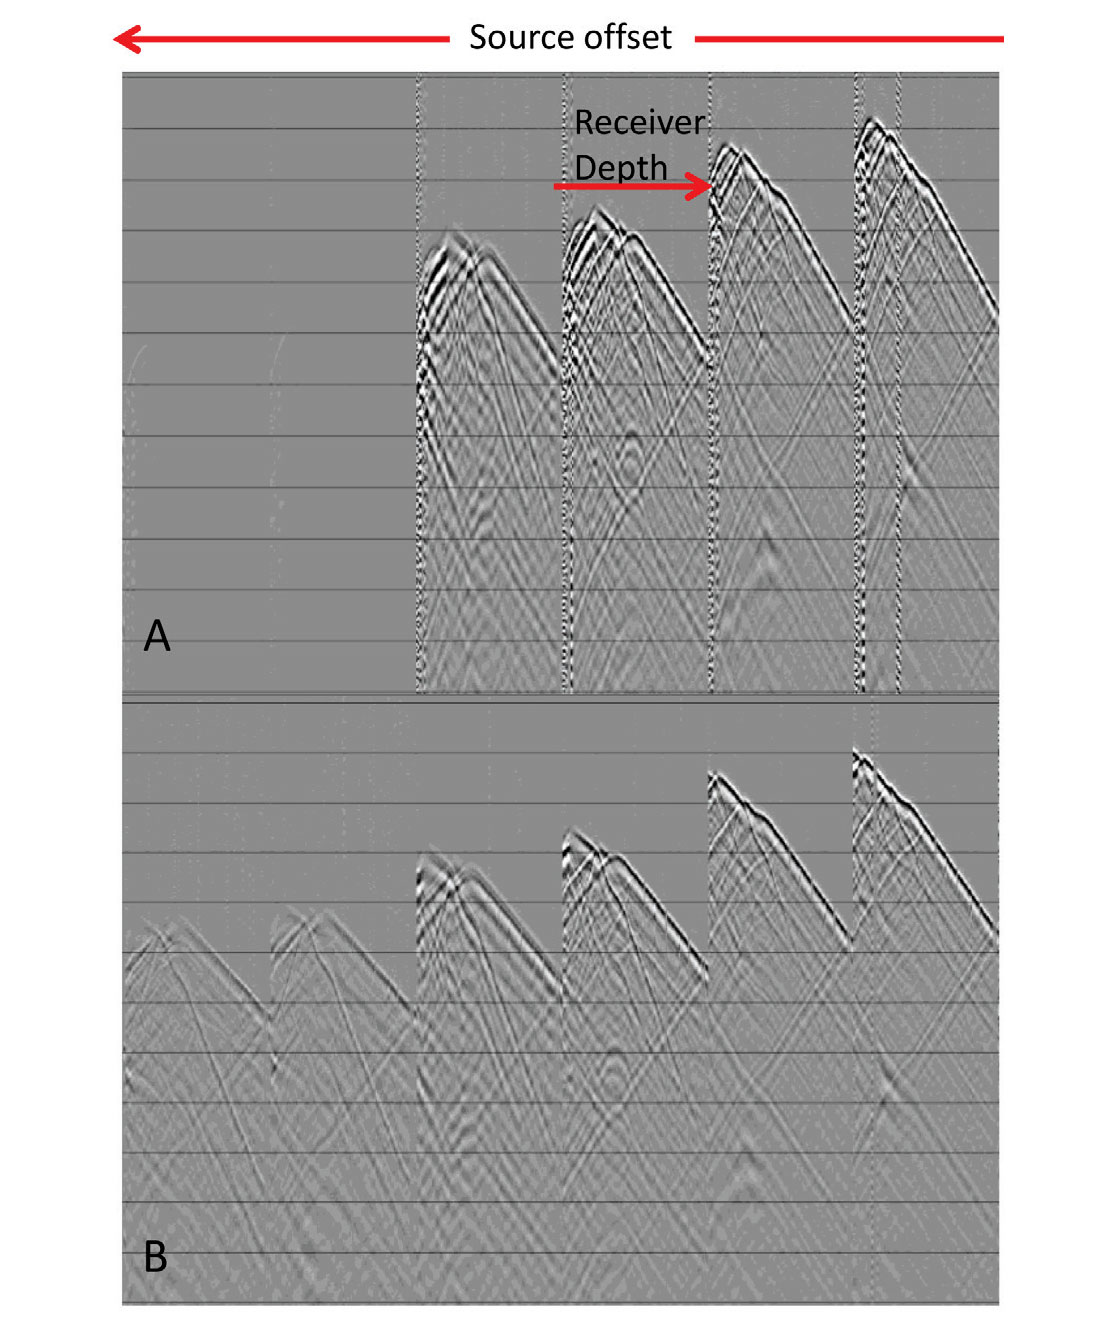
The inversion was run on an extracted 2D line of sources using frequencies up to 40 Hz. The starting model was generated from a smoothed version of the model shown in Figure 5. Synthetic seismograms generated in the inversion are compared to the input data in Figure 10. The input data vertical (A in Figure 10) and horizontal traces (B) for a medium offset shot compare extremely well to the modeled data (C and D) after 150 iterations of inversion. There are complex wavefields in these recordings which are well recovered in the modeled data. Strong upgoing and downgoing mode conversions are evident in the input data, and are accurately reproduced in the synthetic data. This gives us confidence in the medium parameters recovered by the inversion.
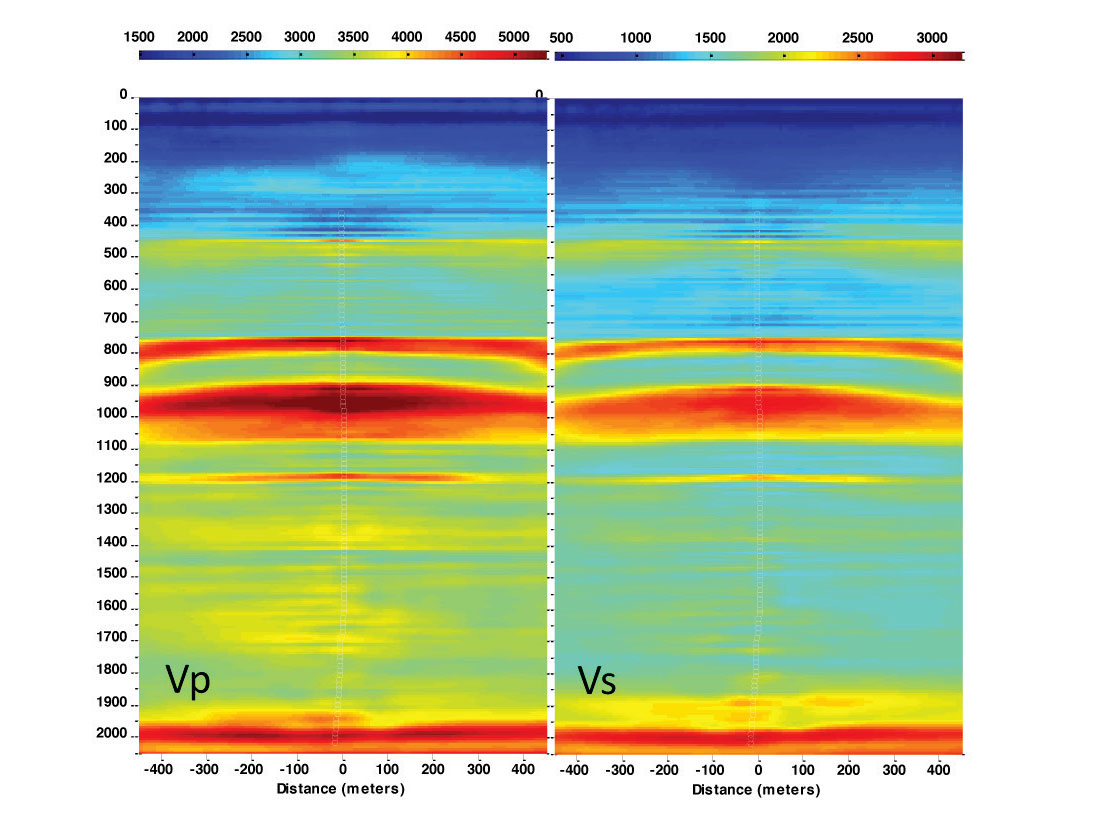
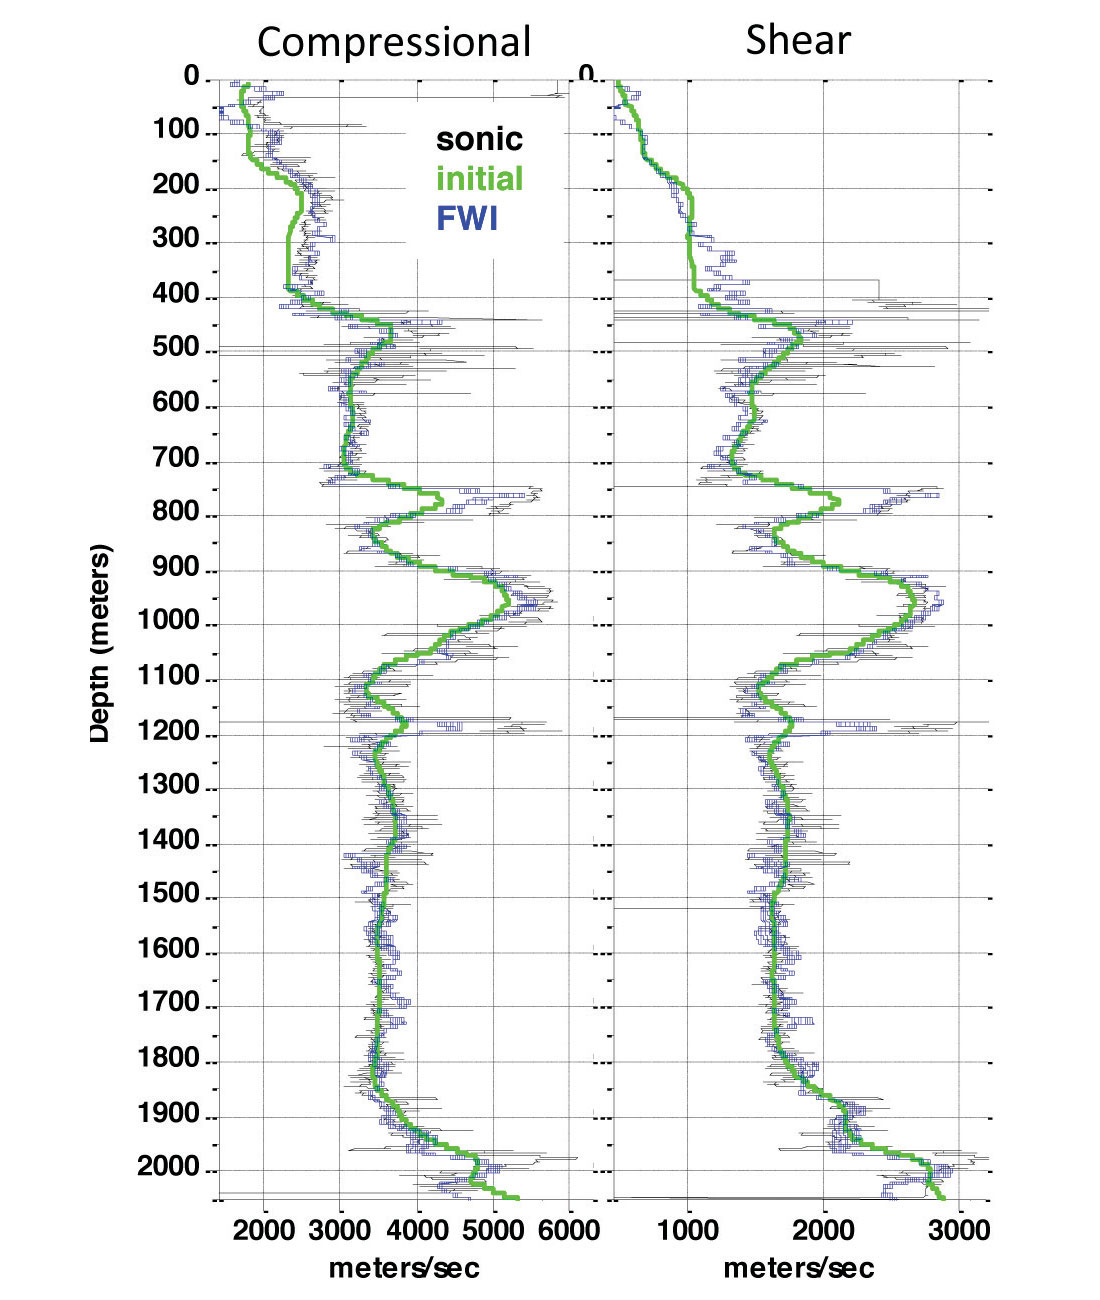
The eFWI updated the initial model and recovered reasonable layered Vp and Vs structures (shown in Figure 11) and similar results for epsilon and delta anisotropy parameters (not shown). In Figure 12, all the high-contrast and many small-contrast layers seen in the Vp and Vs sections agree with the sonic data with respect to the frequency content of the data used in the inversion.
The eFWI results from this feasibility study prove the viability of the method in land 3D VSPs (or walkaway VSPs). We were able to estimate the elastic parameters of the medium directly from the unprocessed vector data without the need for more complicated imaging/inversion workflows. While the method is currently essentially 2D, work is underway to progress to 3D eFWI.
Conclusions
To create high resolution images from this land 3D VSP, land-specific algorithms such as AAA and SCAC were used to properly pre-process the data. Q compensation was incorporated in the pre-processing. The imaging model needed to include strong anisotropy, an important learning from this project.
3D VSPs offer more than high resolution images. VTI parameters were estimated for depth imaging of the 3D VSP. These parameters are also useful for surface seismic imaging. HTI parameters were estimated from shear splitting observed on the downgoing mode-converted shear waves and from sonic measurements. Both measurements were consistent with an ENE fast azimuth. To attenuate interbed multiples, the traditional method of inside-outside corridor stacks was used to first identify interbed multiples. Then a newly implemented adaptive methodology was used to attenuate the interbed multiples in the image volumes.
The data from this 3D VSP were used in a very successful feasibility study for eFWI. The velocity and anisotropy structure in a 2D section through the well were accurately recovered. We believe eFWI is going to be a key component to the future of borehole seismic as it allows direct computation of the key medium parameters from the unprocessed vector data. eFWI should be seen as an enabling technology which will in the future extend the usefulness of borehole seismic data into areas such as effective stress estimation and pore pressure prediction.

Acknowledgements
We gratefully acknowledge Nexen Energy ULC for permission to publish this work. We also acknowledge Marwan Charara and the eFWI developers at Schlumberger Moscow Research Center.


Join the Conversation
Interested in starting, or contributing to a conversation about an article or issue of the RECORDER? Join our CSEG LinkedIn Group.
Share This Article