If you sit at a seashore, you see sand and waves and ocean and sky …..or, do you see sand and dune and cliff and rocks and trees and sky? Well, obviously, which way you face governs what you see (unless you have eyes in the back of your head). The trajectory of your vision governs the “answer” you get.
Where you sit governs what you see.
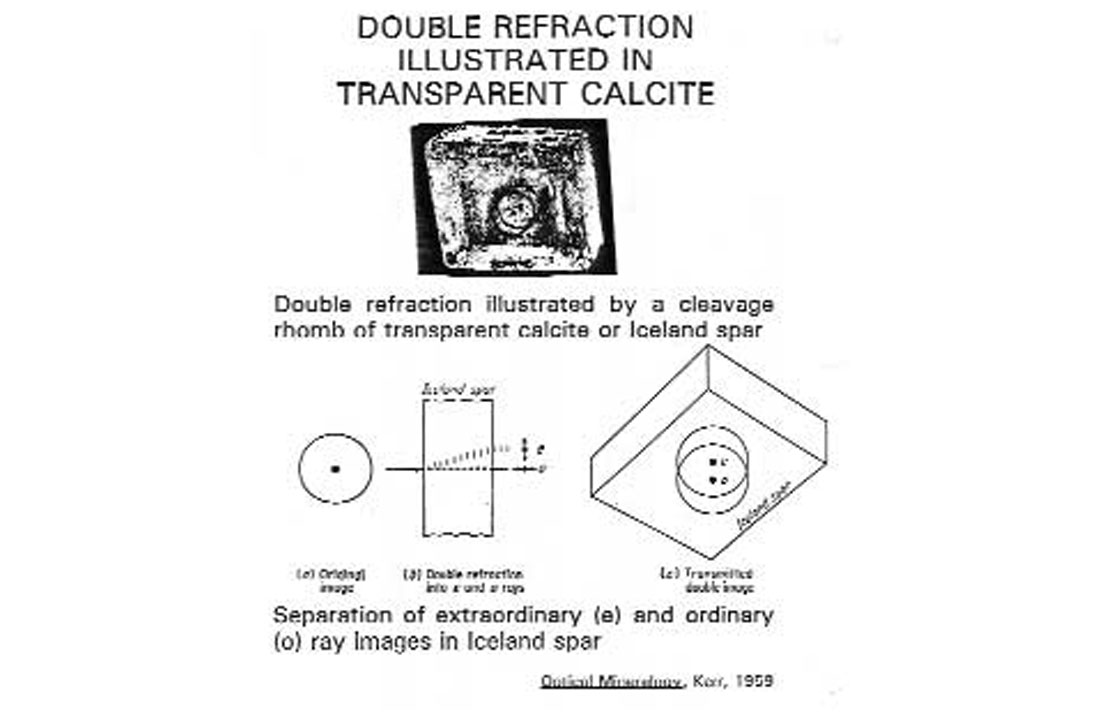
If you look at a dot in a circle through transparent calcite (see below), two images are visible. Calcite is optically birefringent and the light ray splits into two rays, the ordinary ray with refractive index 1.658 and the extraordinary ray of refractive index 1.516. The polarization of these two light rays differs by 90 degrees. The refractive index is equal to the ratio of the velocities (air/medium). If the images are viewed with a polarizing filter between your eyes and this Iceland spar crystal (optically bi-refringent calcite), one image will be seen through the crystal when the polarizing lens is aligned with an optic axis. However, if the polarizing filter is oriented so that it is not aligned with an optic axis, you will see two images through the crystal (Figure 1).
This concept helps illustrate shear-wave splitting in a birefringent earth — earth’s sedimentary layers are birefringent to shear waves when vertical aligned fractures and/or unequal horizontal stresses are present. (We need to think about what happens when the three stress axes get tipped, by the way...) P-wave reflections are affected by the birefringent properties of rocks, when shear-wave splitting is present, because the P-wave AVO gradient is governed by which of the two shear waves is present in the coupled “P-SV” system. The azimuthal variation in the P-wave AVO gradient arises from the two different shear-wave velocities present (fast in one azimuth and slow in the other azimuth). The azimuthal variation in the P-wave velocity at the far offsets also affects the AVO gradient. The vertical aligned fractures and/or the unequal horizontal stresses take an incident S-wave polarized at an arbitrary angle and split it into two shear waves: a fast shear wave polarized parallel to the fractures and a slow shear wave polarized perpendicular to the fractures. A shear wave has particle motion perpendicular to the ray direction, unlike the P-wave, which has particle motion parallel to ray direction…but back to calcite.
The question, Do you see one image or two? (please note key word “see”) directed at various viewers will elicit various answers…one…two…one….two….one….two…. as the polarizing lens is rotated. The question has two answers because the answer depends upon where the viewer sits and what he/she looks through. Those who don’t look through the calcite will see one image (the original). Those who do look through the calcite will see two images. Those who do look through a polarizing lens aligned with the optical axis of the calcite will see one image. Those who look through a polarizing filter not aligned with the optical axis will see two images. When I report (accuracy is assumed) what I experience, others learn where I sat and what I looked through; they do not learn about the independent nature of the observed event. The question “How many dots are there?” is a very poorly phrased question.
Philosophic question here:
Is this (learning the independent nature of the event) even possible? If one wants to learn of the independent nature of the observed event, one must go for one’s self and experience first hand that which is desired to be “observed” or experienced. Then one can, if asked, offer descriptions of one’s own experience.
Back to scientific point:
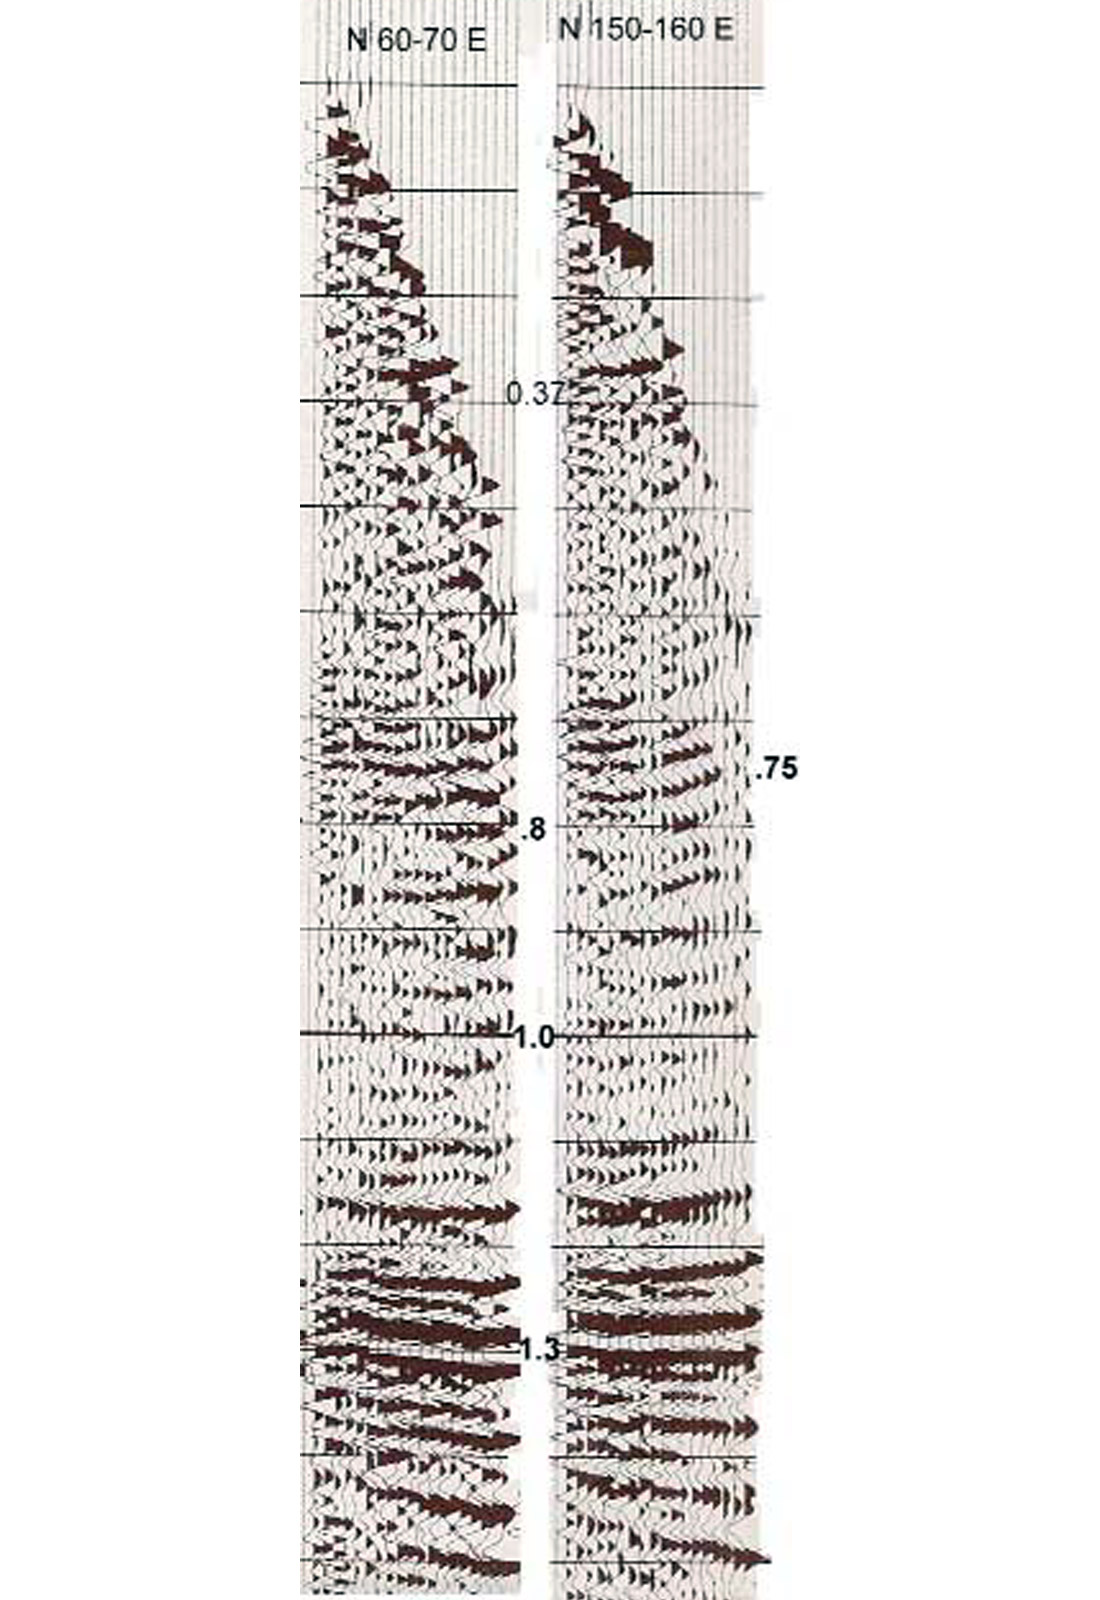
If 3D P-wave reflection seismic data are recorded (after they pass through sedimentary rocks which could contain hydrocarbons) and the source-receiver trajectories are parallel to the maximum horizontal stress (and/or aligned vertical fractures), one (not the) description of the earth is obtained. This description contains information only about the lithologies of the rocks and the matrix porosities (and no information about the set of vertical aligned fractures parallel/subparallel to the maximum horizontal stress). Figure 2 shows two limited-azimuth PP CDP gathers (N60- 70E and N150-160E) with offsets from 250 ft to 9250 ft (500-ft offset binning) after final statics application and the same NMO function, approximately correct for both, have been applied. The data come from a U.S. Department of Energy project to demonstrate the effect of gas-filled fractures on PP reflection data (Rulison Field). The gas-saturated MesaVerde sequence between ~1.0 to ~1.2 is the zone of interest. Similar azimuthal variations were observed in PP reflection data at Bluebell-Altamont (Utah) and in Wyoming (Wind River Basin) but today we’re keeping it simple. If seismic data are recorded in the same location at the same time with the same geophones and the same sources but with the source-receiver raypaths perpendicular to the maximum horizontal stress and/or fractures, a different answer (picture, set of observations) emerges. This second description contains information both about the lithologies and matrix porosities and the fracture densities and fracture fills.
Obviously, each limited-azimuth seismic response contains the information about the stress field and the fractures that the seismic wave experienced.
Travel times are measurably and meaningfully different, with the azimuthal differences greater on the far offsets than on the near offsets; and the amplitudes are measurably and meaningfully different, with the azimuthal differences greater on the far offsets than on the near offsets.
At 0.37 sec, look at the difference in the S/N of that reflector. The azimuthal difference in S/N is not noise but signal. Please don’t let it escape your notice that N155E is often “clean good” data, while N65E appears scattered, noisy, and “different”. That’s signal; not noise.
The minimal travel times on the N155E gather indicate the fast direction, interpreted as parallel to the maximum horizontal stress and/or the vertical aligned open fractures. The greater travel times on the N65E gather indicate the slow direction. Remember, the same NMO has been applied to both gathers.
At 0.8 sec, look at the difference in far offset amplitude. (An azimuthal difference is also present in coherence, and the frequency content and other properties, but today, let’s just stick with the simple concepts. If you’re bored with these basics, have at coherence and frequency!) The higher-order NMO terms that involve delta and epsilon also clearly vary by azimuth in these plots, as well…with today’s technology, not the technology of the mid 1990s when this plot was made, we would dual scan for NMO and eta. The NMO and eta would be different by azimuth, and this allows us to calculate a set of (delta, epsilon) pairs that go with a given eta. I suggest that this approach is worthwhile. The simple point here is that the seismic wave observed after propagation through an anisotropic medium depends upon the direction the seismic wave traveled. These two seismic experiments record different answers.
This particular supergather is located at a well assigned a lower-end EUR (~1 bcf). So, the fingerprinting of the azimuthal signature associated with greater production is more than just “find the difference by azimuth”.
Look at the difference at 1.3 s in travel times. Is one true and one false? No.
Are they both true? Yes.
Are they different? Yes. (“Do you think I’m blind?” indignantly responds the reader!)
Two “different” answers can both be true because the earth is anisotropic. An-isotropic. Not isotropic. Isotropy means the same value of a measurement is obtained regardless of the direction in which the measurement is taken. Homogeneous versus heterogeneous depends upon the scale length of your measuring stick—i.e., the wavelength. Ordered heterogeneity smaller than the wavelength gives rise to anisotropy.
If two different answers are both true, do some say this feels like a paradox? Yes.
And No.
Is this the way things are? Yes.
Can you cope with this? I sure hope so because if you can’t, there’s a whole set of geophysical jobs for which no one will hire you.
Does light behave like a wave? Yes. Does light behave like a ray? Yes. How can two different concepts both be true at the same time? Is this a paradox? Yes. It is the way things are. Two different things can be true at the same time.
In the next article, I offer the idea how Aristotelian logic (trying to cope with the world by categorizing “A” versus “Not A”) is emphatically inadequate for the geophysical purposes at hand, as well as for general living in this world. Where you sit governs what you see. Until you figure out a way to sit everywhere all at once, your vision and understanding are going to be limited. A limited dataset gives rise to a limited understanding. A limited understanding has more risk in being wrong than the understanding that arises from looking at everything all together.
The paradoxical nature of truth is obviously at hand. Our experience of how paradoxical our “solid” earth is immediately makes us aware of how paradoxical “reality” is.


Join the Conversation
Interested in starting, or contributing to a conversation about an article or issue of the RECORDER? Join our CSEG LinkedIn Group.
Share This Article