Introduction
The Wembley Halfway B Pool is situated 20 km northwest of Grande Prairie, Alberta and was discovered in 1978. This Middle Triassic pool contains an oil leg with 23 x 106m3 inplace (145 MM barrels-in-place) and an associated gas cap with 5.7 x 10⁹m3 in-place (204 bcf-in-place). The Halfway B Pool has produced for 14 years under primary depletion until PanCanadian implemented the first waterflood project over a portion of the oil leg in 1993. Since then, a number of waterflood projects and infill drilling programs have been selectively implemented over portions of the leg.
We will show how 3-D visualization has assisted in the waterflood project design by enabling cooperation between both the geological and geophysical datasets acquired in the study area.
Geology
The geometrically complex Halfway B Pool was deposited as a tidally-dominated regressive barrier island system. A depositional model of the Halfway B Pool is shown in Fig. 1. The barrier island shoreface and the tidal inlet fill sequence are two facies associations that characterize the reservoir.
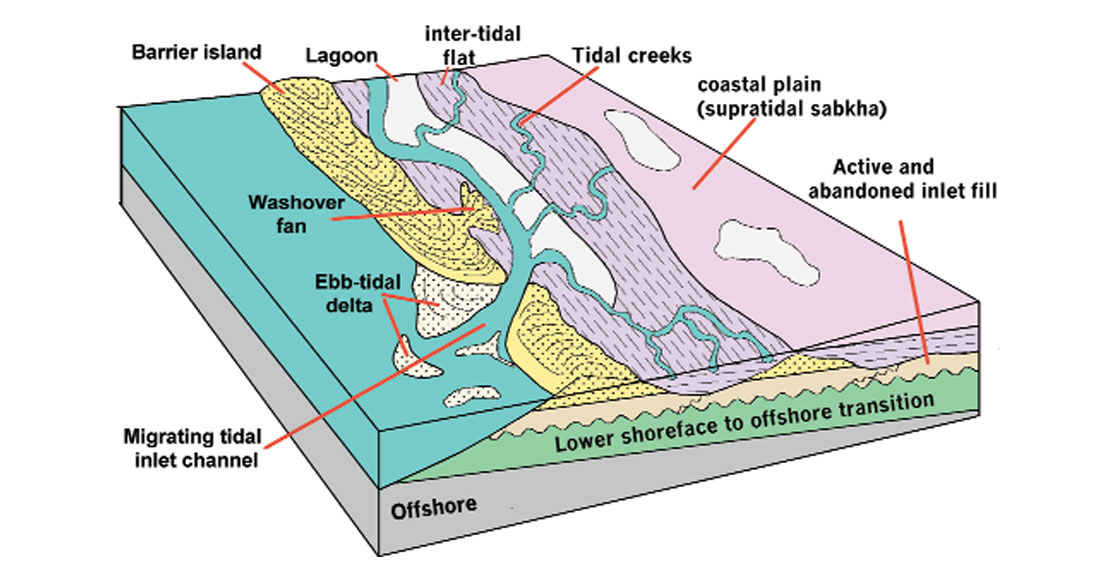
The upper flow unit within the reservoir consists of cross-bedded and planar-laminated sandstones of the ebb-tidal delta, and barrier island upper shoreface. This upper flow unit is up to 10 metres in thickness, has better reservoir quality and has the highest potential for waterflood recovery. The pore system within the upper flow unit has a low pore-to-pore-throat ratio, which promotes an efficient sweep of oil by the waterflood; however, the upper flow unit is discontinuous along strike and dip. For this reason, there are no consistent waterflood patterns in the eastern portion of the Halfway B Pool. The patterns have been designed for the upper flow unit geometry.
The lower flow unit in the reservoir consists in part of lower shoreface deposits, but more commonly of active and abandoned tidal inlet deposits. The thickness of the tidal inlet deposits ranges from 3 to 14 metres and increases going west. The active tidal inlet deposits consist of sandy dolomite coquinas and dolomitic sandstones with mudstone laminae. The lower flow unit is located over most of the oil leg, except for a few areas where the shoreface has not been truncated by tidal inlets. The lower flow unit has significantly poorer reservoir quality and has lower potential for waterflood recovery. The pore system within the active tidal inlet deposits typically consists of an intergranular and biomoldic pore system that is poorly interconnected with micropores within a microcrystalline dolomite matrix. The pore system has a high pore-to-pore-throat ratio, which is not conducive to good sweep efficiency from a waterflood. The tidal inlet deposits are present over most of the reservoir. On a micro-scale, these contain a tortuous pore system. Larger-scale discontinuities also result in greater compartmentalization within the lower flow unit.
Geo-cellular model
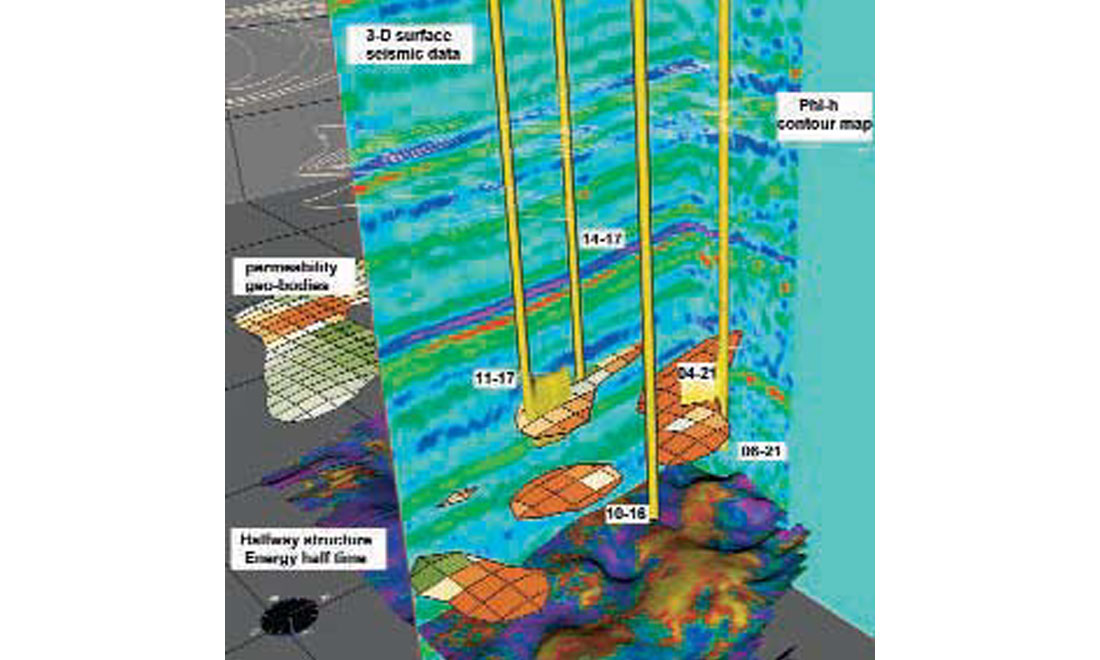
A geo-cellular model (shown as geo-bodies) was based on detailed core descriptions and a petrophysical analysis of well logs from the Halfway B Pool. The reservoir parameters of the pool were represented in a three-dimensional framework of cells. 3-D seismic data acquired in 1994 were then correlated to parameters such as thickness, porosity and permeability, in order to define discontinuities within flow units and to target areas with waterflood potential (Fig. 2).
Seismic attributes
3-D surface seismic data coverage exists over the eastern portion of the oil leg. Seismic attribute analysis has shown that the amplitude response at the Halfway horizon (energy half-time) correlates very well will areas containing the upper flow unit in the geo-cellular model (Fig. 2). The amplitude response may have been enhanced due to a separate solution gas phase in a low pressure, depleted reservoir. The 3D-seismic shows an excellent spatial distribution of the areas that are the target of waterflood recovery
3D Visualization
The Wembley B Pool was selected as a test case for the evaluation of 3D visualization technology. The various data sources (phi-h contour map, Halfway structure surface overlain with the energy half-time seismic attribute, permeability geo-bodies and 3-D seismic data) could be integrated to show how a complex reservoir such as the Halfway B Pool could be further exploited through waterflood recovery and infill drilling.
In Fig. 2, the 10-16 well is visually identified as missing the pool. During the integrated visualization interpretation, decisions were made which resulted in well 11-17 being projected horizontally in order to encounter a better pay zone and to recover incremental reserves from an unswept area. An abandoned vertical well, 06-21, was re-entered following the updated interpretation and horizontally drilled (04-21) to recover oil from an unswept area within the upper flow unit.
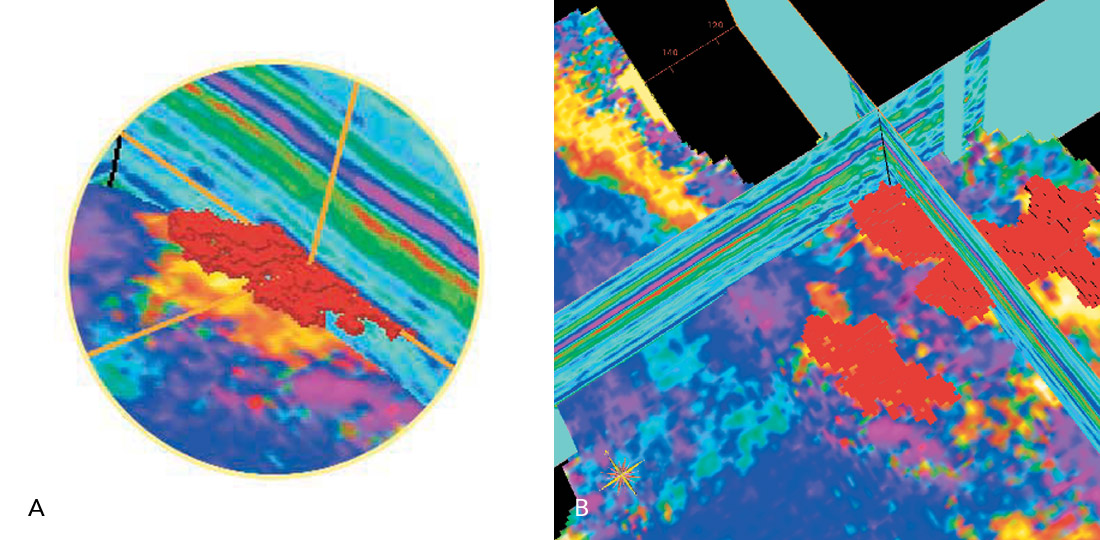
The search for the extent of the pool can also be achieved with success using pattern recognition within the 3-D cube of seismic data using Voxbody detection (Figs. 3a and 3b). The amplitude range of the Halfway pool seismic signature was determined and used to constrain the pattern recognition of the Voxbody search engine. The Voxbodies overlaid the geological evidence quite convincingly.
Conclusions
The workflows shown in 3D visualization (integrated interpretation and Voxbody detection) are additional tools that have proven useful to a multi-discipline team. The geologist and/or geophysicist may have a mental picture of a reservoir or an opportunity, but 3D visualization allows other team members and management to visualize the same concepts.
What will the future of visualization hold? We may see pre-stack and post-stack interpretation of 3-D data (amplitude, complex trace and AVO attributes, integrated 2-D and 3-D VSP data, and statistically derived data cubes of geological, geophysical and reservoir engineering data), geological models and integrated reservoir characterization.


Join the Conversation
Interested in starting, or contributing to a conversation about an article or issue of the RECORDER? Join our CSEG LinkedIn Group.
Share This Article