Summary
Vertical seismic profiling has been a useful measurement to obtain rock properties (velocity, impedance, attenuation, anisotropy) in depth as well as to provide a seismic image of the subsurface. The VSP can also give insight into seismic wave propagation and provide processing and interpretive assistance in the analysis of surface seismic data. New multi-level receivers and hydrophone strings have improved the acquisition efficiency of the survey. Detailed interpretation, phase-matching work, AVO efforts, and elastic-wave analysis can all benefit from VSP information. 3-D images from an area of sources recorded in a VSP show considerable promise. Similarly, the use of borehole seismic measurements to monitor hydraulic fracturing and perform repeated surveys is developing rapidly.
Introduction
Drilling a well indicates a significant interest in the subsurface of an area. Hopefully, the drilling results support the original enthusiasm. The well might have been a stratigraphic test, a step-out development well, an expensive offshore well, or a land exploration borehole. It will likely have been logged with various tools. Whatever the well’s type, its location will often have been selected on the basis of seismic images. In most cases (even the embarrassing ones), we will want to derive as much information from the borehole as possible - either to find more (or less) of the same. The vertical seismic profile is both a well log and a seismic imaging tool. As such, it can help in the geophysical appraisal of the region around a well. The VSP has four important roles to play in assessing the rock and fluids close to the borehole: 1) to provide in situ rock properties in depth, particularly seismic velocity, impedance, anisotropy, and attenuation, 2) to assist in understanding seismic wave propagation (e.g., source signatures, multiples, and conversions), 3) to make well understood reflectivity images in depth, and 4) to use all of the above in further surface seismic data processing and interpretation.
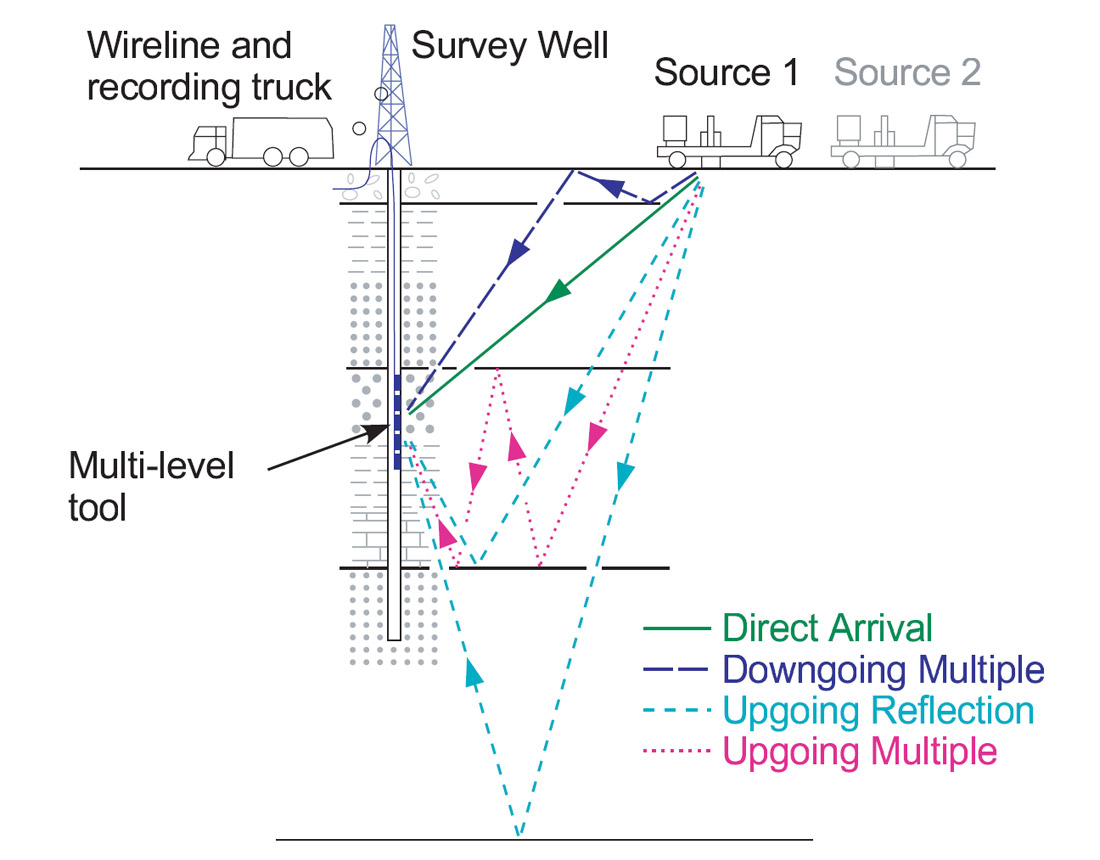
The basic components of a VSP survey are a seismic source, wireline and downhole receiver array, and a recording/wireline truck (shown schematically in Figure 1).
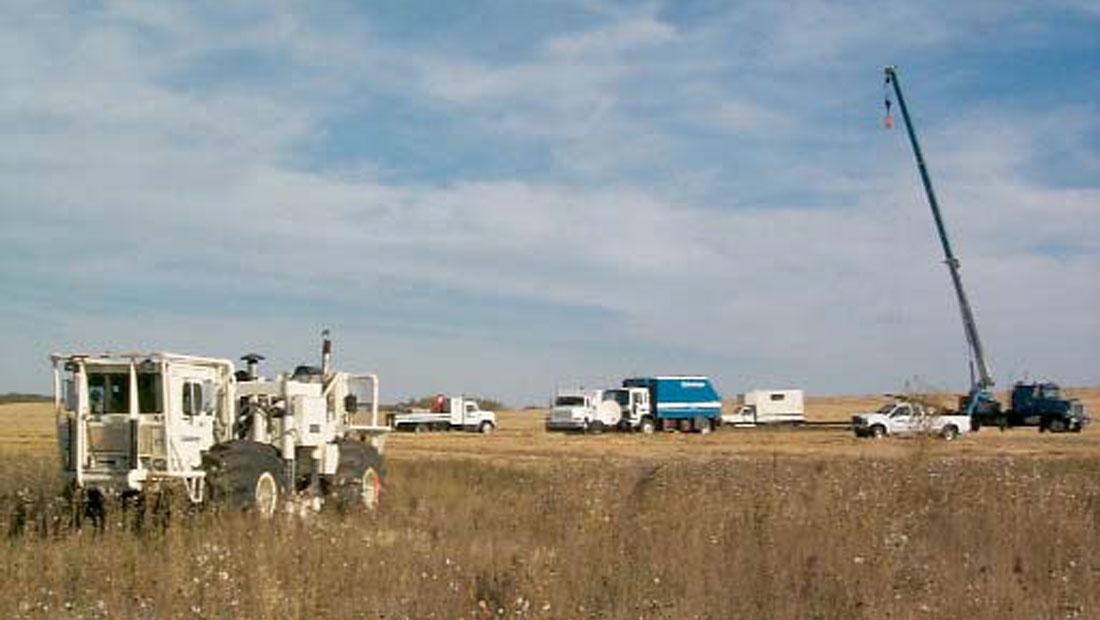
A photograph of a VSP survey in progress, at the Pikes Peak heavy oilfield in Saskatchewan, is shown in Figure 2. If a single source position is used within several tens of metres of the borehole, then the survey is called a, “zero-offset” VSP. The typical objectives of the zero-offset survey are to provide a seismic time-to-depth relationship, interval velocities in depth, and a normal-incidence reflectivity trace. If there are a number of regularly offset sources from the well-head, then the survey is often called a “walkaway” VSP. The walkaway VSPs are usually conducted to determine AVO behavior or to create a 2-D reflectivity image away from the borehole. Several sources deployed at various offsets might be just called a multi-offset VSP or if at different directions from the well, a multi-azimuth survey. These surveys would give 2-D sections away from the well.
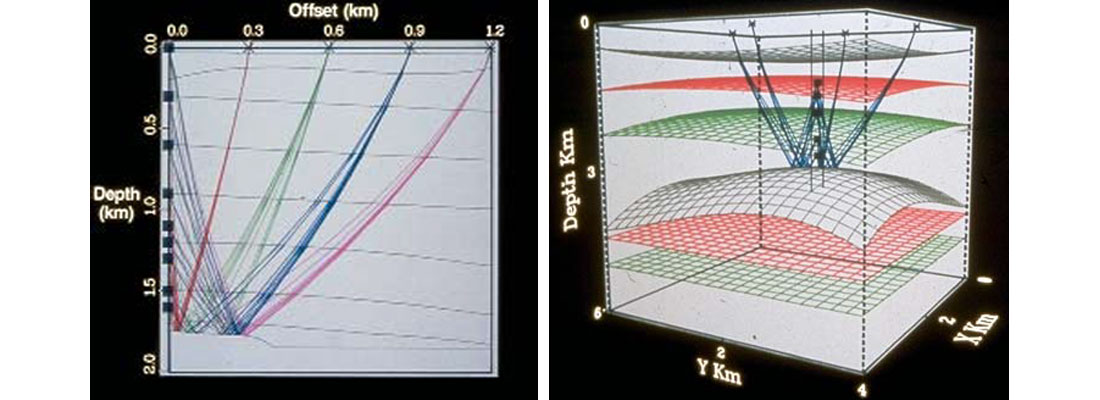
A full areal set of shots on the surface would constitute a 3-D VSP. The 3-D VSP can be accomplished very economically if shot in conjunction with a 3-D surface seismic survey. The goal of both the VSP and surface seismic surveys then would be to make a full volumetric picture of the subsurface. A schematic diagram of 2-D and 3-D configurations is shown in Figure 3.
Acquisition
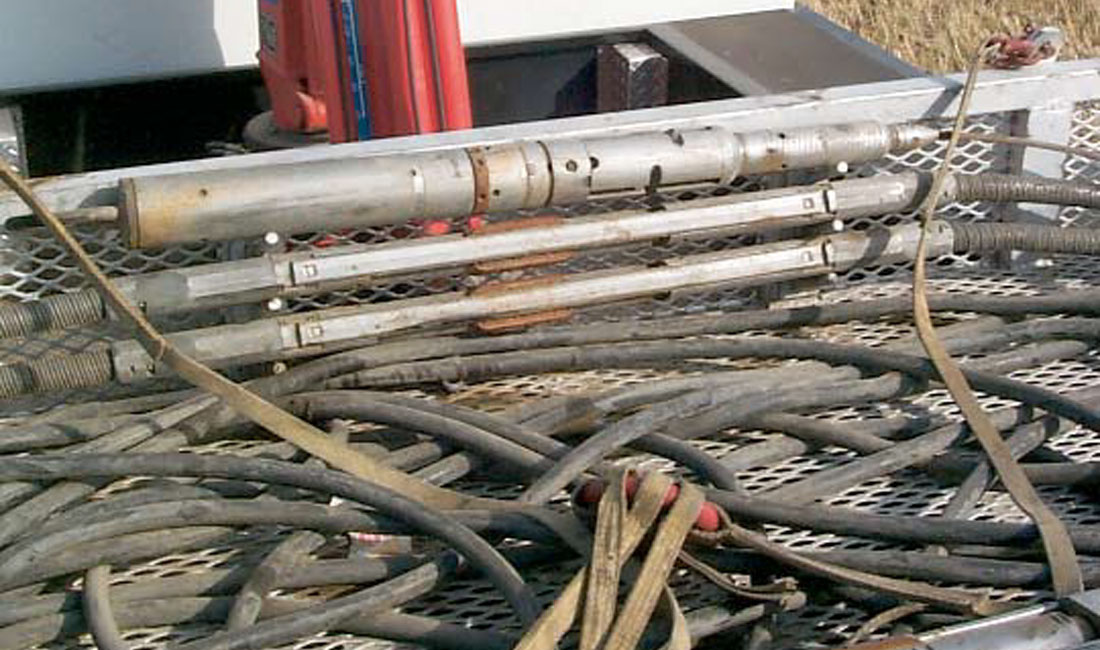
Downhole seismic data are typically acquired using tools containing three-component geophones clamped to the borehole wall. A typical geophone tool will have 5 levels, although there are tools with up to 80 levels of 3-C geophones that can clamp to the borehole wall. VSP surveys can be conducted in open as well as cased holes, but cased holes are often preferred due to magnetic clamping tools and avoidance of borehole stability problems. Schlumberger Canada’s 5-level 3-C tool is shown in Figure 4. In practice, the tool is usually lowered to the bottom of the well and records a source shot or shake. The tool will be moved its length up the hole and the source is reactivated. This continues up the hole until time or budgets expire. Recording over the whole vertical range of the well is advantageous to provide the most complete depth and offset coverage. The cost of the VSP is assessed according to factors that include: the number of depth levels recorded, total vertical aperture of the operation, number and type of source offsets, time on site, tool rental, and of course mob/demobilization costs. We note that hydrophone receiver strings can also be effectively used in VSP surveys. This form of acquisition has the advantage that many receivers can be deployed with minimal effort. Borehole waves are a major source of noise with hydrophone cable surveys, but much of this noise can be removed with various filtering operations.
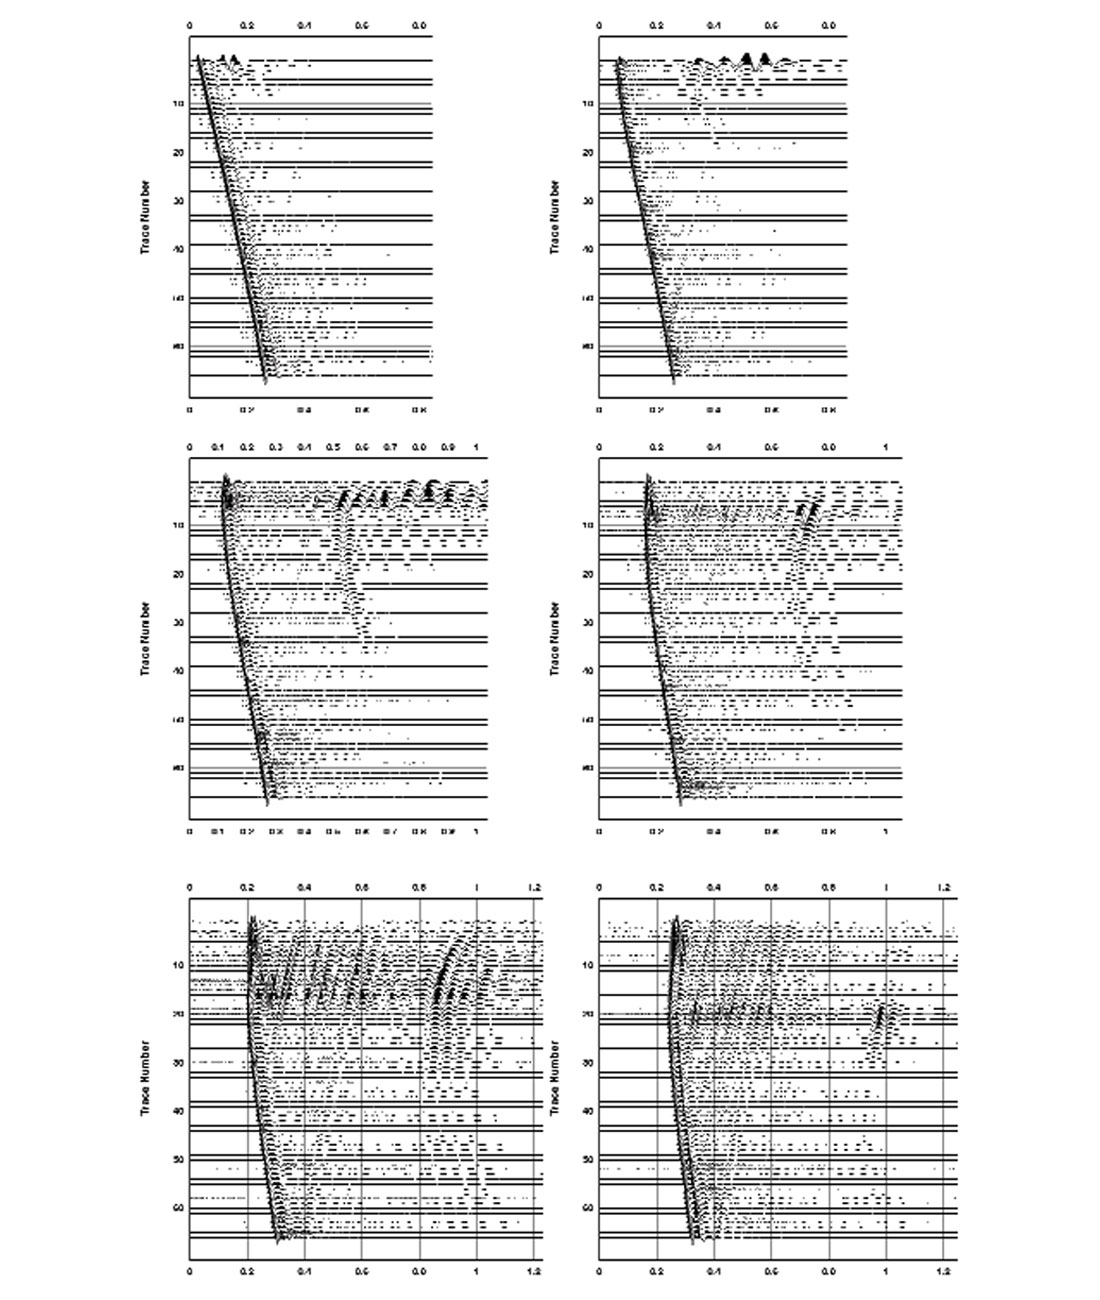
The kind of data that are recorded are shown in Figure 5. These are the vertical channel recordings for a six-source VSP survey in the Pikes Peak heavy oilfield, Saskatchewan. The source offsets were 23m, 90m, 180m, 270m, 360m, and 450m.
Note the relatively straight line of the first arrivals with depth. Moving to farther offsets the shallow first arrivals are actually upcoming refractions. We interpret the curved arrivals later in the data to be source-generated shear waves - which are fairly common even on the vertical geophones!
Analysis
Once we have acquired our borehole seismic data, we need to extract the properties of interest from it as well as make some kind of image. The most basic information that we will want from the VSP is a seismic time-to-depth relationship. This information is acquired by just picking the first-breaking energy of the zero-offset survey. The time-depth curve may be used in sonic log calibration or stretching surface seismic data into depth. From the time-to-depth picks, we can also extract an actual seismic interval velocity. This velocity might be used in building a rock physics data base, surface seismic imaging, or as a constraint for seismic inversion. In addition, by finding an angular dependence of velocity (or split shear waves), we may be able to estimate anisotropy in the rock.
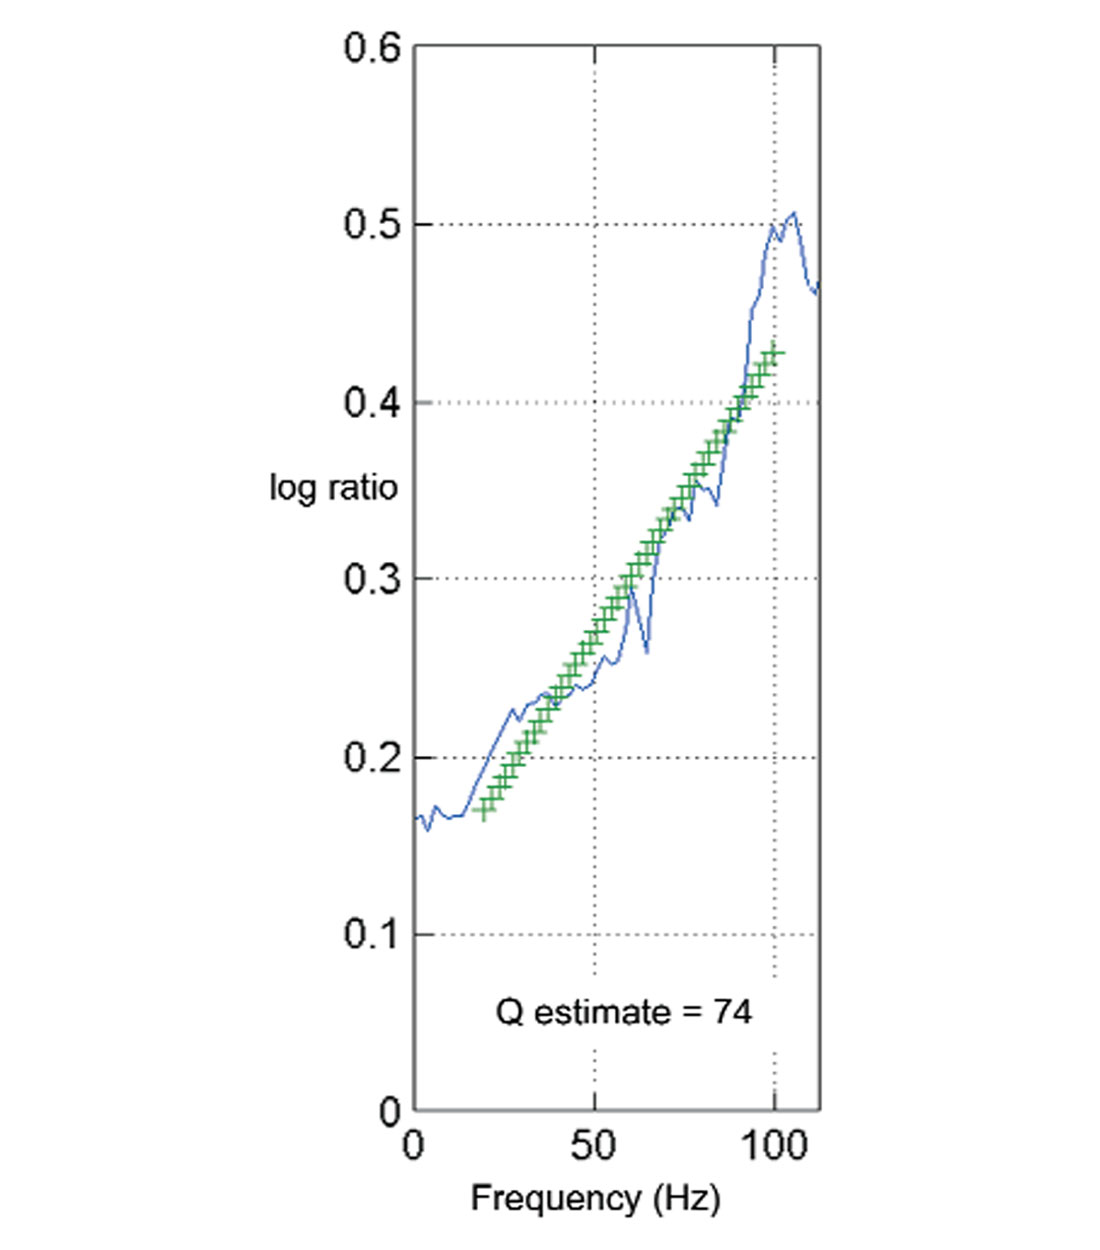
This anisotropy might be attached to the state of stress in the formations or fracture intensity and direction. We can also use the frequency loss, in the first few cycles of the downgoing energy, over several levels to calculate an attenuation. This absorption or Q factor can be used as a rock property or in a Q-compensation technique with surface seismic data (Figure 6).
The next level of sophistication would have us process a zero-offset survey for its reflectivity. In this case, the VSP is really providing a one-dimensional image. However, we do know quite a bit about this single trace. It can be made largely multiple free and zero-phase. We’re confident with the zero-phase estimate because we have measured the downgoing wave and can thus accomplish a deterministic (signature-type) deconvolution. In addition, via the composite or L plot, the VSP provides a unique mapping between seismic reflectivity in time and rock properties in depth.
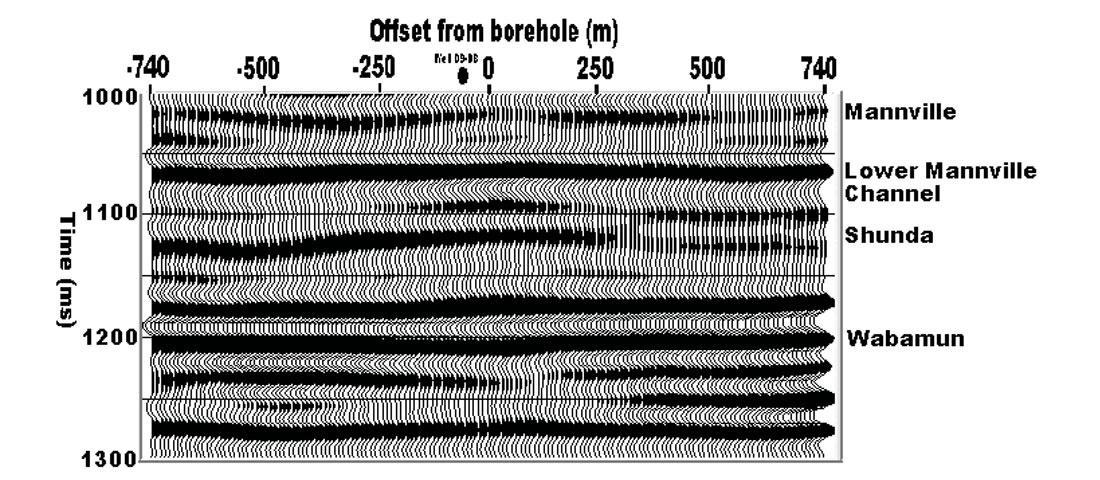
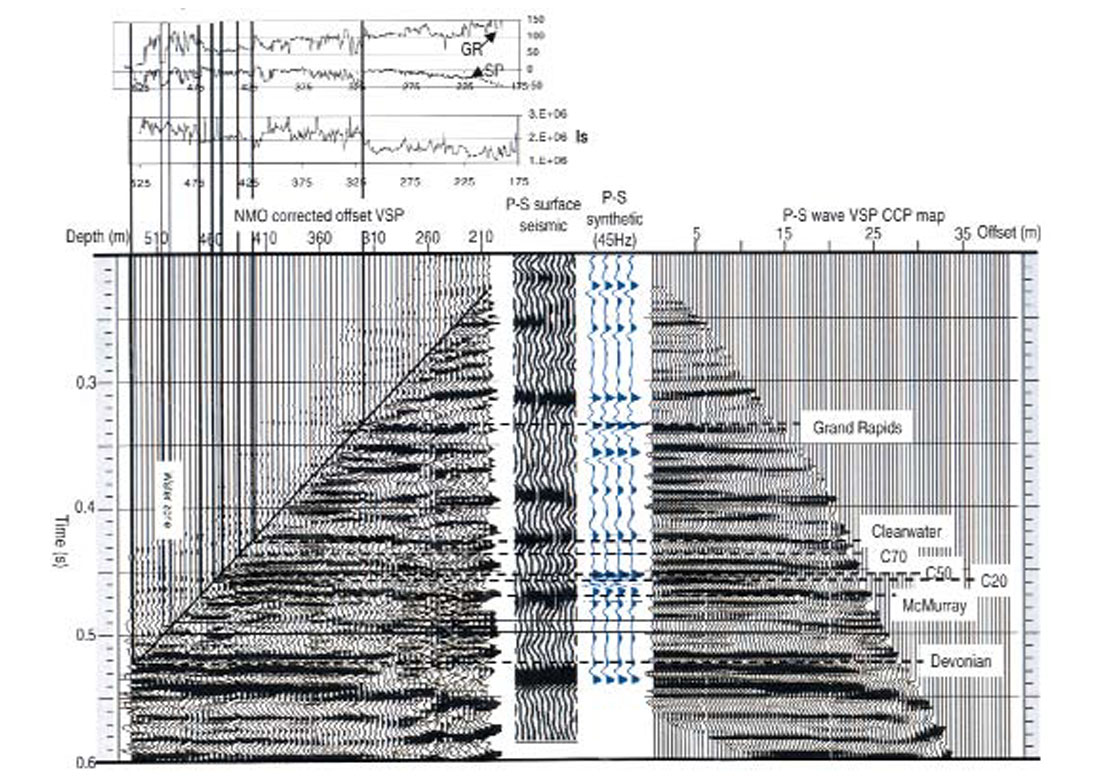
If we have a source or sources offset from the well-head then we can make a lateral reflectivity section from the data. One such image is shown below (Figure 7), where we used a 48-level vertical hydrophone cable and regularly spaced dynamite shots, to offsets of 1500 m, to create an image a Glauconitic reservoir at a depth of 1500m.
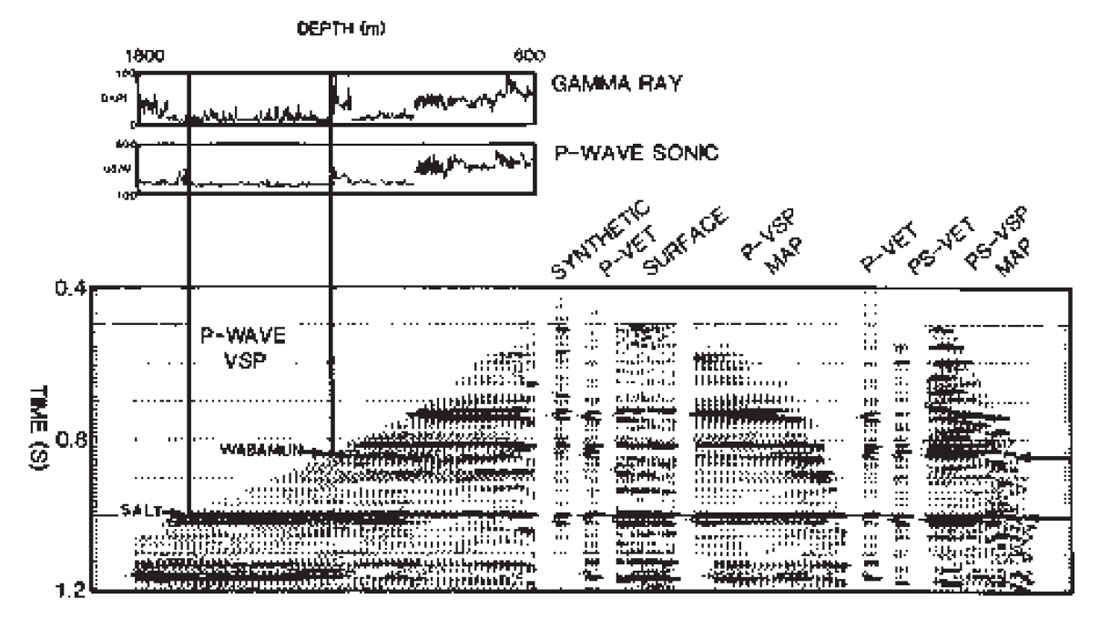
We note that the gamma ray and sonic logs are in depth (600m-1800m) as is the horizontal scale of the VSP. The VSP however, is also in two-way time on the vertical axis. This allows a direct correlation of surface seismic data as well as synthetic data to the well logs in depth. Because this particular VSP used an offset source, we have created an offset image - both for P waves and converted (PS) waves. These VSP images can also be correlated and integrated into the interpretation.
Various other geometries can be employed to create specific pictures. For example, having receivers in a deviated or horizontal well can provide a high-resolution image below the borehole.
3-D VSP
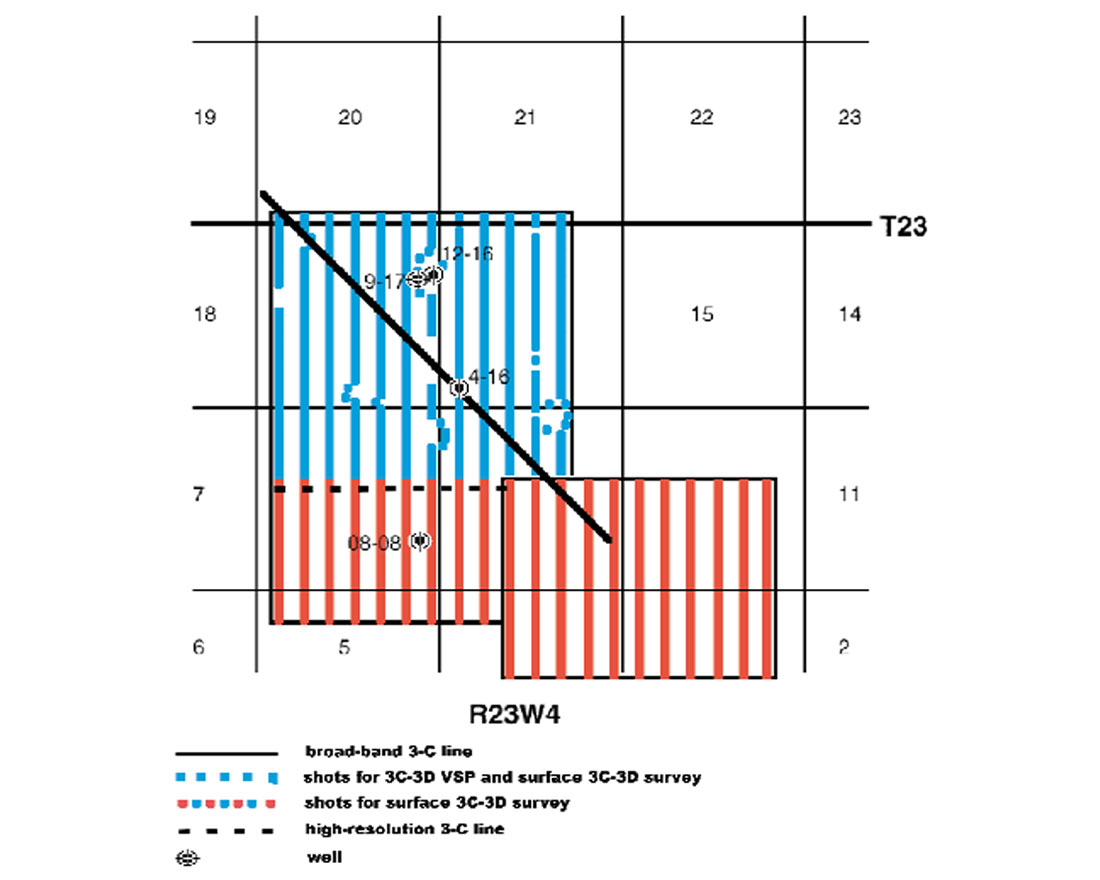
By using an areal distribution of shots (perhaps from a simultaneously conducted 3-D surface seismic survey), we can create a 3-D image. Such a 3C-3D VSP was acquired over the Blackfoot oil field in Alberta, Canada. This 3-D VSP was recorded simultaneously with a surface 3C-3D seismic program. Dynamite shots (4 kg at 18 m) from the surface 3C-3D seismic survey, that fell within 2200m offset from the recording well were used in the VSP analysis (Figure 10). As these 431 shots for the surface 3-D seismic were being taken, a 5-level borehole tool moved seven times (75m each) recording over a receiver depth range from 400m to 910m.
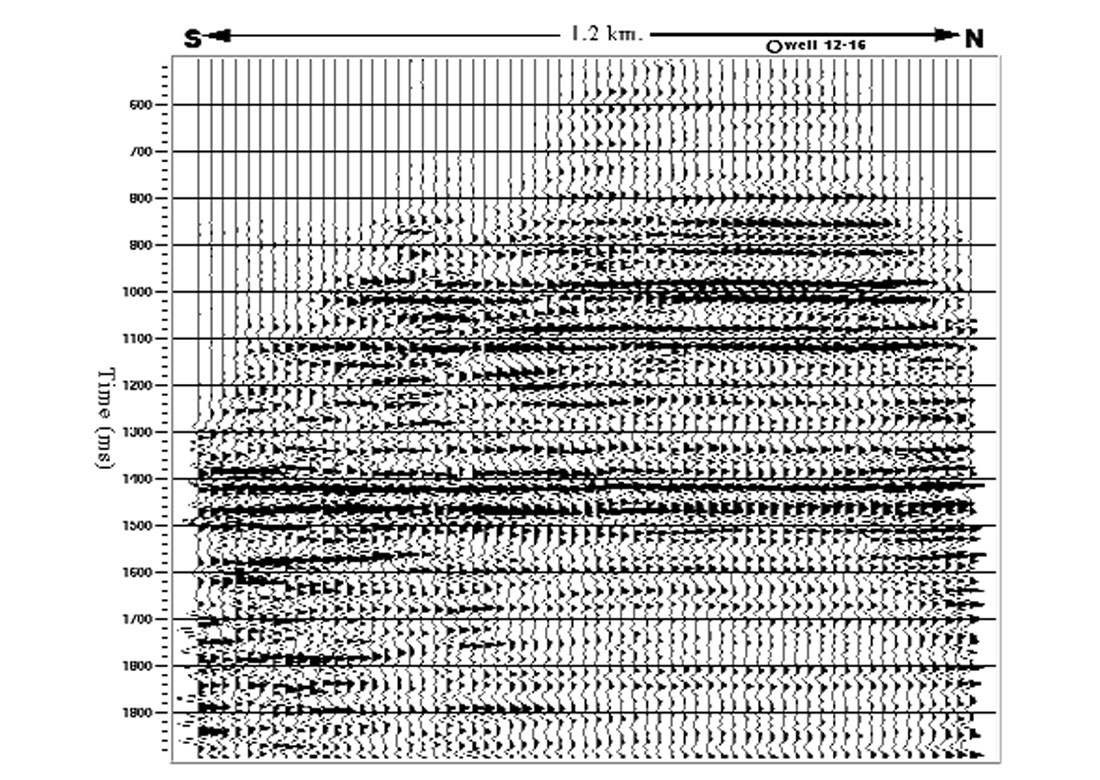
The 3-D VSP data were processed using basic VSP processing techniques that included hodogram analysis, wavefield separation using median filters, and VSP deconvolution. The final P-P and P-S image volumes were obtained by VSPCDP stacking the upgoing wavefields in 3-D cells followed by f-xy deconvolution (Figure 11). The P-P and P-S sections from the 3-D VSP correlate well with those from the surface 3C-3D seismic survey.
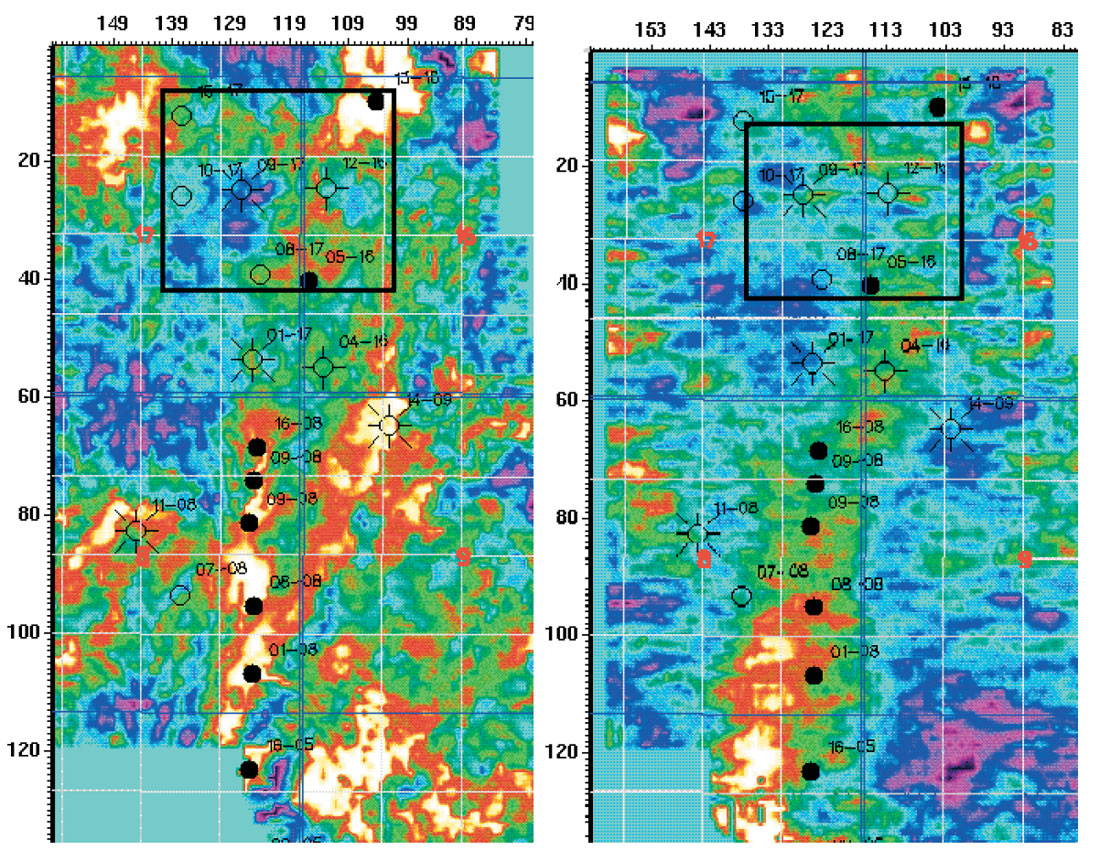
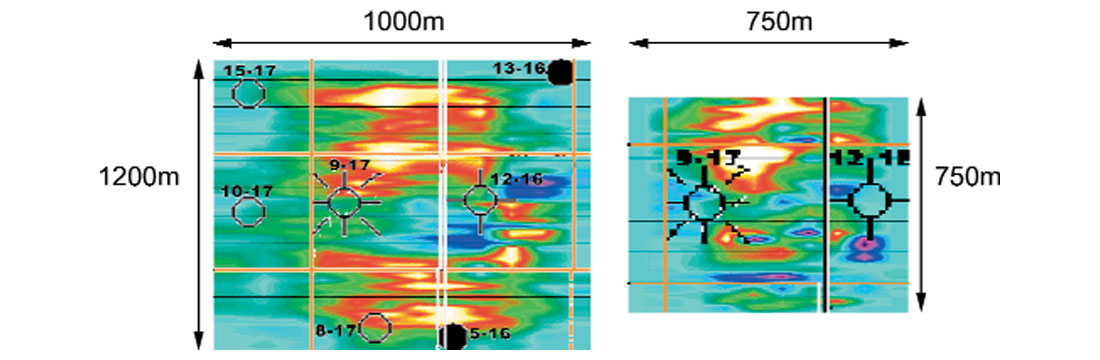
The discovery of PanCanadian Petroleum’s Blackfoot oilfield was assisted by anomalies on P-wave 3-D seismic slices (from a 1993 survey). These anomalies may be related to gas in the upper reservoir. However, many non-reservoir anomalies exist, too. A3C- 3D seismic survey was conducted in 1995 to attempt to differentiate reservoir from non-reservoir rock using converted waves. Figure 12 shows time slices at the reservoir (channel level) from the resultant P and converted-wave volumes of the surface seismic survey. Both show a north-south trend of the interpreted Blackfoot Glauconitic channel body. The box on the time slices in Figure 12 indicates the area of coverage of the 3-D VSP. The time slices in Figure 13 of the 3-D VSP indicate anomalies (reds and oranges are interpreted as sand indicators) and possible additional targets for drilling.
Monitoring
There have been some remarkable images developed from borehole sensors that monitor hydraulic fractures. Earthquake hypocentral location techniques are used to plot the fractures as they occur in time. This can give an excellent indication of the extent of a hydraulic fracture. Furthermore, the is great promise in permanently emplacing motion sensors in a well to repeatedly monitor fracturing or image the area of interest for fluid and pressure changes.
Conclusions
Borehole seismic measurements can be used for a number of purposes including the estimation of rock property values, seismic propagation understanding, interpretive assistance, and standalone imaging. The use of hydrophone receivers promises faster and cheaper acquisition as do many-level geophone tools. The VSP is continuing to develop as a sophisticated seismic log (for in situ values including anisotropy). Converted-wave analysis is considerably helped by 3-C VSP measurements. 3-D VSP imaging is providing some very useful images. Permanently emplacing downhole sensors may provide a whole new realm of reservoir monitoring.

Acknowledgements
I would like to thank Husky Energy Inc., Calgary, especially Larry Mewhort, for expert counsel and support of the Pikes Peak effort as well as AOSTRA (Project #1296) for its assistance. The Blackfoot Seismic Project and PanCanadian Petroleum Ltd. made the 3C-3D seismic surveys possible. Finally, I thank sponsors of the CREWES Project for their continued technical and financial support.


Join the Conversation
Interested in starting, or contributing to a conversation about an article or issue of the RECORDER? Join our CSEG LinkedIn Group.
Share This Article