Multi-layered Hazad sands of Middle Eocene age deposited in deltaic environment are the main hydrocarbon producers in south Cambay Basin, India. These sands are broadly divided into twelve units (1 to 12) from bottom to top. These individual sand units are further subdivided in to smaller subunits which are selectively charged and producing hydrocarbons in different parts of the south Cambay Basin. The study area covers a part of Gandhar oil field situated in the Broach-Jambusar block of the basin where subunits 3A and 12A have produced oil and gas in commercial quantity. Due to wide spread deposition, and higher thickness, unit 3A was delineated and developed based on conventional interpretation of 2D seismic data. Development strategy for unit 12A could not be firmed up in absence of a precise sand geometry map. A3D seismic survey was carried out in the study area with one of the objectives being to precisely map the lateral extent of thin pay sands. As per well data the thickness of unit 12 consisting of subunits 12A, B and C varies from 0-18m and wherever unit 12 is thicker subunit 12A is present. Unit 12 is not resolved in the available seismic data but its seismic response is detectable. Synthetic seismic modelling has been carried out for better understanding of seismic response and precise calibration. Seismic attributes extracted from 3D data volume corresponding to unit 12 are utilized for generating a net thickness sand map of this unit using artificial neural network technique. The sand geometry map of subunit 12A has been prepared with the help of a net thickness map of unit 12 and well data. The thickness map of unit 12 has helped in mapping the precise sand geometry of unit 12A with additional area for cost effective exploration and development of this pay which in turn improves the inplace reserves.
Introduction
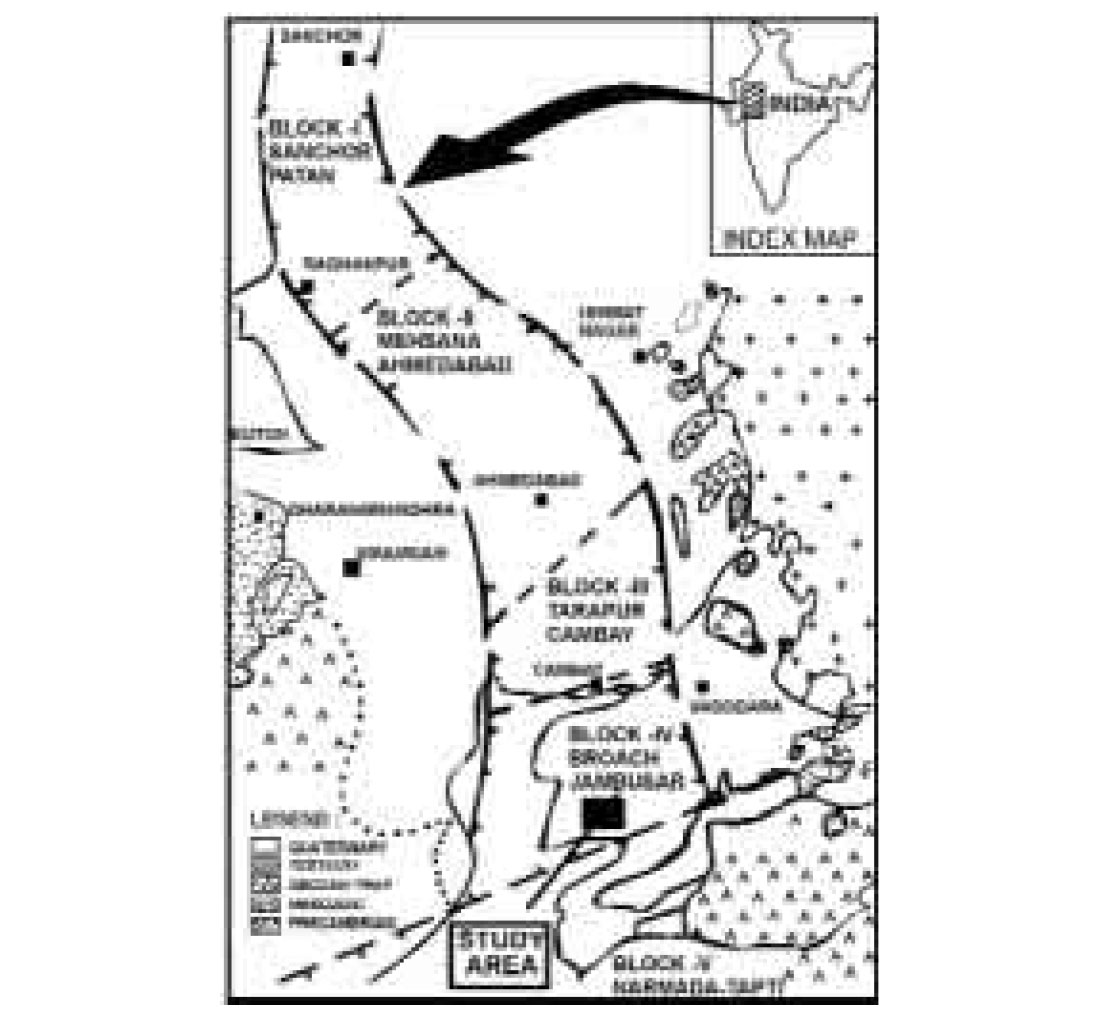
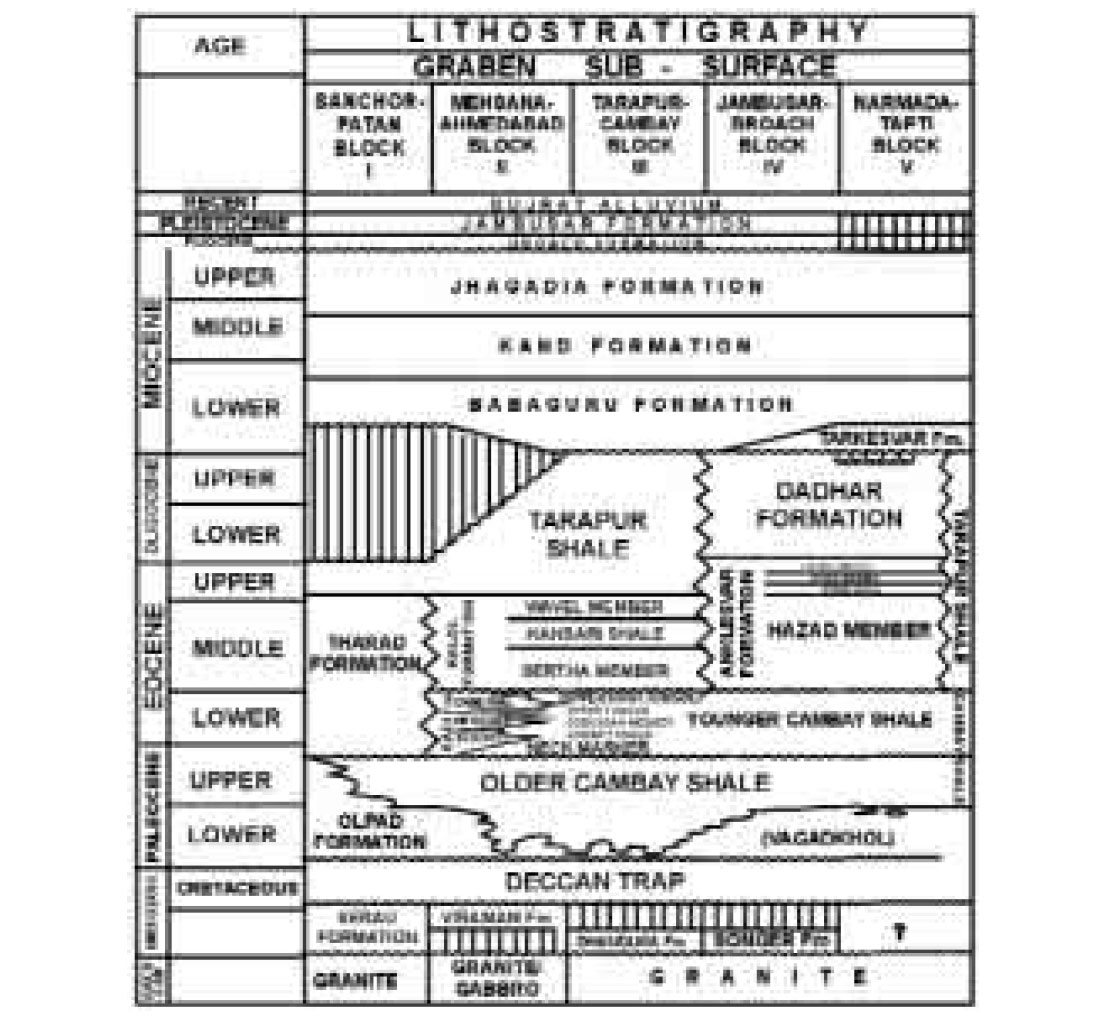
The Cambay Basin is one of the major hydrocarbon producing basins of India (Fig.1). This basin is an intracratonic rift graben situated in the western part of the Indian sub-continent and forms the northern extension of the large Bombay Offshore Basin. The basin came into existence during Late Mesozoic era with the development of major extensional faults along preexisting basement trends following widespread extrusion of Deccan Trap basalt. This basaltic floor formed the basement for the deposition of a huge thickness of Tertiary- Quaternary sediments in the basin. Based on the recognized basement fault trends, the basin has been divided into a number of blocks namely Sanchor-Patan, Mehsana-Ahmedabad, Tarapur, Broach-Jambusar and Narmada. The generalized stratigraphy of Cambay Basin is shown in Fig. 2.
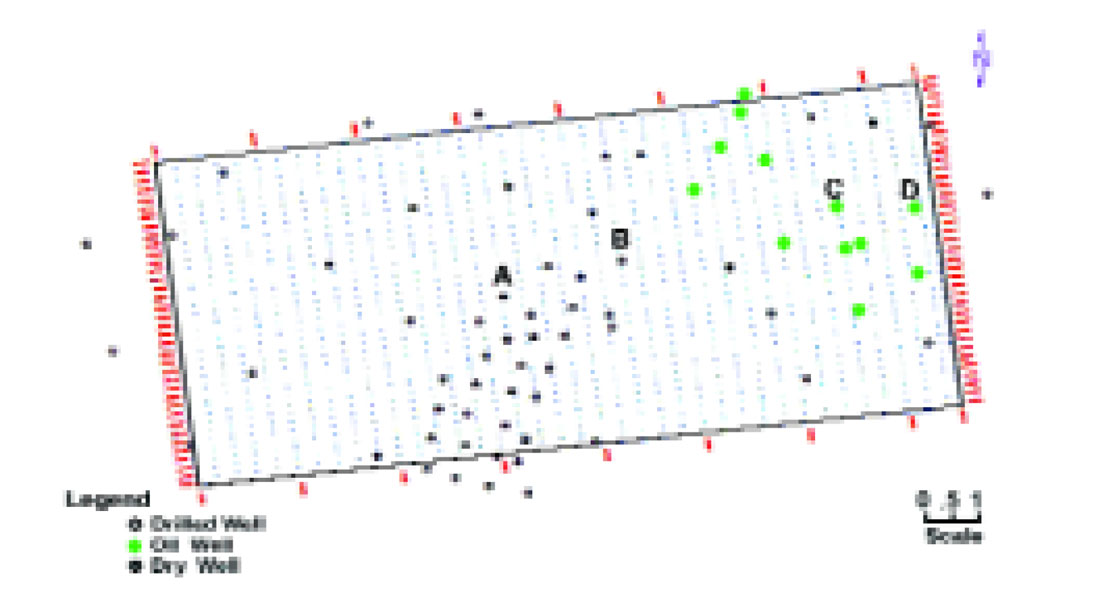
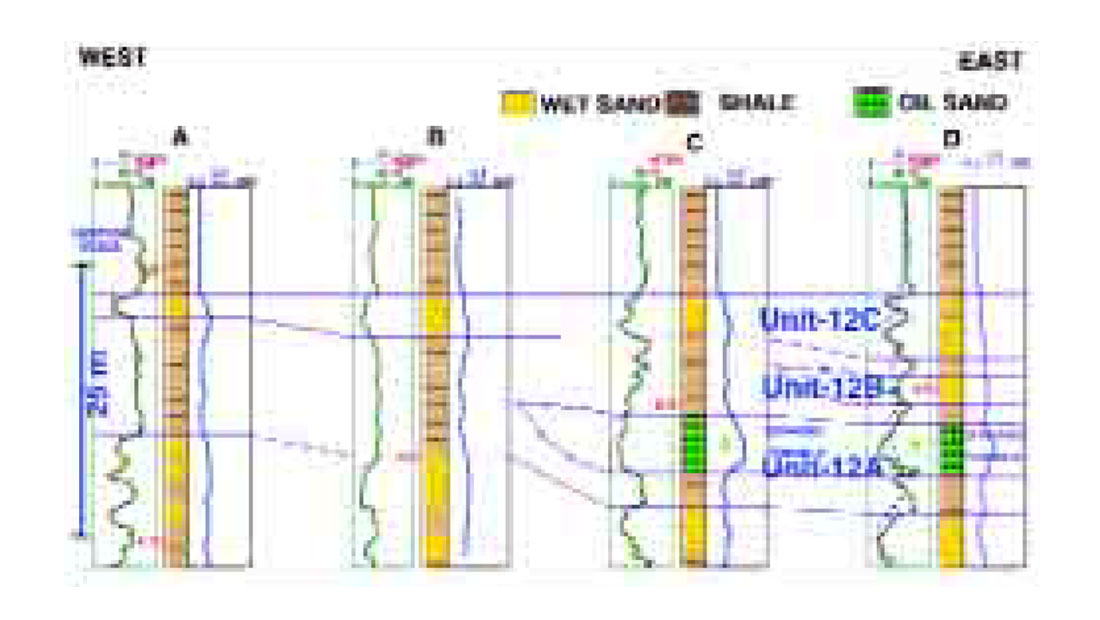
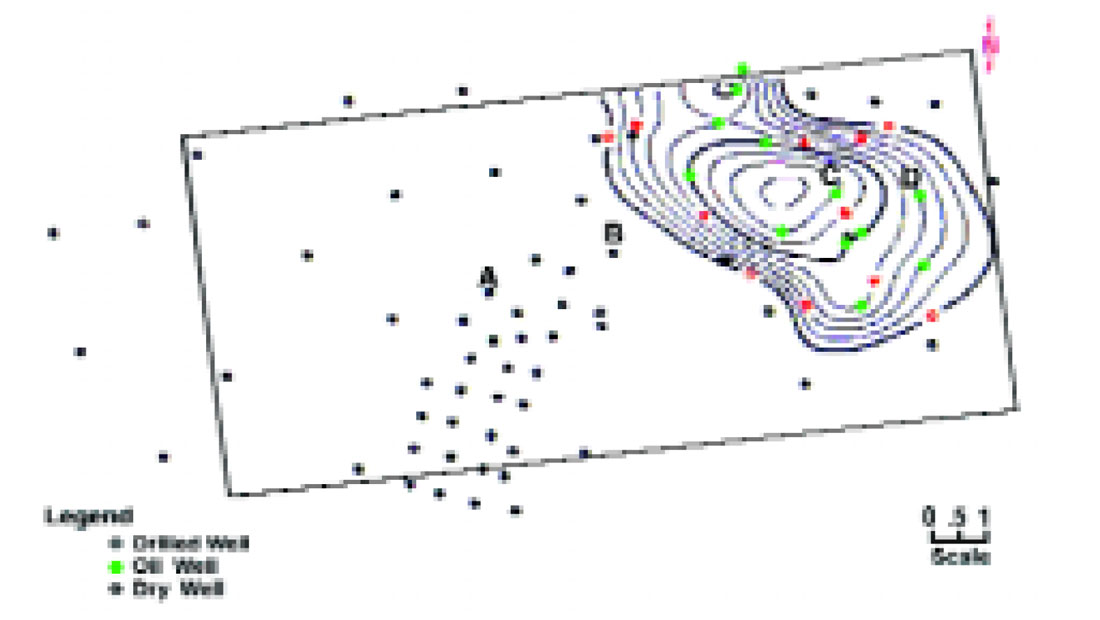
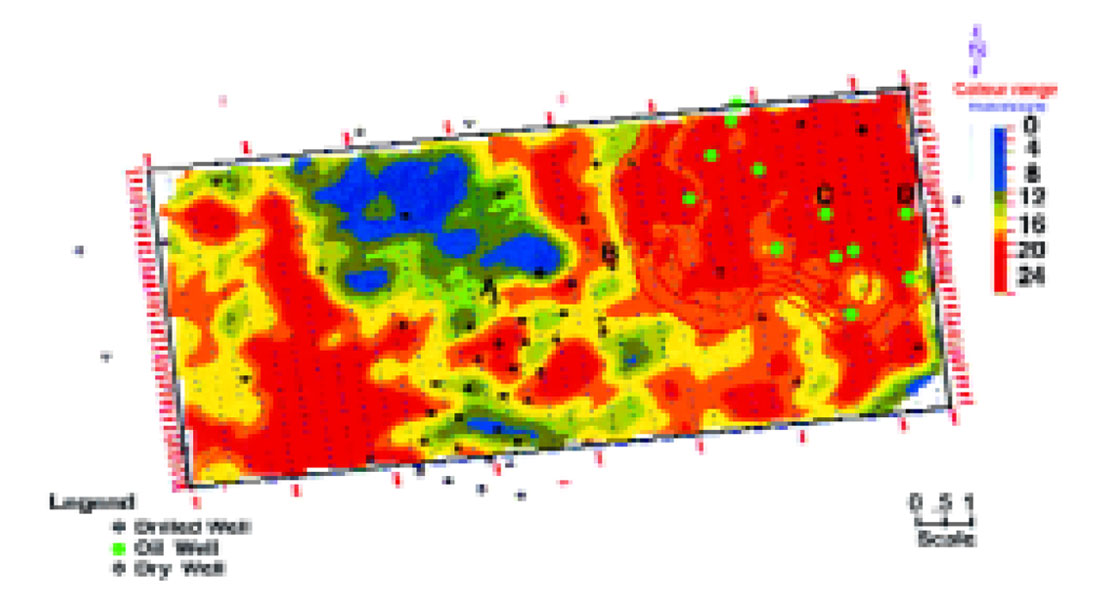
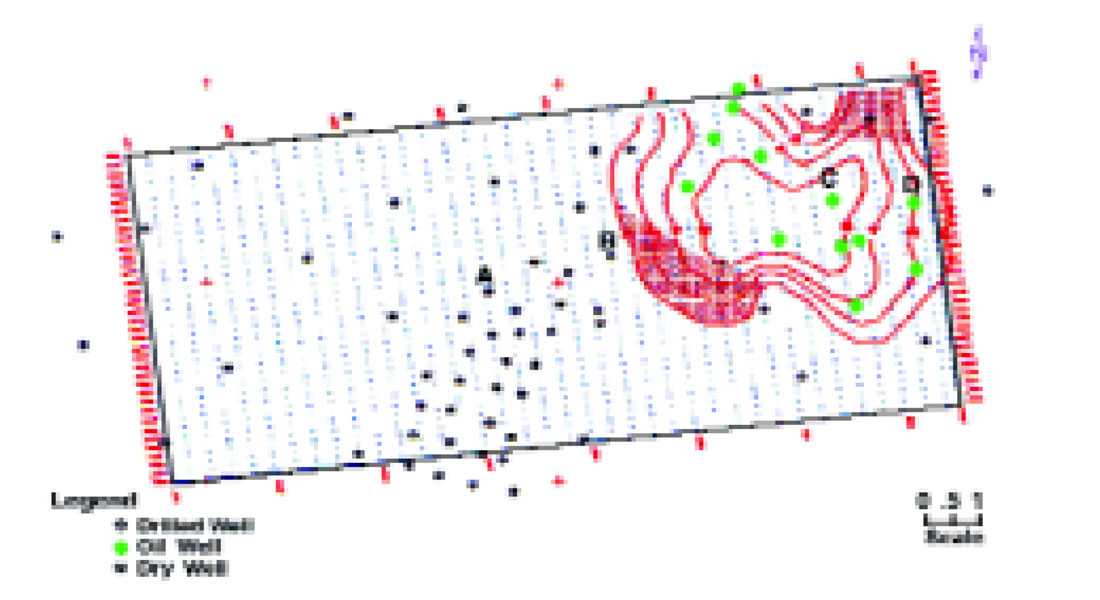
Hazad sands of Middle Eocene age are the main hydrocarbon producers in the south Cambay Basin. These sands have been divided into twelve units i.e. unit- 1 to 12 from bottom to top. These units are selectively charged and are hydrocarbon producers in different parts of the Broach Jambusar block. Some of the units are further divided into smaller subunits. The study area falls in the Broach -Jambusar block covering an area of about 100 sq. km. In the study area, unit- 12 has been divided into three sub-units A, B and C and subunit- 12A has produced oil in a number of wells in the eastern part (Fig.3). This is a thin sand having 2- 7m thickness in drilled wells and is not developed towards the west (Fig.4). It has been observed through log data that wherever subunit-12A is developed the thickness of unit-12 is more. Based on well data only a net thickness map of unit 12A pay sand was prepared which indicates a northwest- southeast trending sand lobe (Fig.5). It was interpreted that subunit 12A is deposited as a thin isolated lobe fully charged with hydrocarbons as oil-water contact has not been observed for this reservoir in the drilled wells. The productivity profile of wells situated near the southern periphery of this sand lobe indicates the presence of a larger pool in comparison to what was mapped. Mapping of the sand geometry of subunit 12A, therefore assumes importance.
Systematic delineation and development of this thin sand reservoir is a challenging task due to its thinness, limited areal extent and a depth of burial ranging from 3100-3500m in the study area. To resolve these problems, in the recent past, various state-of-the-art technologies using 3D seismic data have been developed and utilised in the petroleum industry. Seismic attribute technology is one of these advances which is being widely used for addressing such problems. Recent advances in computing power and 3D visualization software packages allow interpreters to integrate seismic attributes into geophysical interpretation in new and innovative ways (Robinson et al., 1988, Rijk et al., 1991, Lewis, 1997). Seismic attribute technology includes extraction of seismic attributes, detection and analyses of attribute anomalies, validation of hydrocarbon prospects and transforming seismic attributes to reservoir properties. Subsurface facies mapping has been attempted by many workers in clastic sequences using 3-D seismic imaging and seismic attributes to resolve the thin channel and point bar sands encased in muddy rock framework (Enachescu, 1993 and Hardage et al. 1996, Singh et al., 1998, Srivastava et al., 1999).
Artificial neural network based methods for estimating rock properties from seismic attributes and other geoscientific data have been gaining popularity (Shuki et al., 1994, Todorov et al.,1998, Banchs and Michelena, 2000). The main advantage of neural networks over other estimation methods is their ability to extract nonlinear relationships among datasets. The neural network technique provides a reliable approach for estimating the reservoir properties through integration of seismic attributes and well log data. This integrated approach of interpretation has been adopted for delineation and mapping of subunit 12 A. This has resulted in precise mapping of the reservoir which may be highly useful in cost effective exploitation.
Seismic Data Acquisition and Processing
2D seismic data of different folds varying from 6 to 48 fold was acquired in different vintages covering the study area and attempts were made to map sand geometries of different units of Hazad sands. But precise mapping of thin sands could not be done from these data sets. 3D seismic data covering an area of 100 square kilometers in the study area was acquired using dynamite as the source of energy keeping in view the precise mapping of these thin sands as one of the main objectives. Four-line swath shooting geometry having a bin-size of 20x40m was adopted for the recording of 40 fold seismic data at a sampling interval of 2 msec and a record length of 7 sec. Utmost care was taken during data acquisition to achieve maximum signal to noise spectral bandwidth (signal bandwidth above the background noise level) for higher lateral and vertical resolution. This was further improved through adequate geometrical spreading and inelastic energy loss compensation, deconvolution and migration at the time of data processing. A standard 3D processing sequence was applied to process this data volume with strict quality control of outputs at every processing stage. Predictive deconvolution using an autocorrelation window of 500-5000 msec, an operator length (OL) = 160 msec, prediction distance (PD) = 8msec. and white noise of 0.1 percent was applied to the prestack data. Close grid velocity analysis on dip move out (DMO) corrected gathers was carried out to obtain accurate interval velocities of the substrata. Post stack deconvolution was applied on DMO stack with similar parameters as were applied in case of prestack deconvolution. Finally, two-pass finite difference migration was carried out to place the seismic reflection energy in its proper subsurface location. The dominant frequency of final migrated data volume was obtained in the range of 32-35 Hz at the zone of interest.
Calibration, Seismic Modelling and Structural Interpretation
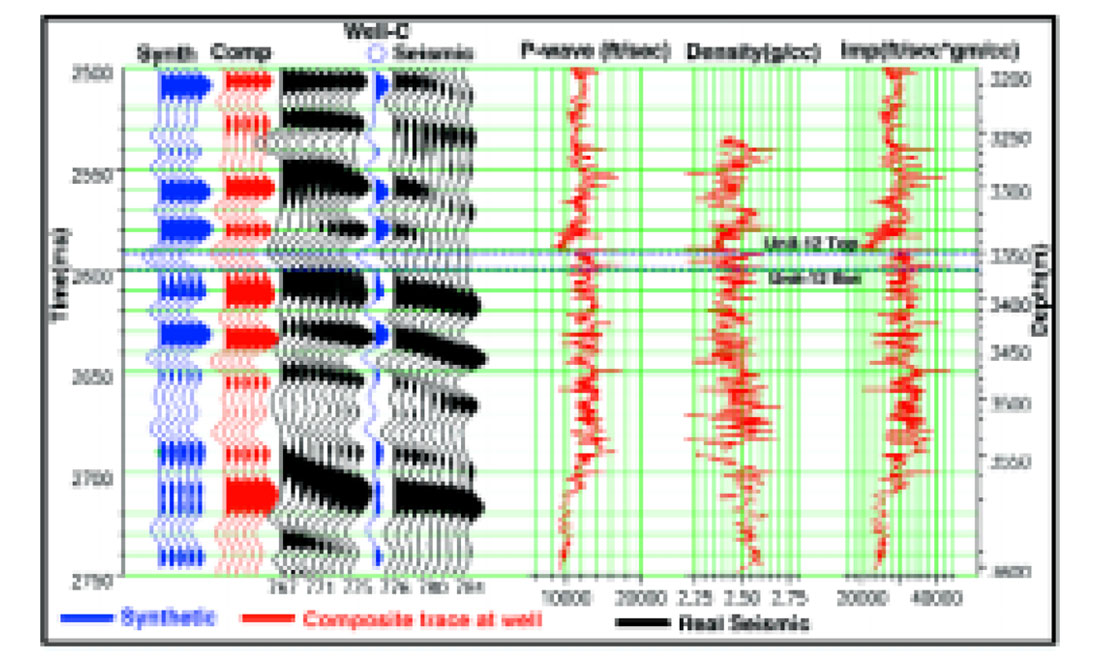
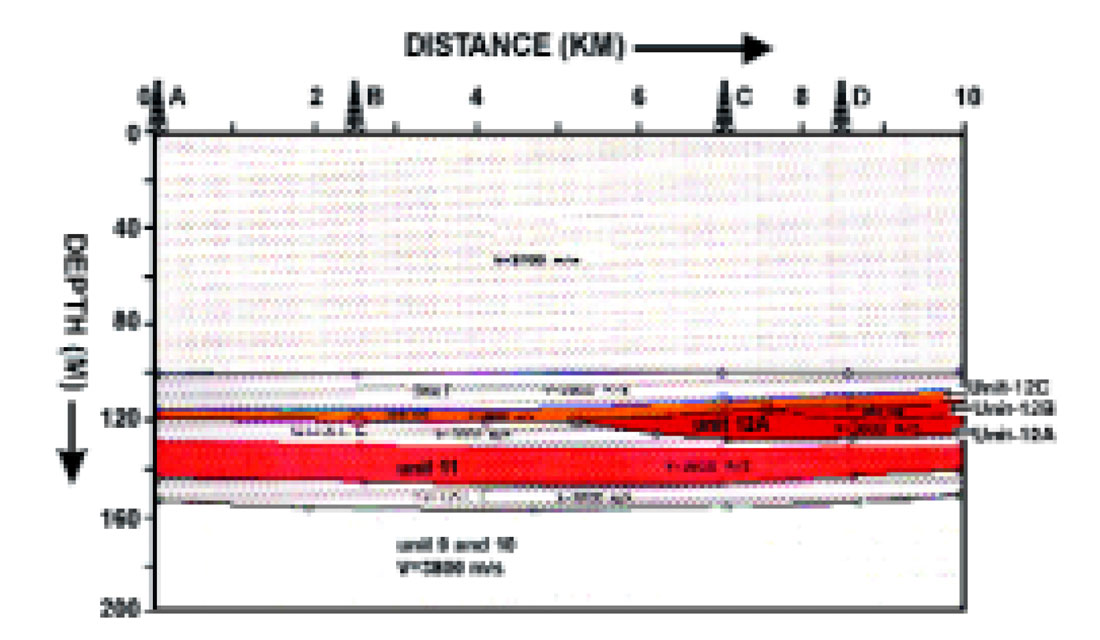
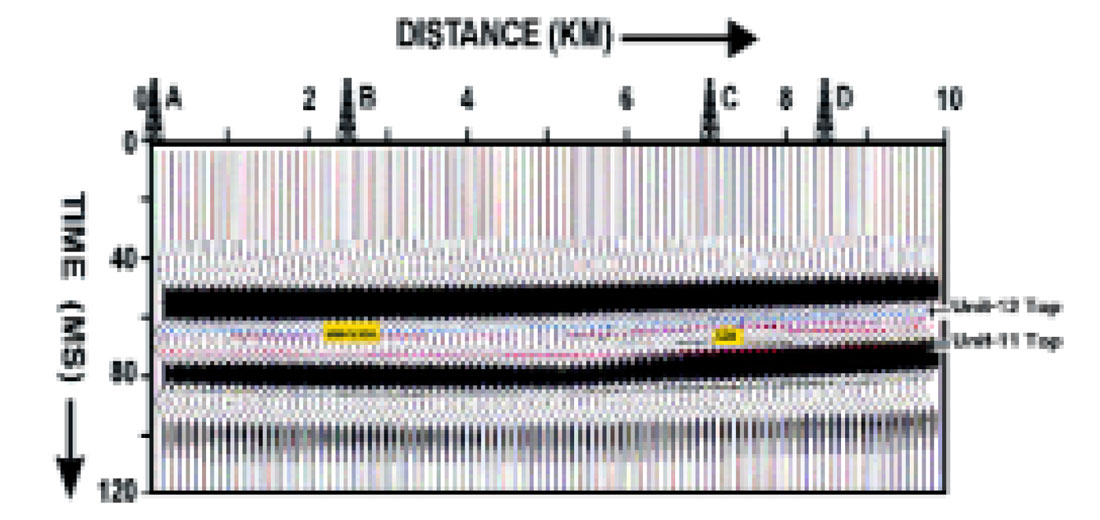
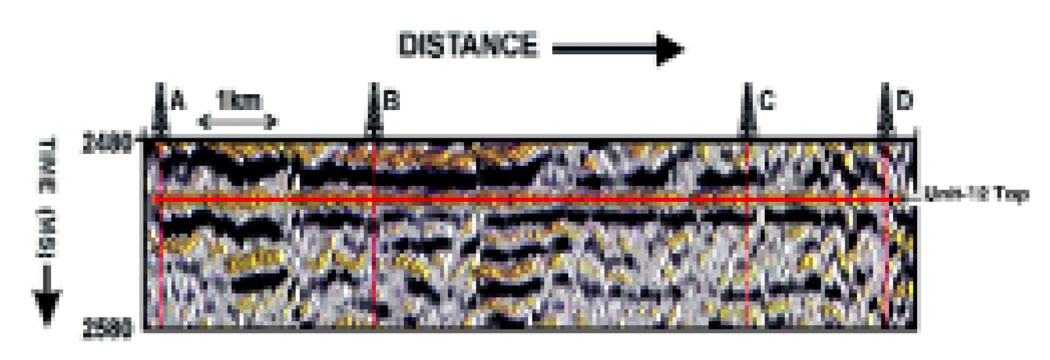
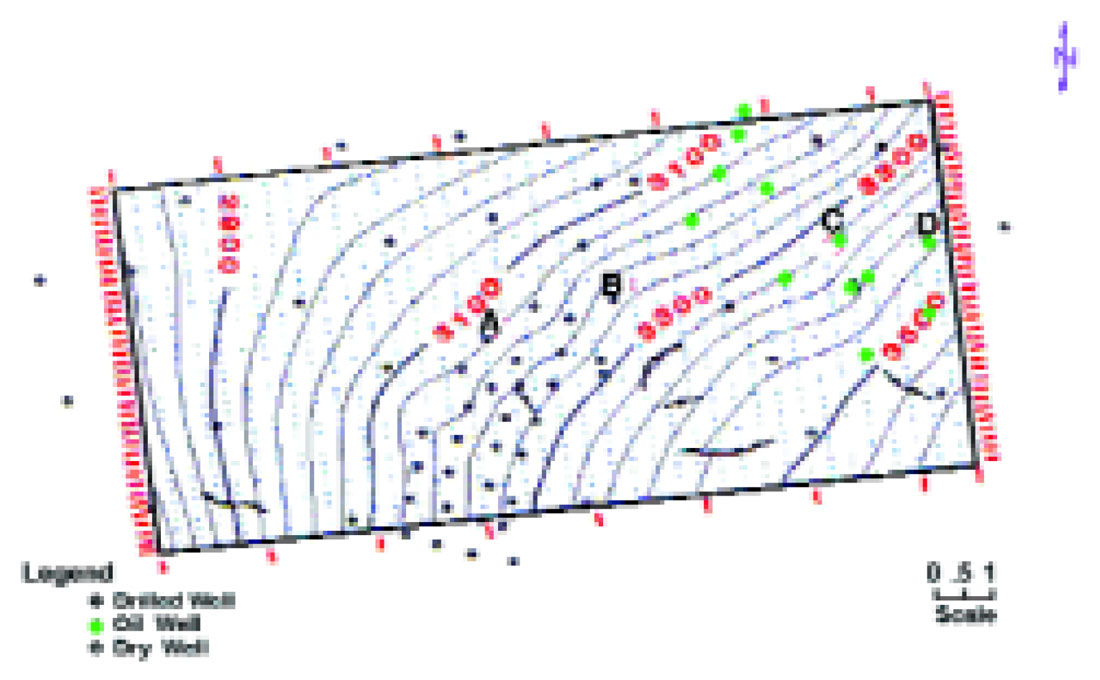
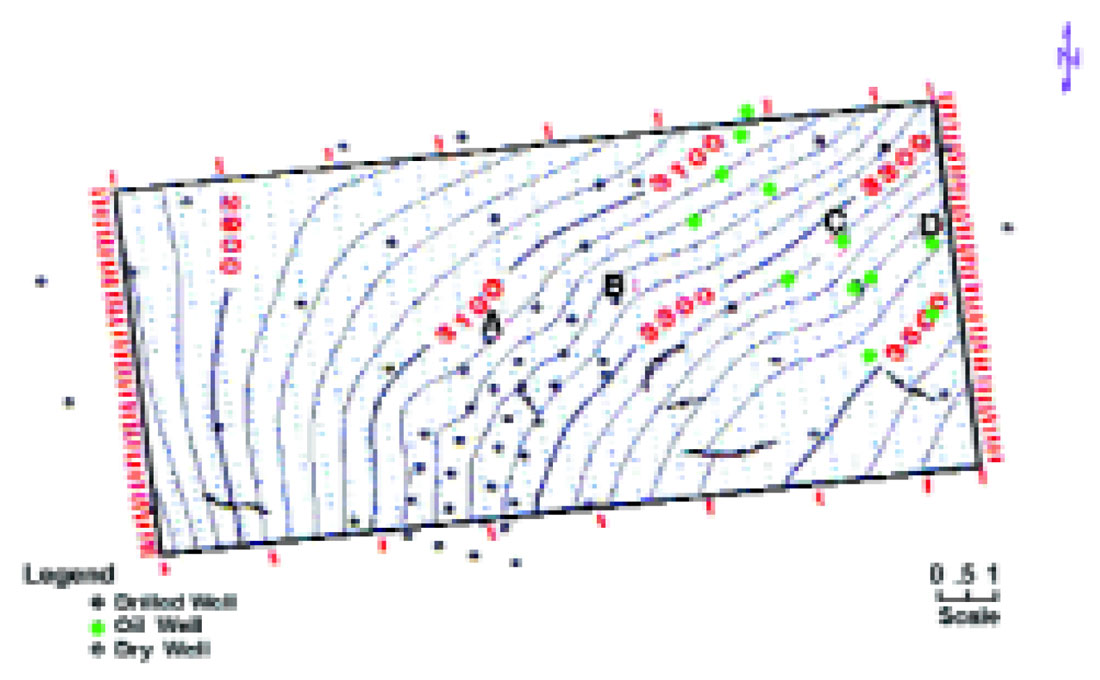
Calibration of well log and 3D seismic data has been done by using sonic and density logs of well-C. As per reflection coefficient series derived from these data, unit-12 top gives positive reflection coefficient and has been recorded as a negative number in the available seismic data. In normal display polarity, the composite response of unit-12A, B and C is plotted as trough (Fig.6). The thickness of unit- 12 encountered in the drilled wells is below the tuning thickness. These sands are having interval velocity in the range of 3600- 3700m/s. The computed tuning thickness (x/4) for these sands ranges from 25-30m. The pay sand unit-12A is not resolved but its seismic response has been embedded in the trough generated corresponding to unit-12. This has been further confirmed by synthetic seismic modelling along the geological cross section passing through the wells A, B, C and D. It is also observed that due to development of unit-12A the amplitude of trough has increased in synthetic as well as in real seismic data (Fig. 7A , B and C). Structural interpretation corresponding to unit 12 top was carried out. Structurally, unit 12 is monoclinally dipping towards south (Fig. 8 A and B).
Seismic Attributes Computation, Integration and Reservoir Mapping
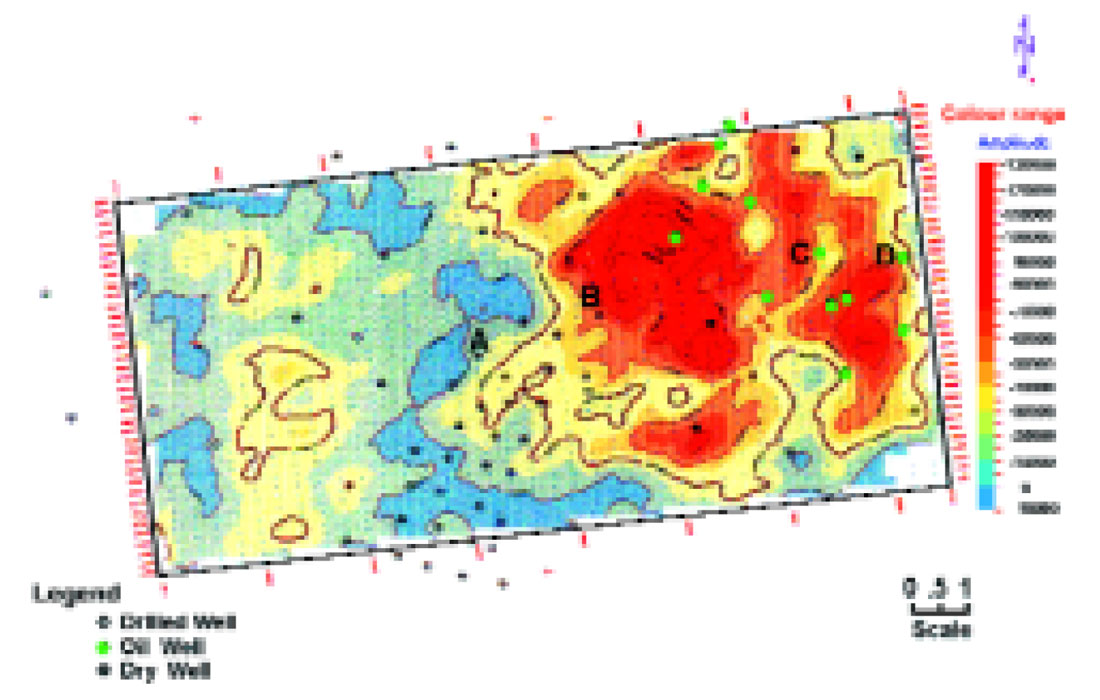
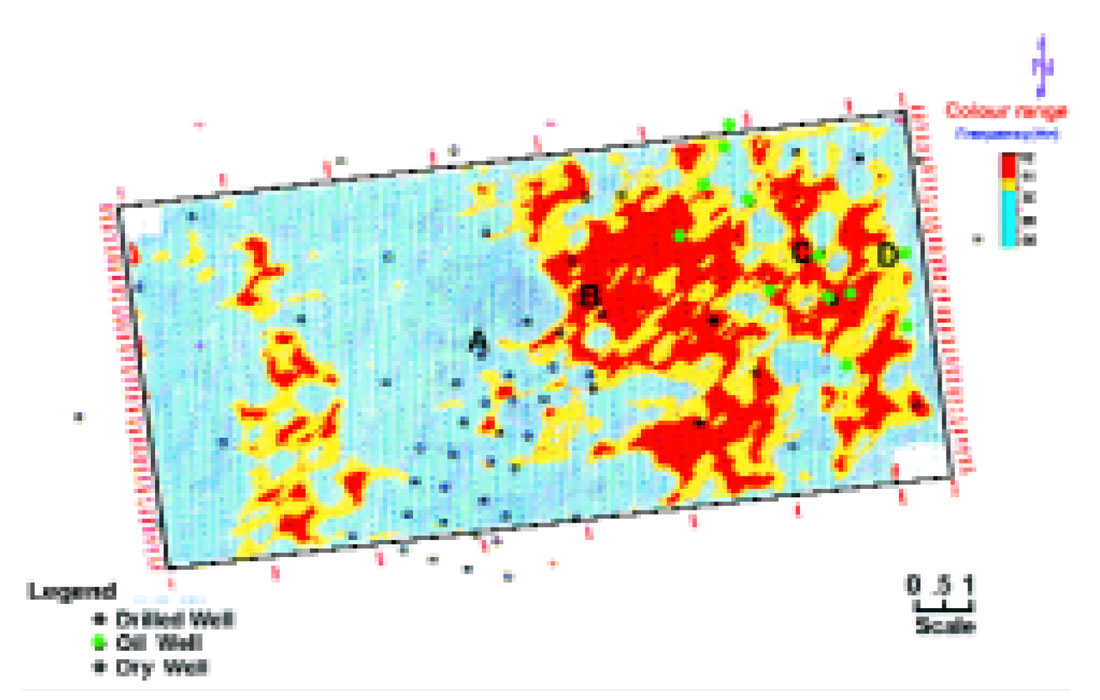
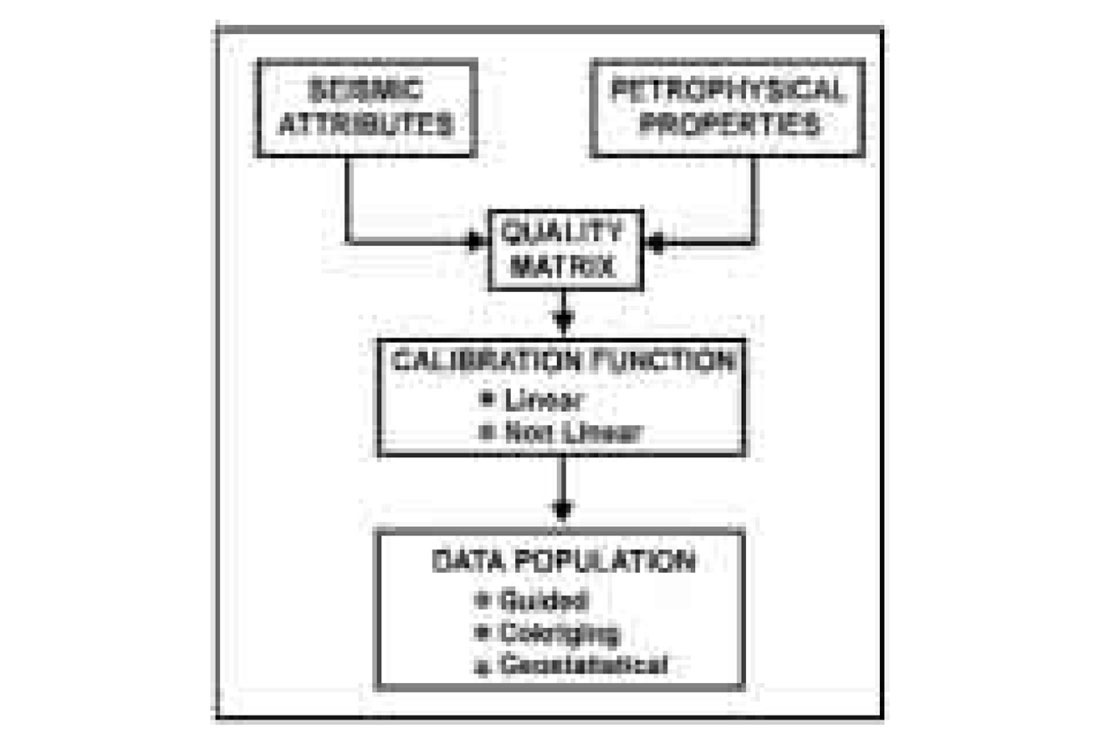
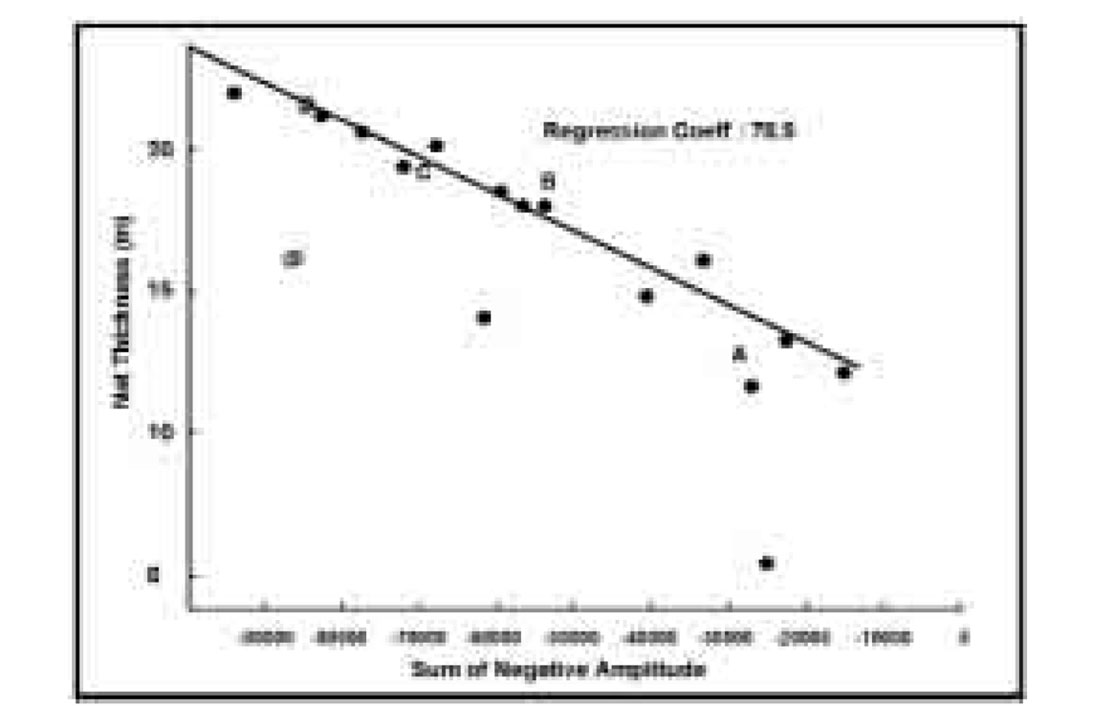
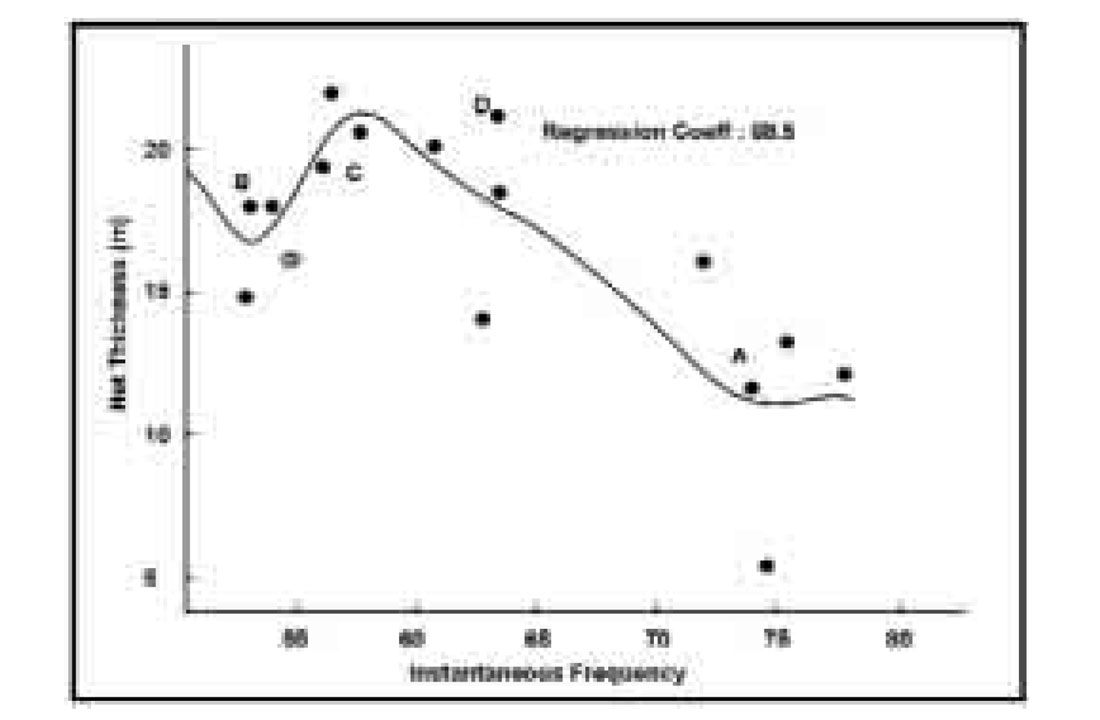
Sum of negative amplitude and average instantaneous frequency attributes have been computed in a 10 msec window corresponding to unit-12 from 3D data volume (Fig. 9 and 10). Eastern part of the area shows higher amplitudes and lower average instantaneous frequencies. This conforms with the higher net thickness of unit 12 as observed in well data. Although, similar characteristics of seismic attributes are present towards the western part of the area, these are ignored based on a priori knowledge of acquisition foot prints present in this part due to irregular offset distribution (increased number of near offset traces). A geostatistical relationship between net thickness of unit-12 encountered in wells and the extracted seismic attributes corresponding to that window has been established using artificial neural network technique. This includes cross plotting of log property and attributes, training of neural network and data population (Fig.11). The computed regression coefficient of cross plots between net thickness and attributes (sum of negative amplitudes and average instantaneous frequency) falls in the range of 65 to 80 (Fig.12a & 12b).
To avoid spurious correlation between seismic attributes and log property, a minimum number of attributes and a larger number of wells have been used as the probability of obtaining a statistically significant correlation between an attribute and a log derived property is directly proportional to the number of wells used in the calibration (Kalkomey, 1997). Cross plot between encountered net sand thickness and sum of negative amplitude shows a linear relationship. Increase in thickness is represented by higher negative amplitudes. Average instantaneous frequency shows a nonlinear relationship around well B. This behaviour may be due to the presence of a more homogeneous lithology resulting in lesser instantaneous frequency compared to wells C and D as observed in the well logs (Fig. 4). Training of the artificial neural network was done by using net thickness values of unit 12 sand and seismic attributes at borehole points. The training process allows the network to select sequentially from the candidate attribute pool and retain those attributes which improve correlation and discard those which do not. The training is allowed to proceed until set convergence criteria are met. Using a trained neural nonlinear function and kriging data population algorithm, a final net thickness map of unit-12 has been prepared which clearly brought out the geometry of unit-12 sand showing higher thickness in the north-eastern part of the study area (Fig.13). This finding is in conformity with the well data. Validation error has been computed by sequentially hiding the wells and it ranges from 5 to 10 percent of the net thickness observed at wells. Further, blind well testing was performed by retraining the neural nets from the beginning. Observation of well data indicates that wherever unit 12 is thicker, subunit 12A is present. Based on this analogy, a thickness map of unit 12 has been utilized for preparation of a thickness map of subunit 12A (Fig. 14). The sand geometry map of unit 12A shows two coalescing and north-south trending sand lobes having maximum thickness of 6m deposited by distributory channels in deltaic environment. This map shows a significant improvement over the earlier sand geometry map prepared from well data only. The new sand geometry map has brought out additional areas for exploration and exploitation of the pay which has been marked. The net thickness prediction of this study has been validated by subsequently drilling a well.
Conclusions
This study demonstrates the usefulness of integrated interpretation approach which incorporates seismic, well log and geological data for reliable reservoir mapping. For precise calibration and better understanding of the seismic signatures, synthetic seismic modelling has proven very useful. The integration of seismic attributes and well log data using artificial neural network technique has helped in the mapping of lateral extent and thickness of thin sand reservoir which is beyond the limit of seismic resolution. This precise mapping of reservoir sand geometry has shown an extension of the sand lobe towards the south and north east for further delineation of the oil pool. Thin sand layers encased in shales deposited under fluvial, marginal marine and marine environments are encountered in various fields of the Indian basins and significant amount of hydrocarbons are being produced from these reservoirs. Such type of thin reservoirs still hold a good amount of hydrocarbon reserves. Similar approach of integrated interpretation may be highly useful in the delineation of thin reservoirs in other areas of interest.

Acknowledgements
Authors acknowledge Oil and Natural Gas Corporation Limited, India for providing infrastructural facilities and granting permission to publish this work. Authors wish to express their sincere thanks to Mr. A.G. Pramanik, Executive Director – Chief Geophysical Services, Dr. C.H. Mehta, Group General Manager & Head GEOPIC, and Mr. Mahesh Chandra, General Manager for their valuable guidance during the preparation of this paper.


Join the Conversation
Interested in starting, or contributing to a conversation about an article or issue of the RECORDER? Join our CSEG LinkedIn Group.
Share This Article