Abstract
An effort is underway for building an open-source package (called SIA) for processing and analysis of a broad range of geophysical data, with emphasis on reflection/ refraction seismics. The package also represents a highly integrated framework for developing geophysical applications software using C++ and other languages. Currently, the package consists of a processing core extending the capabilities of a seismic processing system, graphical interface, and customizable 3D OpenGL visualization server similar to those used in seismic interpretation. These three components operate in parallel on a distributed computer grid and communicate via the Parallel Virtual Machine. Interfaces to other popular academic packages, and in particular to Seismic Un*x and Generic Mapping Tools were developed. Additionally, through its operating remotely as a web service, SIA offers ways to build collaboration tools on the web. The package also includes a unique code distribution system which provides its simplified installation and automatic updates.
Introduction
Because of its critical importance for modern data acquisition and analysis, geophysical software development has grown into a major industry. Many companies, from majors such as CGG, Landmark, and Schlumberger to numerous smaller vendors provide software solutions and services for numerous applications. Traditionally, geophysical software has been highly specialized for certain applications (e.g., field QC, reflection seismic processing, modeling, or interpretation). However, with growing concentration of computational power, the present and future trends in geophysical software are clearly for re-integration, allowing a researcher instant access to the entire data analysis and interpretation. Another important trend is the explosive growth of opensource software developed and supported by the community.
Our package, called SIA (http://seisweb.usask.ca/SIA) has grown from a diversity of tasks encountered in an academic data analysis and inversion, and by design, is not limited to any of them. Since its inception in 1995, it was used to process reflection, GPR, and crustal-scale wide-angle seismic data, to create 3D, migrated Receiver Function images of the Earth’s upper mantle, perform travel-time modeling and inversion, process seismic records from nuclear explosions, and recently – to manage a regional seismographic network, to process gravity and air-magnetic images, and even to provide web data services. Started initially as a multi-component interface for CogniSeis Disco seismic reflection processing package, the approach proved to be quite unique in its broad scope covering the full spectrum of geophysical data analysis.
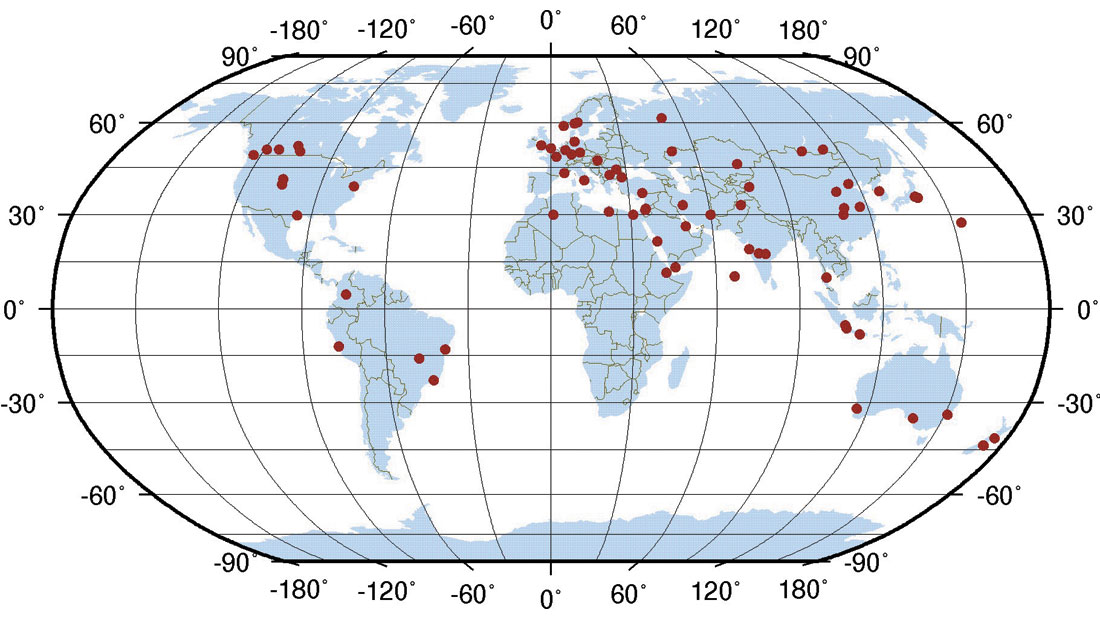
The open source model is important for rapid exchange of ideas, development, and response to the needs of the community. The success of open source software in recent years has demonstrated that it can meet and from many aspects exceed the quality of commercial solutions. With fast development cycles and code contribution directly from users, new features can be quickly implemented and vetted. This has been particularly well demonstrated by the community development centred on the GNU/Linux operating system. The demand for versatile open-source geophysical systems is high – note that in just nine months fro m November 2006, we served over 190 requests for SIA downloads (Figure 1).
In reflection seismics, many consultants and academics use and write code for Stanford Exploration Project (SEP) and particularly Seismic Un*x (SU) systems because of their maturity, openness, and low cost. These systems are adequate for many single-channel applications; however, in more complex tasks, they are strongly limited by linear, UNIX file-stream based design and only basic user interfaces. Matlab (with its free equivalent, Octave) is another popular solution because of its rich toolbox, readily available graphical tools and the ease of developing new processing code. However, Matlab often shows prohibitively poor performance in real data processing problems and requires extensive programming expertise for operation.
SIA system stands out among its counterparts in several respects. It is an open-source solution that endeavours to ultimately provide a comprehensive processing/ interpretation solution for the geophysical industry and academia. It provides efficient, dynamically-linked common address space operation (similar to Disco and Promax, and unlike SEP or SU), with significantly richer and customizable data structures and tool interoperability. Its code integration and C++ programming flexibility are similar to those of Matlab. It allows several types of code parallelization and includes libraries and tools for managing multi-processor processing environments. Further, it has a parallel graphical environment with a tightly integrated user interface and customizable 3D data visualization based on cross-platform Qt and OpenGL libraries. Recently, tools for real-time data input and seismographic network management were also added to it. It also has a unique capability of operating remotely, as a web service, and an automatic software distribution and updating service (http://seisweb.usask.ca/SIA/cs.php). These components were described in previous publications (Morozov and Smithson, 1997; Morozov, 1998; Chubak and Morozov, 2006; Morozov et al., 2006; Morozov et al., in review; Morozov et al., 2007). In this paper, we overview the key features that may be of most interest to geophysicists and software industry.
(Not only) Seismic processing system
SIA currently is a nearly complete seismic processing system, with many tools reaching to the broader geophysical applications (Chubak and Morozov, 2006). The current system scope includes reflection, wide-angle, and to certain degrees earthquake seismology, 2- and 3D potential field processing and inversion, PostScript and interactive graphics. Nearly 200 dynamically-linked plug-in tools are closely integrated with a content-agnostic processing monitor and often between each other forming sub-packages, such as graphics, AVO, or Artificial Neural Networks. Almost any type of data can be handled by the system making it possible to merge multiple data types.
The system was originally a replacement of Disco reflection seismic processing system, and it still supports Disco-style job scripts, with several extensions (see job examples at http://seisweb.usask.ca/temp/examples). Tools written for Disco can also be incorporated, with virtually no modifications.
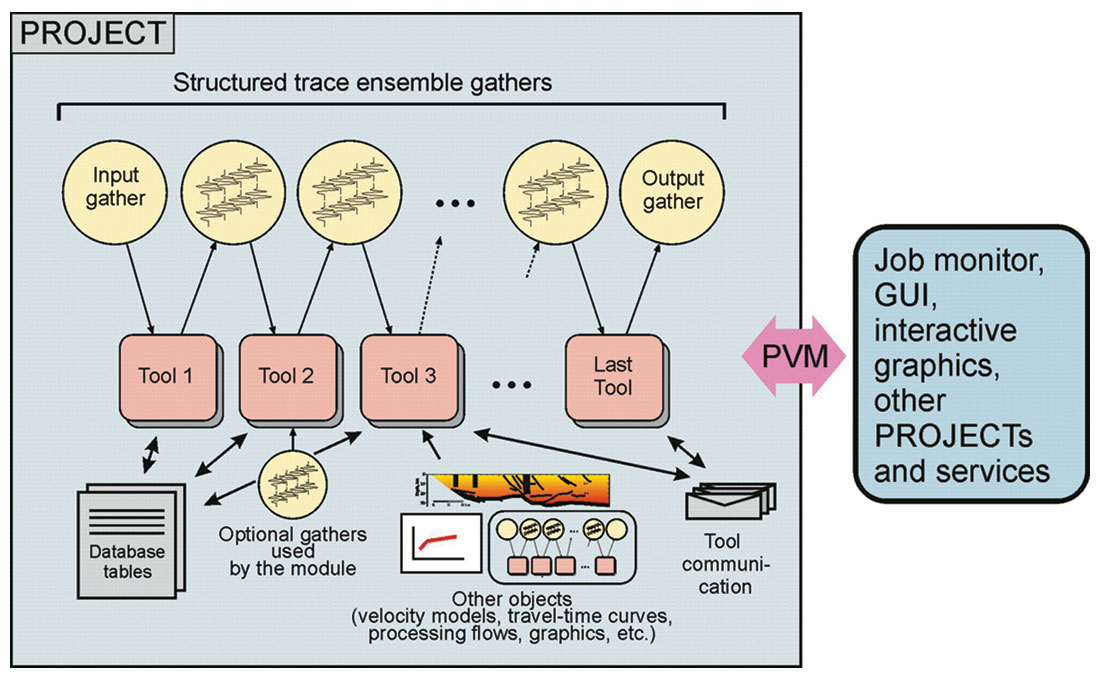
The key components of the system (the GUI, processing flows, visualization and display tools) operate asynchronously and communicate through a Parallel Virtual Machine (PVM) interface (Figure 2). Because of the use of PVM, the many components of SIA can be distributed, allowing, for example, to distribute the processing load or for the visualization program to operate on one or several dedicated computer systems.
Processing concept
The central concept of SIA is the abstract “processing flow” representing a logical sequence of data manipulation or modeling steps performed by “tools” connected by structured “trace” data buffers (Figure 2). The sequence is recursively invoked in reverse order, more resembling the mechanism of logical inference than data processing (Morozov and Smithson, 1997). Note that the flow contains no mechanism for data propagation (this is done entirely by the tools), and thus no assumptions about the data types or character of processing is made. As an example, the system can take a random walk through a 3D seismic dataset (Morozov, 1998). Flows, as well as data traces and many other objects can be transmitted across the PVM connections (Figure 2) to potentially form a complex, parallel processing environment.
On top of this abstract processing model, the following features further enhance the flexibility of the system:
- “Trace records” (Figure 2) can be of variable data formats, sampling intervals, record lengths, and time starts. They can contain linear arrays (seismic records) or 2- and 3D arrays representing multicomponent seismic records, or 2D grids used in potential-field processing. However, traces are not required in order for the system to operate.
- Other types of data are broadly used and often introduced by new tools (Figure 2): velocity models, travel-time curves, database tables, Artificial Neural Networks, inversion engines, and various graphical objects.
- User-defined “trace headers” can contain variables of any types (as in Disco or ProMAX, and again unlike SU), but also arrays, references to databases, and functions allowing, for example, “on the fly” computation of midpoints and azimuths based on the endpoint coordinates.
- “Tool” parameterization is unusually flexible and uses trace headers, database fields, symbolic text substitutions, and UNIX command-line parameters interchangeably with constants. Many tools support structured parameterizations allowing, for example, to design custom graphical user interfaces (GUIs) or build composite PostScript plots. Tools can be represented by binary codes or macro-commands combining other tools, with coherent parameterization and optimized for a particular task.
- Some tools may not participate in the flow (Figure 2) at all but instead provide services to other tools. For example, the AVO tool can compute Zoeppritz reflection coefficients or Elastic Impedances for plotting, by using models generated by the tools producing waveform synthetics.
- In all geometry manipulations, the system is aware of the Earth’s shape, with several ellipsoidal approximations or Cartesian coordinates to choose from.
- All processing flows can operate from the user’s GUI or from parameterized batch scripts allowing execution of complex, unattended, self-documented processing sequences.
Graphical User Interface
Constructing processing flows is greatly simplified by a modern GUI which also provides the utilities users expect from commercial software, such as project management, process monitoring and control, search, and extensive context-sensitive help (Figure 3). The GUI is based on the cross-platform C++ Qt libraries from Trolltech, so that SIA can be ported to a variety of operating systems, such as Linux, Solaris, or even OS X with only minimal effort. In a grid or cluster environment, its configuration is also done from within the GUI by specifying the nodes on which a particular flow and its components (subflows, I/O, display tools) is to be run. This allows multiple processing jobs to be ran in parallel on either a Beowulf cluster or distributed over a peer network.
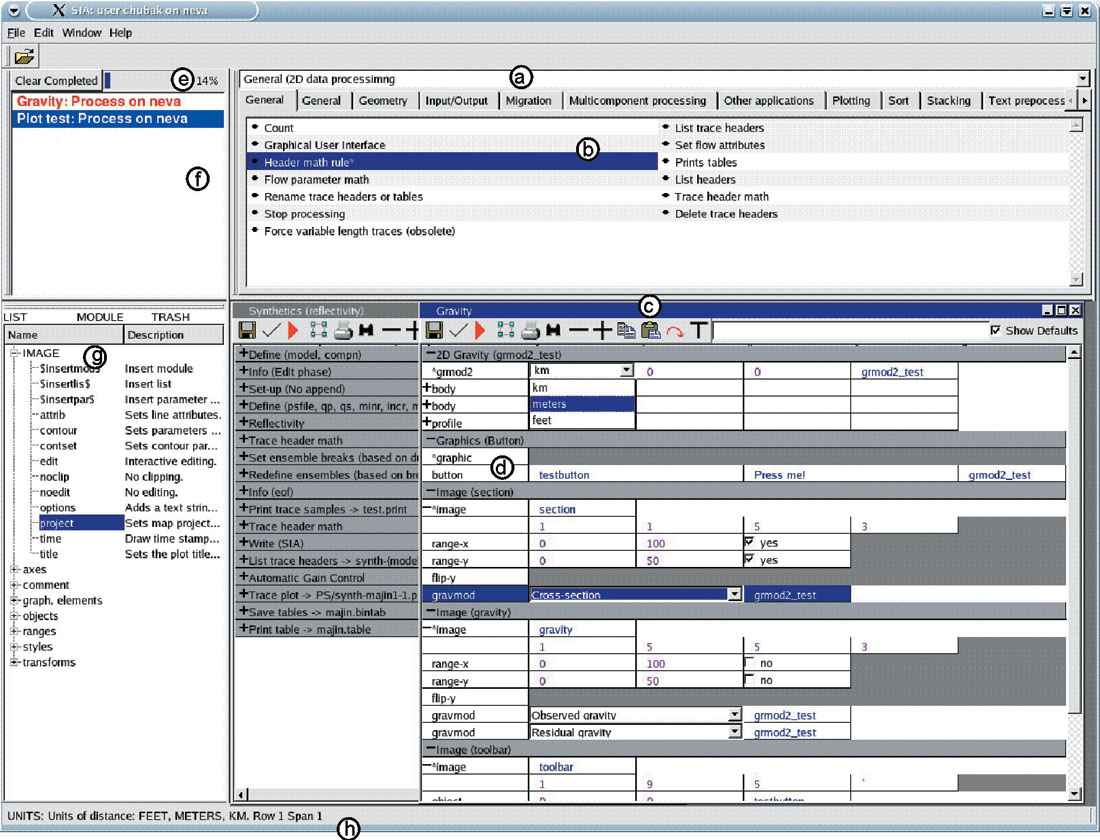
Tool names in the GUI may be context-dependent and showing summaries of their parameters (Figure 3). Tools can also communicate the changes in their parameters during run time (e.g., from interactive editing by the user), which would be displayed and saved on closing the job.
OpenGL/Qt 3D/2D display server
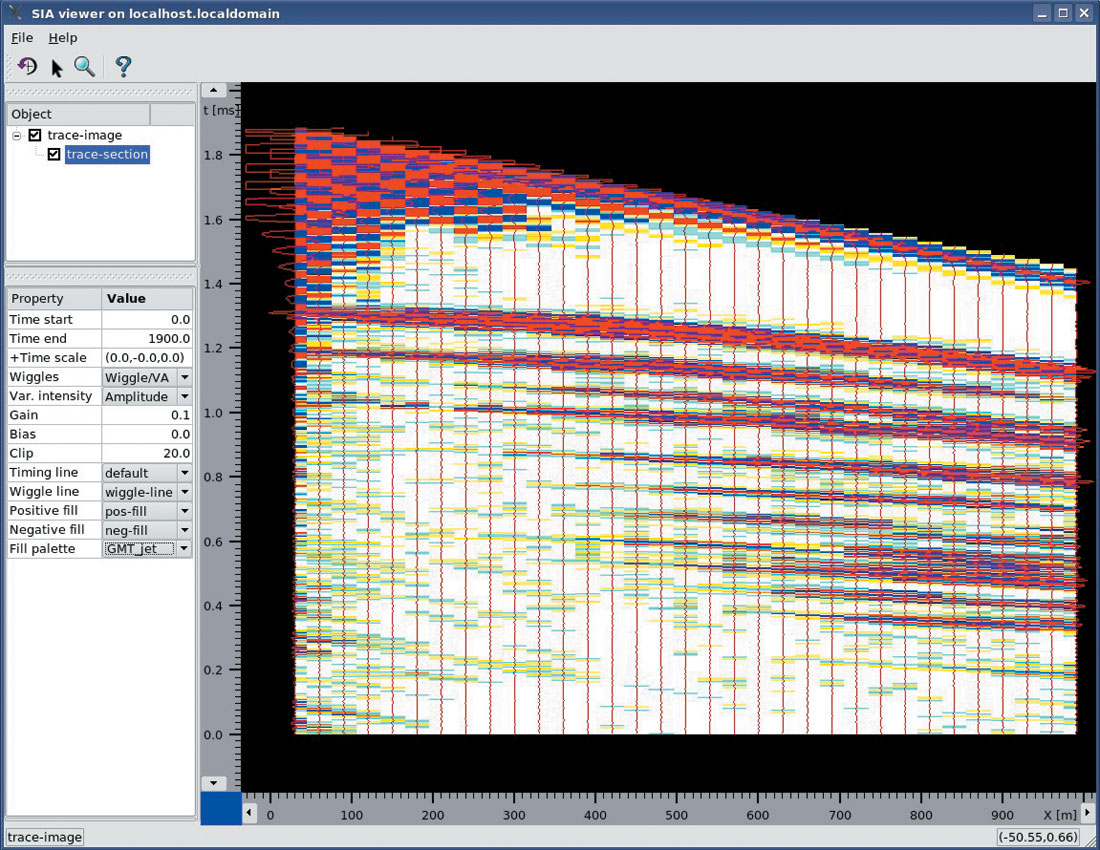
Visualization and interaction with the data is a key to many data analysis tasks. Traditionally, geophysical software packages have been differentiated into “processing” and “interpretation ” systems by the role of interactive visualization in them. Processing systems emphasize flow-based design (Figure 2), with special emphasis on reproducibility of the results and batch (unattended) execution. By contrast, interpretation systems are visualization- centred and based on data viewers (such as OpendTect, http://www.opendtect.org/). In such a system, the data organization follows spatial patterns, and system operation is mostly driven by data displays and user commands. Application of various “plug-in” tools is typically determined interactively by the user, and only a limited number of fast operations can be performed in real time.
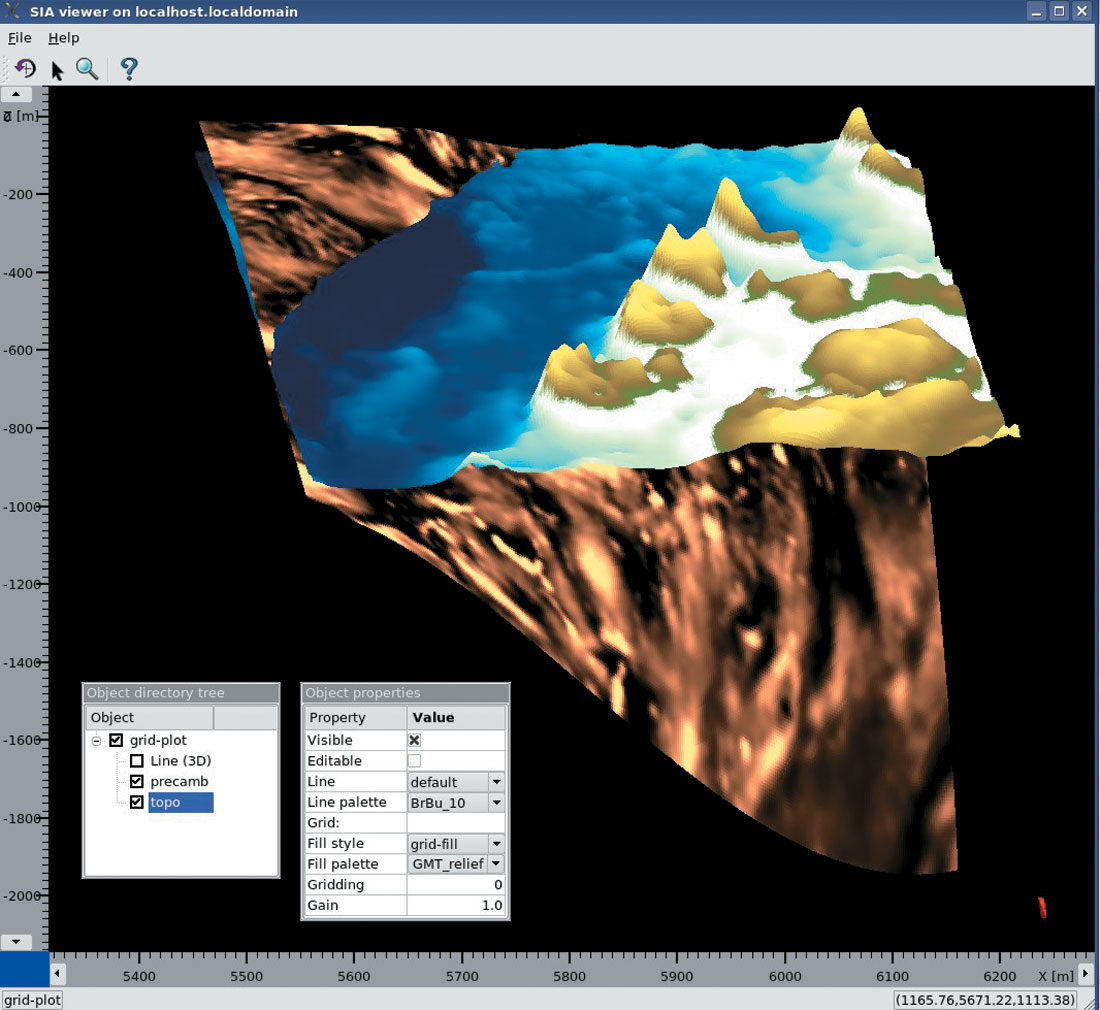
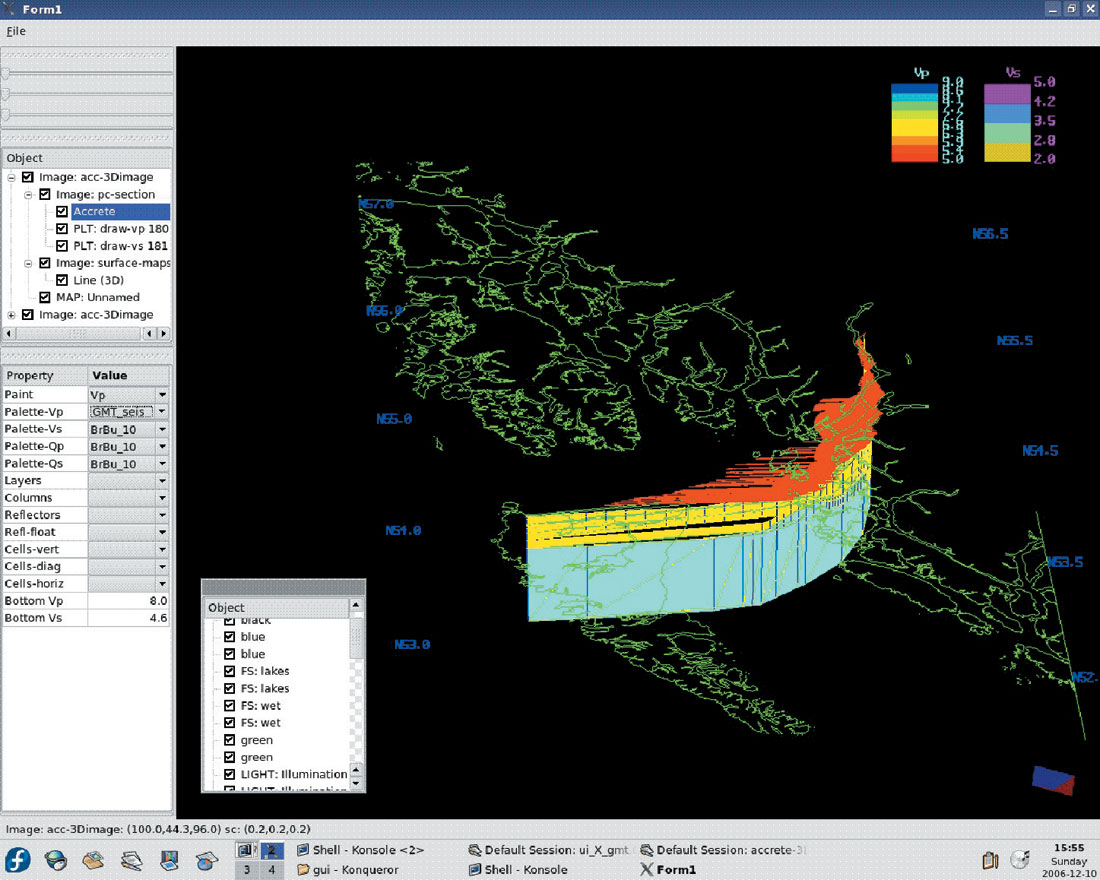
In our visualization approach, we endeavour to erase the above differentiation between processing and interpretation workflows and perform them on a common software base and user interface. Some examples are shown in Figures 4-8. By combining tools from the graphics package, complex images and user interfaces can be defined by the user as parts of SIA data processing flows. These images can then be rendered either in publication-quality PostScript (using the interfaced GMT programs; Wessel and Smith, 1995) or by using an interactive OpenGL-based SIA display server. Because the content of the display is entirely determined by the underlying processing, the display server can implement any functionality, such as displaying seismic data and performing potential-field modeling and visualization (Figure 4), seismic ray tracing (Figure 5), and computing waveform synthetics (Figure 6) in the same session. Through direct access to GMT databases, the server is also able to include 3D coastline base maps in its displays (Figure 5). In addition, full seismic and other data processing capability is also available to the interpreter through the underlying flow-processing capability.
The visualization system is entirely controlled by the processing flows and is able to render a variety of basic data types including:
- Seismic traces with adjustable settings and arbitrarily positioned in 3D (Figures 6-8).
- Lines and surfaces with variable styles, colours, markers, etc.
- Bitmap-style graphics rendered on any plane oriented in 3D.
- Customizable line styles, colours, colour palettes, axes bars, labels, push-buttons, sliders, etc. (Figure 5).
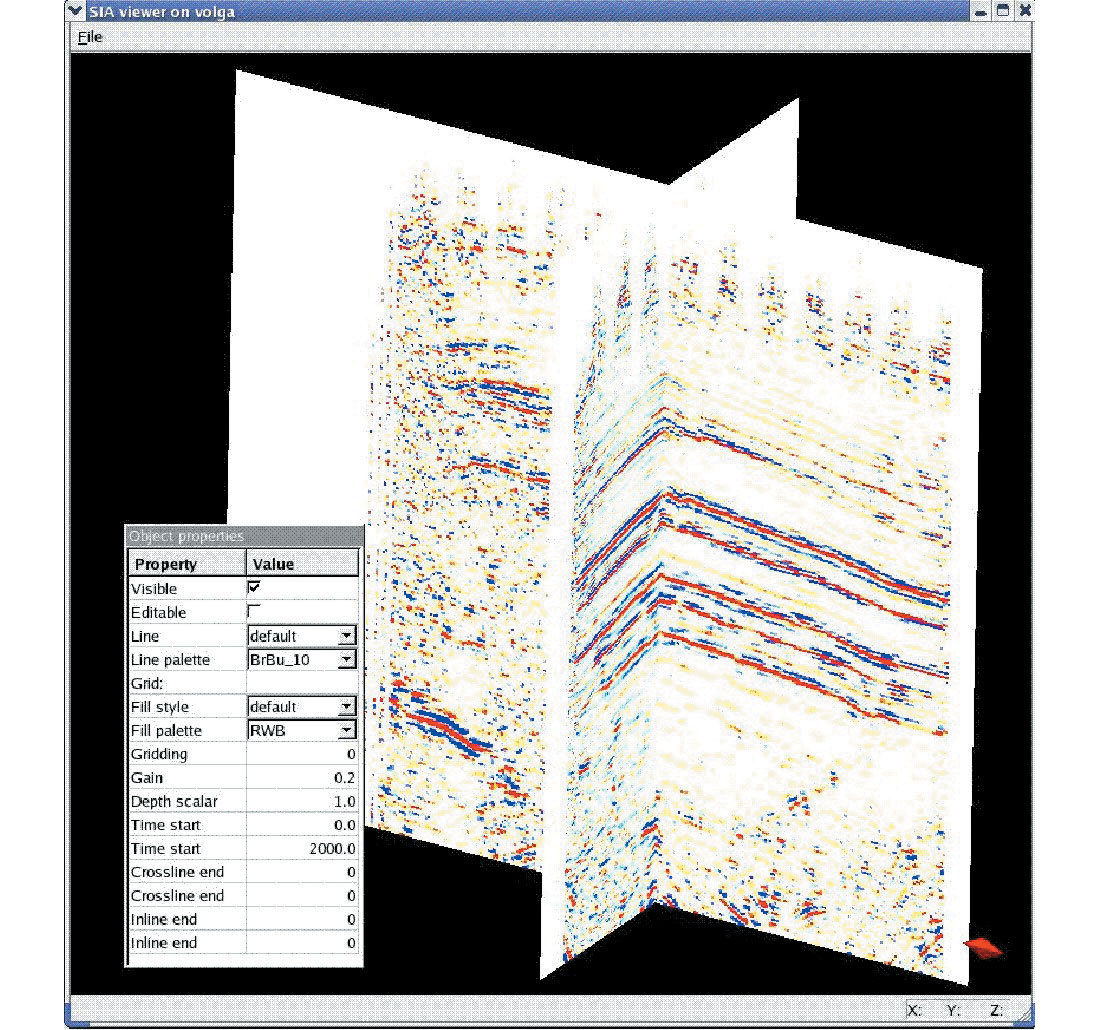
Complex objects (such as velocity and gravity models) are composed of the objects above by the corresponding tools. In addition, user-specified coordinate transformations are available, so that images can be rendered on arbitrary surfaces. This allows, for example, drawing 3D seismic fence diagrams or various displays on the topographic relief or on the surface of ellipsoidal Earth.
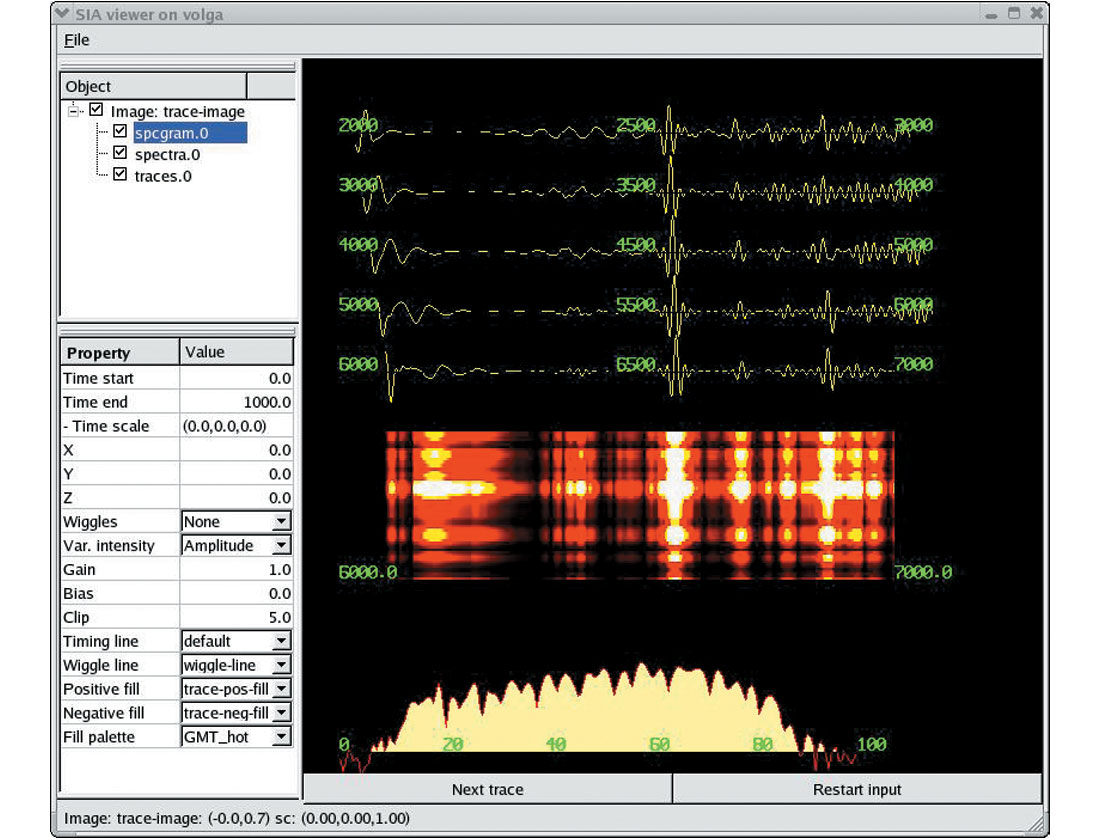
The display server operates in parallel on the same or different (optionally, multiple) computer hosts. While interacting with the user, the server also communicates with its master processing flow, causing it to take the appropriate actions. For example, Figure 7 shows an implementation of real-time network data input control for a remote Internet seismograph (Morozov et al., 2007). The buttons (bottom of Figure 7) are used to control the data input by the master flow performing the seismic network monitoring.
Integration with popular open-source software
Open-source and open data format design encourages mutual software integration. Several popular academic applications proved to be particularly useful in our work, and they were integrated with the SIA system using specialized tools:
The Seismic Un*x (SU) (http://www.cwp.mines.edu/cwpcodes/) is a free and complete seismic reflection processing system broadly used at the academia and by consultants in the industry. It was incorporated virtually entirely by means of SIA tools allowing running SU processing pipes in (remote) parallel processes and exchanging the seismic traces via PVM connections. In addition, several SU codes were “wrapped” into SIA I/O interfaces making them fully compliant with the system. In both cases, the SU tools gained the advantage of the GUI, extended graphics, a more powerful user interface, parallel processing capability, and code maintenance services.
The classic reflectivity (propagator matrix) approach for modeling elastic wavefields in 1D, layered models was included in both K. J. Sandmeier’s (Fuchs and Muller, 1971) and Kennet’s (1993) implementations. These tools are important parts of the emerging AVO package. Both tools have identical model descriptions and output 3-component synthetic seismic traces directly into the job flows (Figure 6). The first of these programs was also parallelized for operating on a Beowulf cluster, and is also capable of plotting the models and tracing travel times in them.
3D, parallel, visco-elastic finite-difference modeling (Bohlen, 2002) was revised for encapsulated PVM inter-process communication and integrated with the GUI. Currently, work is underway for providing an accurate topographic free-surface condition, 3D model visualization, and interactive model building.
The application plotmtv (http://www.phy.ornl.gov/csep/CSEP/CORNELL/TUTORIAL/PLOTMTV/OVERVIEW.html) is a fast multi-purpose plotting program for visualization of scientific data in an X11-window environment, which also produces useful PostScript graphics. We created a seamless interface for this application and use it to view database tables and seismic traces. We also bundle plotmtv into the standard SIA distribution.
The Generic Mapping Tools (GMT) is a collection of ~60 UNIX tools for high-quality geoscience PostScript graphics, and particularly maps (see example in Figure 1). It was incorporated as one of the rendering “drivers” in the SIA graphics system. In addition, the display server is also able to access GMT georeference databases directly and rendering them in full 3D using OpenGL (Figure 5).
Rayinvr (Zelt and Smith, 1992) is a popular travel-time modeling and inversion program for wide-angle seismic data. It was incorporated by creating model and travel-time editors, introduction of corrections for crooked-line and ellipsoidal- Earth geometries. Work on interactive ray-tracing in true 3D geometry is underway (Figure 5).
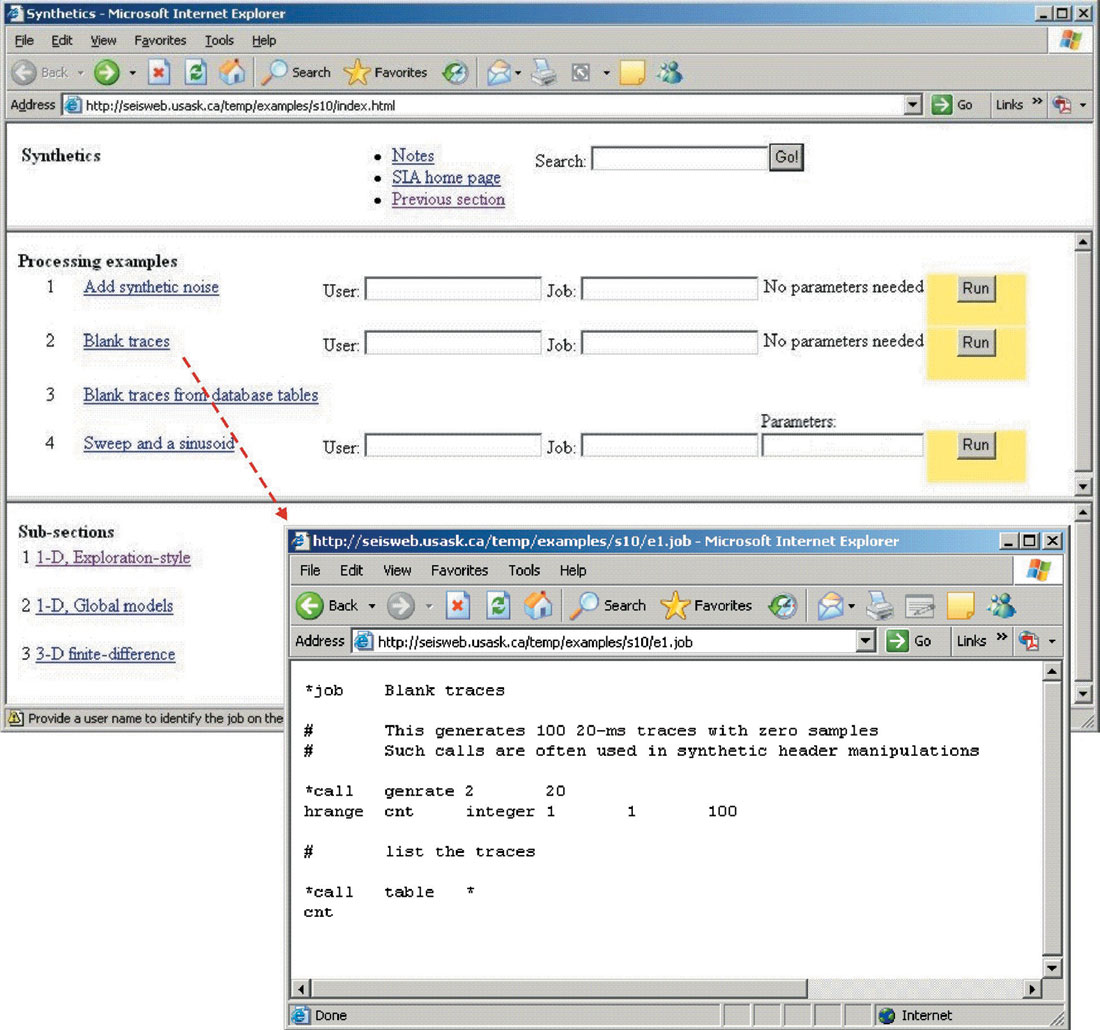
Data processing and modeling web services
SIA is also apparently the first seismic processing system to operate as a web service (Morozov et al., 2006). A standard distribution installed on a system accessible via HTTP (e.g., http://seisweb.usask.ca/SIA/ps.php) can receive processing jobs, execute them and return the results, currently in the form of web pages or files ready for download (Figure 9). The content of this processing is entirely controlled by the client. The client is even able to upload web forms on the server and associate them with processing jobs, thereby creating custom web data or processing services. This approach was utilized to generate a library of SIA processing examples, some of which a re also executable on-line (Figure 9; also see http://seisweb.usask.ca/temp/examples/).
Development framework
From its inception, SIA was not intended as a complete product to serve a specific narrow task, such as reflection seismic processing (Morozov and Smithson, 1997). Instead, the design goal was to provide an extensible framework capable of supporting nearly any type of geophysical data processing, modeling, or interpretation. However, due to the character of its previous applications, most of SIA toolkit development was so far related to seismology.
The system allows its users to rapidly add new functionality with a minimal effort. Two principal features simplify the development within SIA. Firstly, new modules can be added to perform custom data processing while taking advantage of other tools and extensive C++ class libraries, including Qt and OpenGL graphics. Secondly, tool interactions, aided by the GUI, effectively transform Disco-like job scripting into a model- and process-description language. Custom interactive graphical applications can thus be created by simply designing processing flows and without any “serious” computer programming.
New tools can be coded using a mixture of C, C++, FORTRAN, and even Pascal or Java. At the University of Saskatchewan, graduate students routinely write new processing modules for class exercises and also to further their research. In our experience, a reasonably complex tool can be completed in only a few days. Templates have been created to aid in the development process, and a complete set of compilation and linking tools are provided. New modules are integrated with the system by the maintenance utilities so that they become available from the graphical interface and provide fully functional context-sensitive help to the user.
Automated documentation, code distribution, and collaboration tools
Given its role as a development framework, the central theme of SIA in the recent years has actually been code and documentation maintenance. With about 600,000 lines of tightly integrated code, special efforts are required for facilitating development, maintaining user documentation, and performing system integration and testing. Most of these services are wrapped into a single utility sia-update, which can be used to compile system libraries, tools, the GUI or display packages, and test them. The utility also creates user’s and programmer’s documentation (http://seisweb.usask.ca/SIA/index/), posts examples, and creates new user setup. First-time installation or update from a remote distribution can be performed by a single call to sia-install utility, which can be obtained from the SIA installation page at http://seisweb.usask.ca/SIA/doc/install.html.
To aid in decentralized collaborative development, SIA offers an automated code distribution system (http://seisweb.usask.ca/SIA/cs.php) modeled after open-source projects such as apt-get and yum. Each installation may configure a list of repositories which will be checked for updates to currently installed or new tools. If updates are available, the user is notified through the GUI and is provided with their descriptions. When an update is selected for installation, the source code is downloaded from the server and compiled on the local system. The entire process is automated and controlled from within the GUI, or it can be performed from a command line. By downloading source codes rather than binaries, the system is able to share tools across many supported architectures. Further, the code is compiled optimized for the hardware it is running on (i.e. AMD, Intel, or PowerPC) ensuring the best possible performance. The ability to install and update code is restricted to “administrative” users, which may be useful where there is a single installation for a number of users.
Well-supported open-source code standardization could allow multiple developers to collaborate by sharing the codes in a consistent, reliable, and architecture-independent manner. SIA accomplishes this by allowing any installation to be used for code development and also to function as a code server (if a standard web server, e.g., Apache, is available). In such a way, source codes developed locally become immediately available for installation on all subscribing systems. Finally, the author of a new tool can arrange for automatic “bug reports” related to that tool to be received by the code web service above.
Conclusion
SIA appears to be the most full-featured seismic processing system which could be of interest to researchers in both academia and industry. Its strengths are in its unique processing concept, broad scope, modern interface, robust core, very general visualization system, and parallelization capabilities. Since new ideas in seismic processing constantly require new software, SIA is optimized to serve as a concurrent development framework allowing new processing tools to be rapidly developed while leveraging the existing code and graphical utilities to dramatically reduce the time and effort required. The display system seamlessly handles both 2D and 3D data while offering some unique features and allowing extensive customization by the user without the need for programming. A code update and distribution system provides easy and automated access to software updates and allows developers to share their work without the need for installation or maintenance utilities.
As a closing remark, note that unlike the FreeUSP, GMT, SEP, Seismic Un*X, SIOSEIS, and of course their commercial analogs, practically everything of the above was accomplished without any financial support. The development was carried out in support for different projects in several areas of geophysics, united with a firm belief that the software can and shall be well-designed, integrated, re-used, and shared.

Acknowledgements
We thank Spectraseis AG (Zurich., Switzerland) for their support of the development of the real-time package components (Figure 7).


Join the Conversation
Interested in starting, or contributing to a conversation about an article or issue of the RECORDER? Join our CSEG LinkedIn Group.
Share This Article