In light of recent induced seismicity, there is a renewed interest in understanding the seismic setting of the Western Canadian Sedimentary Basin (WCSB). While the observation of induced seismic events is not new to the WCSB (e.g., Wetmiller et al., 1986; Horner et al., 1994; Baranova et al., 1999; Schultz et al., 2014), the observation of hydraulic fracturing induced earthquakes (e.g., BC Oil and Gas Commission, 2012; 2014; Schultz et al., 2015b) has become a point of concern for research, industry, regulators, and the public. As part of their mandate, the Alberta Geological Survey has been cataloguing earthquakes within the province as far back as 2006 (Stern et al., 2013). Concerns about induced seismicity have prompted the installations of 8 new broadband seismic stations in an effort to bolster the effectiveness of the Alberta Geological Survey earthquake catalogue.
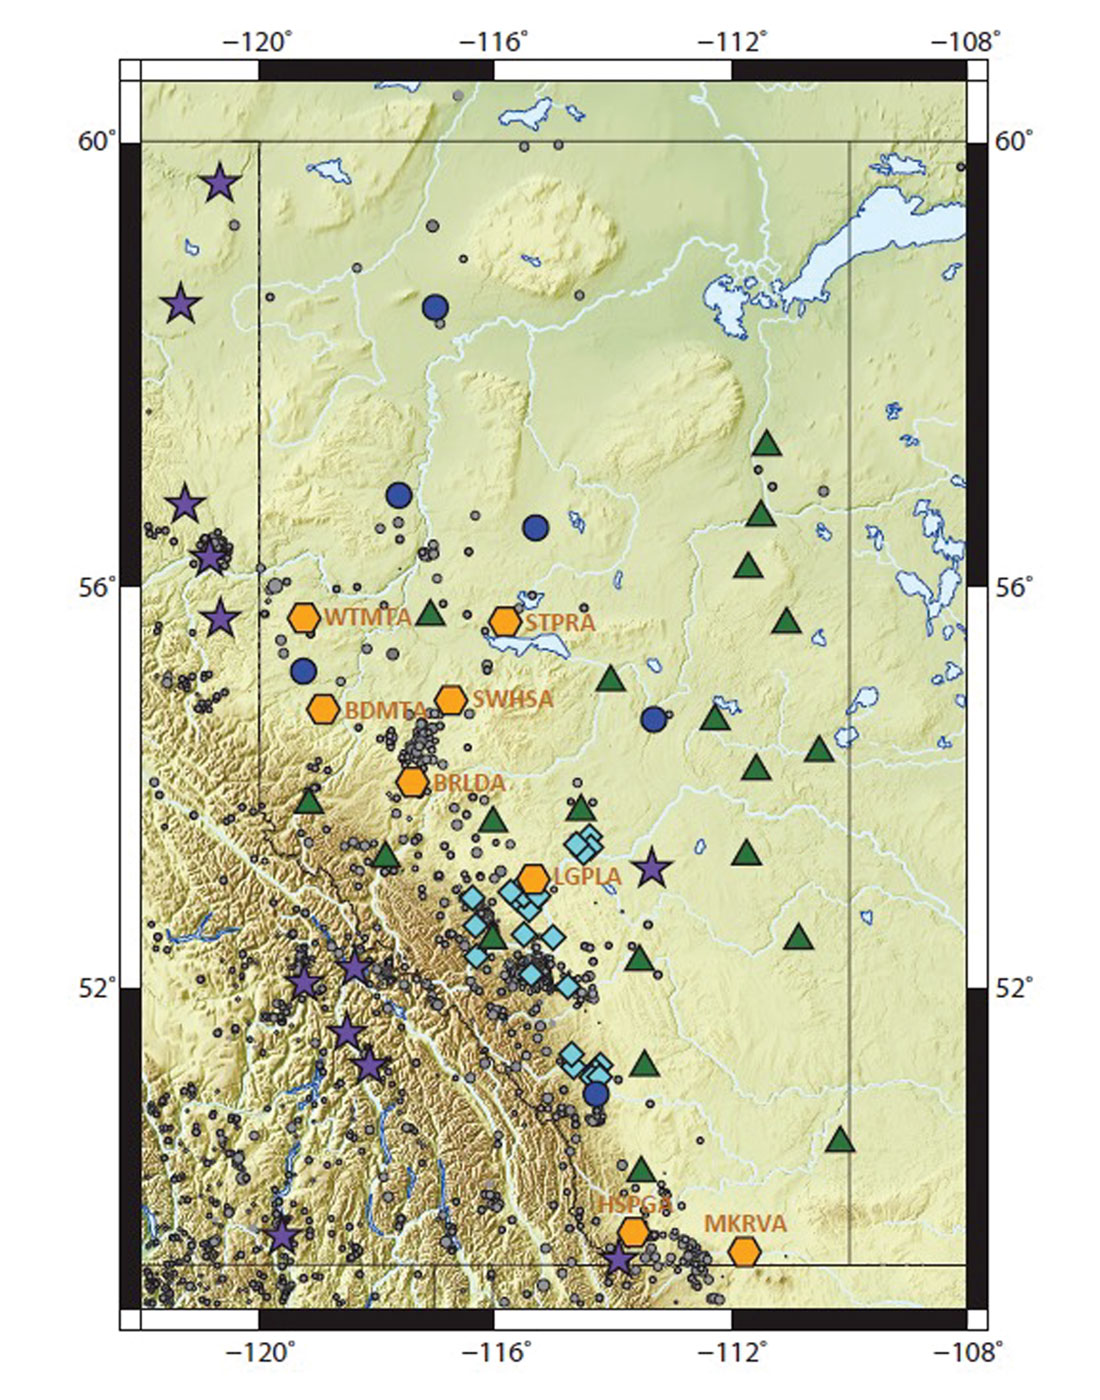
In general, it is well understood that the effectiveness of an earthquake catalogue depends strongly on the station geometry and ambient noise levels that are encountered at the contributing seismic stations. In Alberta, a number of seismic networks have set up to monitor seismicity: these include the Canadian National Seismic Network (CNSN), the Canadian Rockies and Alberta Network (CRANE, see Gu et al., 2011), the Alberta Telemetered Seismic Network (ATSN, see Eaton, 2014), the TransAlta Dam Network (TD), and the Montana Regional Seismic Network (MRSN, see D’Alessandro and Stickney, 2012). Recently, Schultz et al., (2015a) discerned the spatial performance of the combined network for the AGS earthquake catalogue. As a result of this study, which showed that certain regions were characterized as having larger deficiencies in the resolving power and detectability of earthquakes (for example, north of 55°N in western Alberta). The new RAVEN stations were directed to these ‘shadow zones,’ with additional consideration for historical seismicity and active hydraulic fracturing plays (Figure 1). In this article we outline the details of the RAVEN network: including the locations of the stations, site design, data dissemination, current and potential applications; as well as a preliminary inquiry into the ambient noise performance encountered by the individual stations.
RAVEN
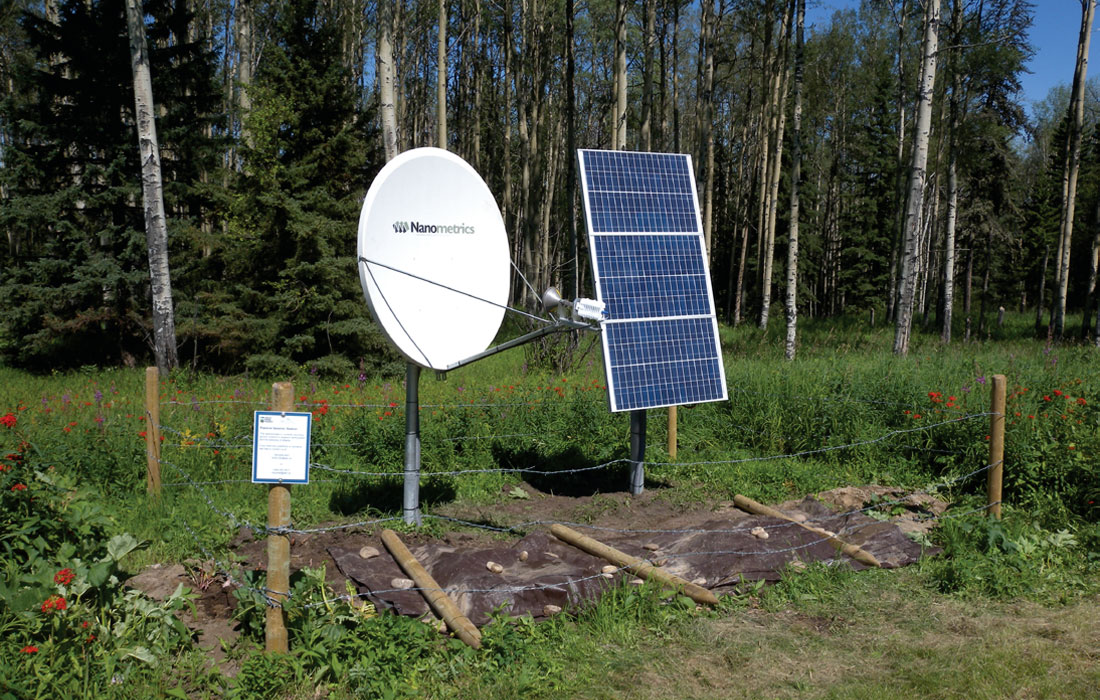
The deployment of the Regional Alberta Observatory for Earthquake Studies Network, RAVEN, began in support of the Earthquake Studies Project at the Alberta Geological Survey (AGS) with the initial station, LGPLA, deployed in October of 2013. By the summer of 2014, the network had grown to 8 real-time, continuously telemetered, 3-component, broadband stations. These stations are identical in their design (Figure 2), and consist of a Trillium Compact seismometer and Trident 305 digitizer which communicates with a Cygnus 205 for satellite telemetry. The seismometer is housed within a 55 gallon polyethylene drum for ease of access. The drum is buried, and the seismometer rests on a cemented pier within the thermally insulated enclosure. Similarly, the digitizers, telemetry equipment, power regulators, and batteries are housed in a second nearby buried vault. Power is provided by three 100W solar panels which charge four 110Ah deep cycle batteries; power requirements are overestimated in an attempt to provide adequate power even during extended periods of snow, stormy, or overcast weather. Satellite telemetry relays the recorded waveform data to a central hub at the Pacific Geoscience Centre. The waveform data is then forwarded to the Incorporated Research Institutions for Seismology (IRIS) Data Management Centre (DMC) to be disseminated freely to any interested researchers.
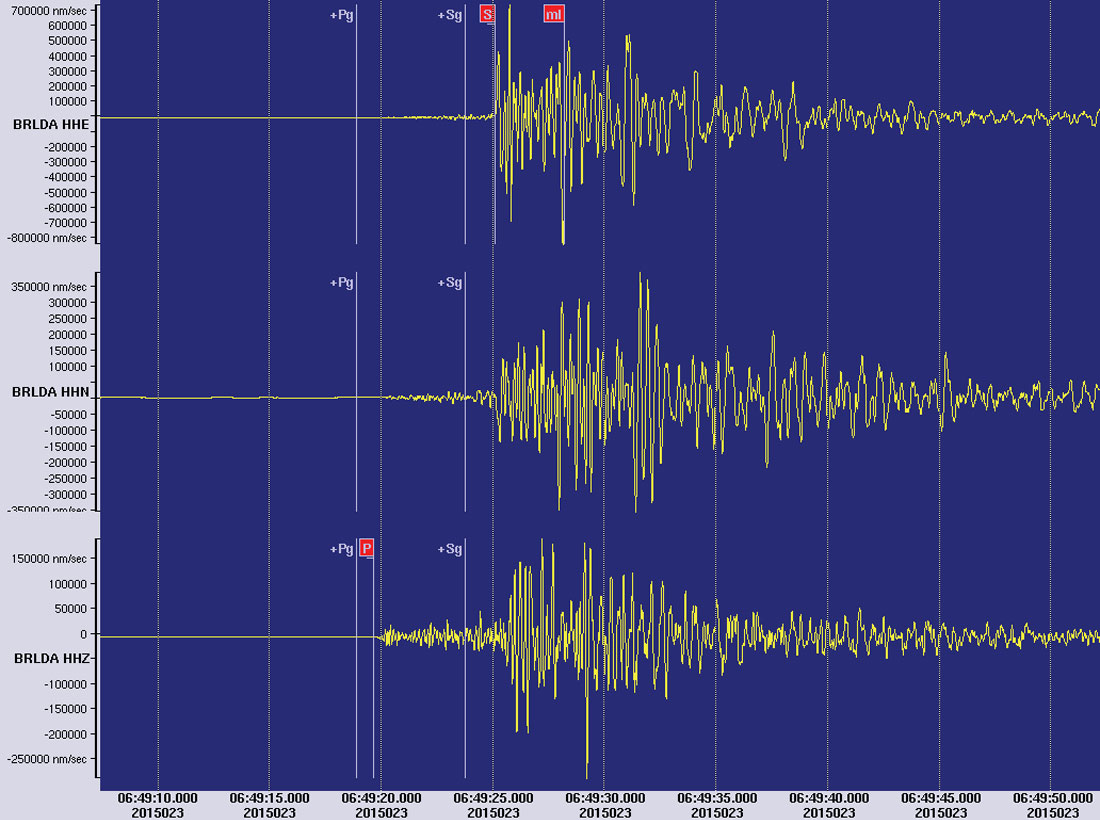
Currently, the seismic waveform data from RAVEN is integrated with the data from other networks for routine determination of earthquake locations (Stern et al., 2013) at the AGS. In addition to earthquake cataloguing, RAVEN stations have been placed to scrutinize the induced seismicity associated with hydraulic fracturing near Fox Creek, termed the Crooked Lake Sequences by Schultz et al. (2015b). Stations BRLDA, BDMTA, and SWHSA roughly encircle this area at distances ranging from 40 to 100 km. Recently, the induced seismicity in the Fox Creek area has captured the attention of the media (BNN, 2015) due to the 3.9 MW (4.4 ML ) event that occurred on January 23rd 2015 at 6:49:18 UTC (Figure 3). To date, these Crooked Lake Sequences are some of the largest magnitude, and most prolific series of events to have been associated with hydraulic fracturing. Oil and gas operators within the Waskahigan Field have also utilized RAVEN stations to supplement the seismic monitoring of their local arrays.
In addition to the intended use in regional earthquake determination, we also anticipate that RAVEN will be of interest to researchers looking to augment their studies with additional seismic data. For example, RAVEN data could provide additional constraints in the study of the Western Canadian Sedimentary Basin (WCSB) through tomography (Mercier et al., 2009; Bao et al., 2014), interferometry (Kao et al., 2013; Gu & Shen, 2015), regional stress and moment tensor inversions (Ristau et al., 2007), seismic anisotropy (Courtier et al., 2010), receiver functions (Cassidy, 1995; Chen et al., 2015), velocity modelling (Shragge et al., 2002), or seismic hazard studies (Atkinson et al., 2015).
Preliminary Analysis of Station Performance
The utility of a seismic station depends strongly on its spectral noise characteristics across a broad range of frequencies. High frequency components of ambient noise are often ascribed to cultural sources (McNamara & Buland 2004). Meteorological effects causing tilt at longer periods (De Angelis & Bodin, 2012). One of the more well understood and persistent source of noise has been coined microseisms and results from coupled crust-ocean interactions (Hasselman, 1963; Longuet-Higgens, 1950; Webb, 2007). Considerations of the detrimental effects of ambient noise were included in the design and location of RAVEN stations. For example, thermal insulation is used to mitigate the effects of diurnal temperature fluctuations on seismometer performance (Beaudin et al., 1996). Additionally, RAVEN stations are located in remote access areas, typically in conjunction with Environment and Sustainable Resource Development’s (ESRD) wildfire lookout towers, as they provide a suitable compromise between ease of access for site maintenance, security against equipment vandalism, and suitable distance away from anthropogenic activities. In areas far from ESRD fire towers, private landowners have provided land use. Despite these considerations, ambient noise still plays a role in station performance.
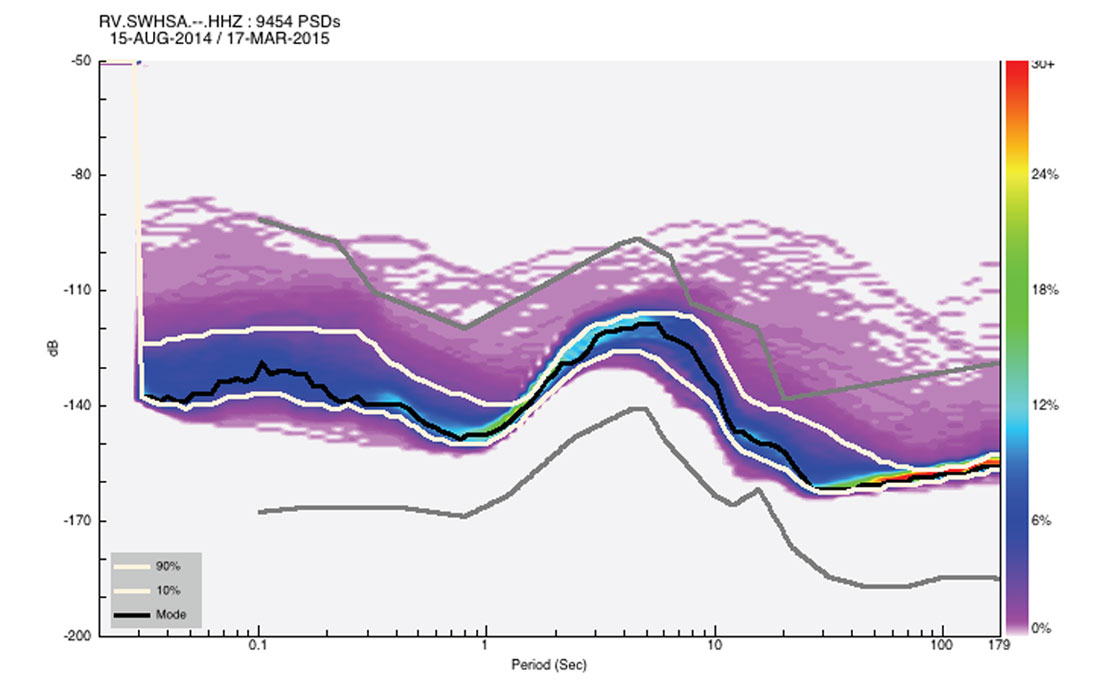
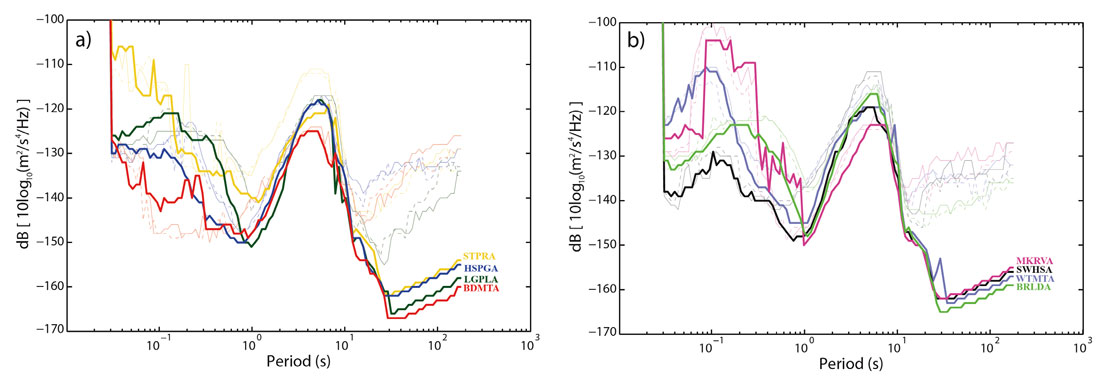
Here we briefly summarize the temporal variability in the spectral performance of the RAVEN stations over a period of ~1 year. To do this we used the program PQLX (McNamara & Buland 2004; McNamara & Boaz, 2011), which takes continuous waveform data and aggregates its spectral content into a statistical distribution (Figure 4). Similar to other regional installations (e.g., Schultz et al., 2015a), cultural noise sources dominate at periods lower than the microseism band and show diurnal, weekly and seasonal fluctuations. Typically, both the vertical and horizontal components have comparable noise amplitudes in this frequency band. Figure 5 shows a comparison of the modal values of the noise distribution for each RAVEN station. While instrument self-noise explains the majority of the ambient noise at periods longer than the microseism band, the systematically larger noise amplitude on the horizontal components (Figure 5) is likely due to barometrically induced tilt (De Angelis & Bodin, 2012). Overall, we find that the RAVEN stations perform well compared to the other regional installations in Alberta (e.g., Schultz et al., 2015a).
Conclusion
Deployment of RAVEN started with LGPLA in October of 2013. Since then, the network has grown to 8 stations telemetered in real-time, and there are plans to continue installing stations. The RAVEN stations were placed in locations that would best augment our understanding of earthquakes in Alberta, and this data has been used to enrich the catalogue of seismicity in Alberta. However, the data will also benefit studies of the geology, tectonics, and seismicity in the WCSB. Any interested institutions can acquire our publicly available RAVEN (and ATSN) data via the resources at the IRIS DMC under the network code RV.

Acknowledgements
We would like to thank ESRD for use of land in their Wildfire Lookout program, and to the private land owners who have accommodated us. Additionally we would like to thank staff and summer students for their help in the installation of the RAVEN stations, including Gordon Jean, Rob Natyshen, Diane Goulet, Danielle Wood, John Palowicz, Chris Croq, Dennis Chao, Luyi Shen, Javad Yusifbayov, Joseph Farrugia, and Ramin Dokht.


Join the Conversation
Interested in starting, or contributing to a conversation about an article or issue of the RECORDER? Join our CSEG LinkedIn Group.
Share This Article