Maximizing information from microseismic monitoring
The growing demand of energy and resources from society has moved the energy industry to maximize the productivity of reservoirs and search into the exploitation of new resources in increasingly challenging environments. Technologies such as Enhanced Oil Recovery and Engineered Geothermal Systems have become normal practice in the exploitation and development of energy resources. These technologies make use of well stimulation through fluid injection in order to engineer the reservoir rock properties through inducing new fractures and enhancement of the existing fracture network. Fluid injection in rock reservoirs is also used for the permanent storage of CO2 in order to abate the emissions of greenhouse gases from large single point sources and mitigate the potential environmental impact of the predicted growth in emissions.
Passive microseismic (MS) monitoring is now a well-established method for imaging the effect of the treatment and the changes imposed on the fracture network (e.g.Feignier and Young, 1992; Urbancic et al., 1992; Young and Maxwell, 1992; Maxwell and Young, 1993; Vandamme et al., 1993; Young and Baker, 2001) ;and provide real time feedback on the effectiveness of hydrofracture stimulation; either through the mapping of the fracture progress using MS event location (e.g. Quirein et al., 2007), utilizing continuous amplitude records to investigate hydrofracture mechanics (Pettitt et al., 2009), or complementing locations with size distribution in order to quantify the induced damage and fracture connectivity (Reyes-Montes et al., 2009b). The aim of a hydraulic treatment is the creation of pathways communicating different volumes within the reservoir or the change in the conductivity of pre-existing joints. The main feedback on the effectiveness of the treatment is the visualization of the active fracture network defined by the MS activity.
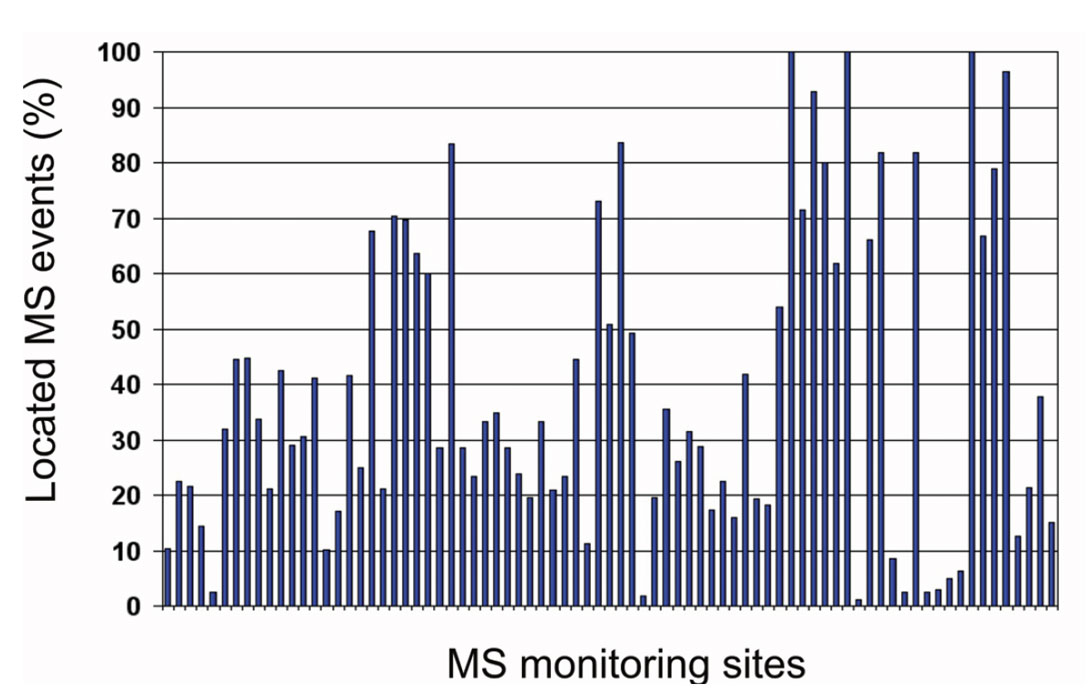
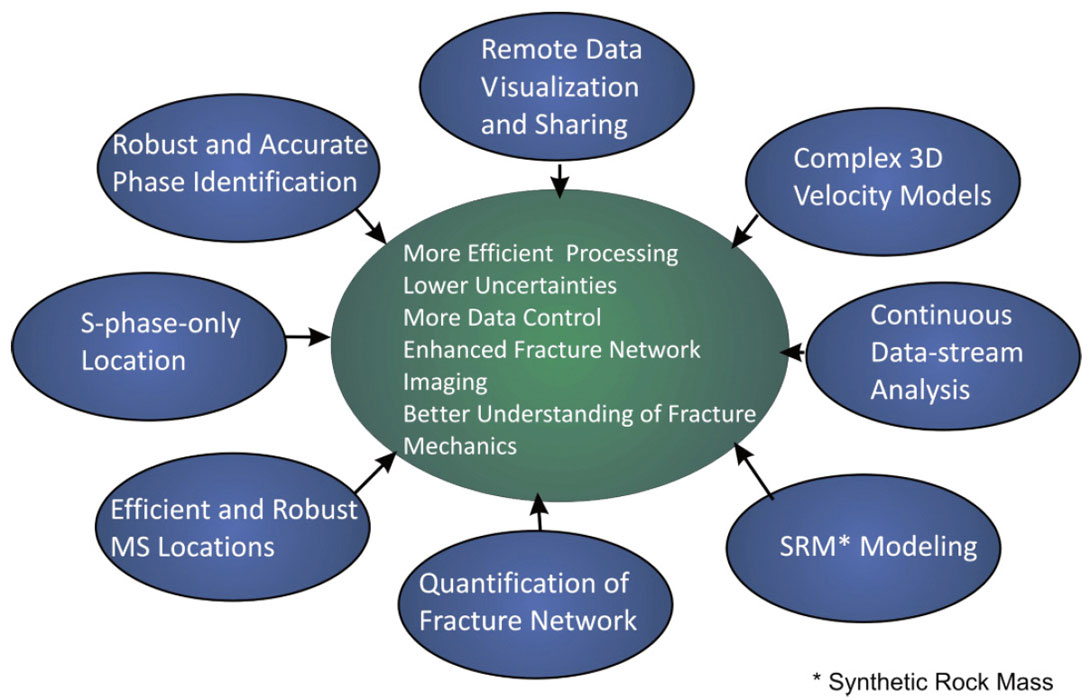
The success of MS monitoring of a hydraulic monitoring campaign relies on the accurate location of the highest number of events. Low signal-to-noise ratios are often experienced in many hydrofracturing treatments, due to high proportions of low-magnitude events and environmental noise from injection wells. This has the effect of causing difficulties in the identification and picking of waveform phases, in particular P-wave arrivals, required to obtain source vectors for a successful location from single borehole arrays (Figure 1). Different techniques have been developed to enhance the quantity and quality of the information provided by MS monitoring with the ultimate object of gaining an improved resolution in the imaging of the fracture network and provide a better understanding of the factors controlling its development in order to ‘engineer’ the reservoir rock (Figure 2). In particular, two approaches are presented here that enhance the information provided by the MS monitoring from the processing of the seismic record and the interpretation and analysis of the microseismic catalogue: the application of master-event relative location and the statistical analysis of the MS cluster structure.
Enhanced seismic location resolution
The location of the MS events induced from the opening or reactivation of fractures within the reservoir during the hydraulic treatment provides a first-order information on the position and extent of the fracture network. The resolution and accuracy of this imaging therefore relies on the accurate location of the highest possible number of triggers. Typical conditions in hydraulic fracture treatments involve significant environmental noise in the near-well-bore that make the identification of lowamplitude phases in the waveforms difficult. A recent study investigating the additional information in the continuous stream of microseismic amplitude data recorded during the hydraulic treatment of an oil-bearing reservoir showed that both P- and Swaves can often only be identified for a small fraction of the seismic record, with most released seismic energy appearing as single phase triggers in the record (Pettitt et al., 2009). Therefore, a location method robust against the potential loss or low quality of phase arrivals can increase significantly the capability of microseismic monitoring to image the fracture network.
The accuracy in the location of MS events on the other hand depends on a number of factors, including the accuracy in phase identification and picking, the uncertainty in geophone positioning and orientation, and especially the velocity model used in the location algorithm for the inversion of travel times. Full three-dimensional velocity models of the volume comprising the monitoring and treatment wells are rarely available. Classical location algorithms typically invert travel times using velocity models approximated from vertical sonic logs from neighboring wells or empirical calibrations using surveyed active sources (e.g. perf shots).
Relative location methods invert travel-time differences between neighboring events and therefore only require the modeling of the velocity structure in the smaller region comprising the located MS events. In particular, master-event relative location methods assume the accurate location of an event (master) and calculate the position of the rest of events relative to the master through the inversion of the travel time differences. The uncertainties in the location of the master event are transmitted to the rest of the processed events, however the resolution of the internal distribution of the events within the seismic cluster is highly improved since the method explicitly removes any uncertainties in the velocity model and ray trajectory in the volume outside the seismic cloud. This method has been previously applied for enhancing the precision and resolution of natural and induced seismicity at different scales and environments ranging from global and regional earthquakes (e.g. Deichmann and García-Fernández, 1992), to mining seismology (e.g. Gibowicz and Kijko, 1994; Reyes-Montes et al., 2005) and laboratory scale acoustic emissions (e.g. Jones et al., 2008), reducing hypocentral errors by one to two orders of magnitude.
To explicitly remove the dependency on the velocity model outside the volume comprising the MS events, it must be assumed that the ray paths for the master and the target event to a common receiver have similar take off angles. This approximation is valid provided that the separation between the master and target events is small compared to their distance to the receivers. The critical separation between master and target events for which location errors become larger for relative located events than classical absolute locations is in general in the order of 10% of the distance to the array (e.g. Reyes-Montes et al., 2005) – approximately 50m for a typical hydrofracture monitoring project.
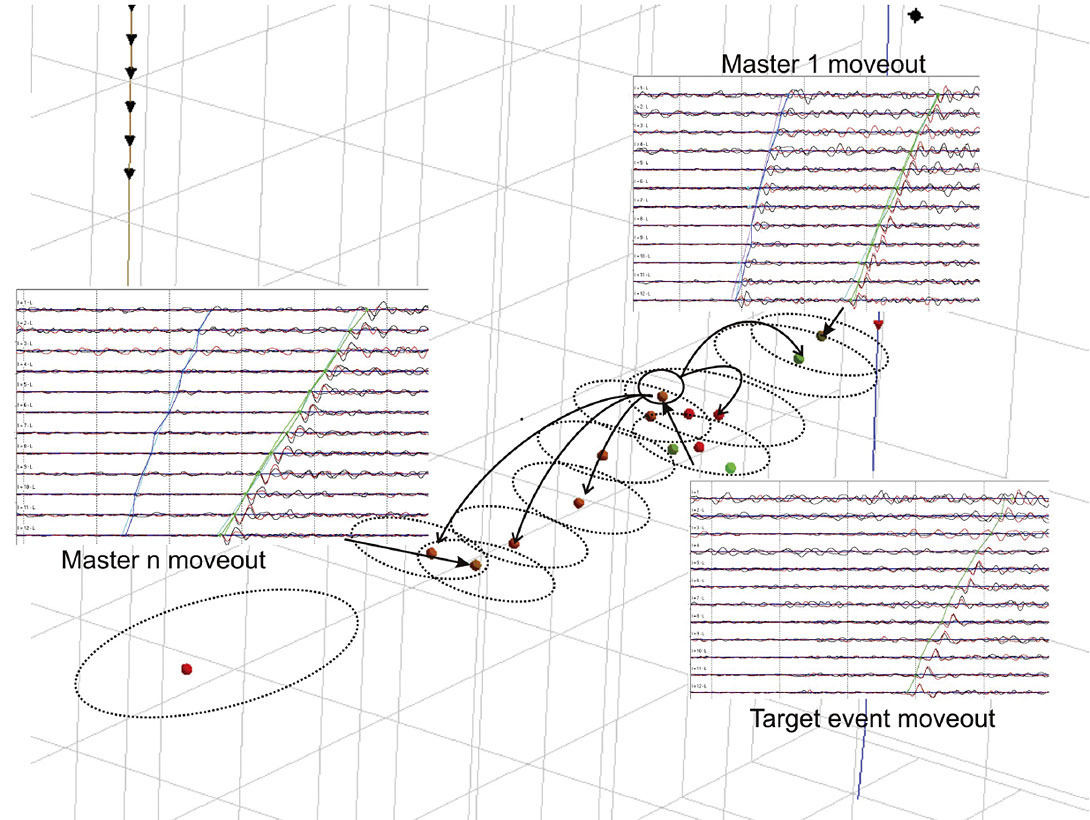
In order to overcome the critical separation constraint and extend the validity of the method to a typical MS cluster associated with a treatment stage, an approach was developed (Reyes- Montes et al., 2009a) that uses a series of well-located master events along a developing hydrofracture located using a classical location algorithm. This provides a network of master events that allows the relative location of the target events with lower signal-to-noise that may consist of only S-wave arrivals. The set of master events can be provided by calibration shots and highquality MS events with clear P and S-wave arrivals. For the location of a target event, travel time differences are calculated for all available masters producing a series of relative-moveout patterns, automatically discriminating on moveout pattern between the best master and the phase arrivals being processed, so as to minimize the separation distance between the master and the events being relatively located.
The relative-moveout residuals, with no use of directivity information from the P-wave arrivals, produced well-constrained single absolute minima in depth, however multiple minima are found across horizontal sections at the determined depth level due to the azimuthal ambiguity encountered in classical location algorithms, normally resolved using P-wave polarizations. In this case, in order to remove the dependency on Pwave information, the information from the network of master events and the configuration of the treatment job is used to constrain the horizontal position by applying a normally distributed location weighting centered around the vertical best-fit for all located master MS events, continuously updated as new master events with both phase travel times and source vectors are located using the classical approach.
The method locates these events with lower uncertainties than could be obtained in classical location algorithms for the same events, and thus better defines the hydrofracture propagation in terms of both event density and resolution (more events processed with lower uncertainties).
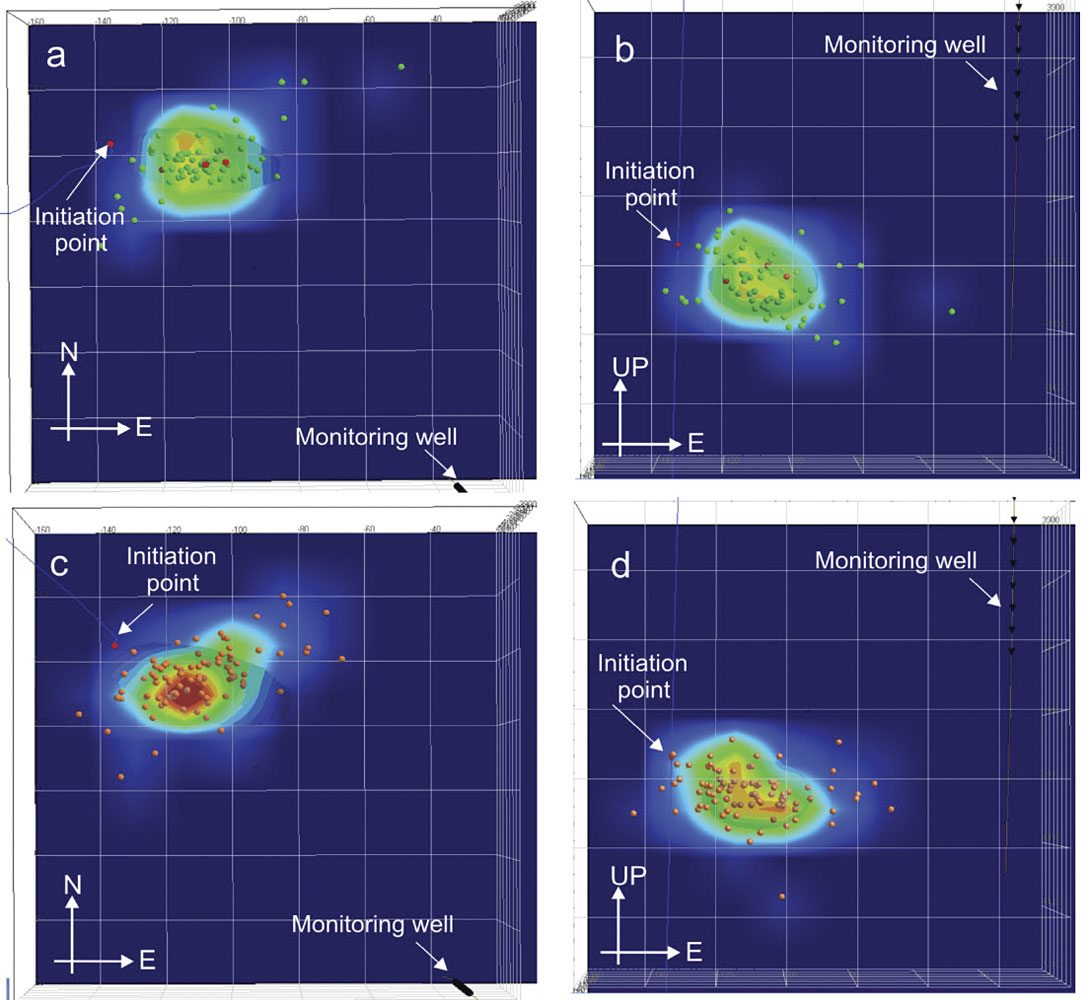
An example application of the method to the location of MS events for which no clear Pwave arrival is available is shown in Figure 4. The example located a sub-set of MS events induced using the first thirty minutes of hydraulic fracturing treatment of a tight gas sand at 4,000 m depth. The data set contains events with high signal-to-noise ratio and clear P and Swave arrivals. The classical location using P- and S-wave arrivals and source vectors calculated from the P-wave hodograms produced a total of 90 MS locations. In order to validate the application of the relative-moveout location approach to events with low quality P-wave arrivals, three events with the highest magnitude were used as masters and P-wave picks were cancelled for all remaining 87 events. The MS events were subsequently relocated using the stepwise relative-moveout location with the three available masters producing 70 successful locations. The relative located events complement the information on fracture extent and degree of damage provided by the master events only, incorporating events that would otherwise be treated as noise in the real-time MS monitoring of a hydraulic fracturing job.
The results obtained with the classical location technique using the full waveform information with those using S-wave only and relative-moveout location. The fracture image provided by the MS locations using both location methods show a consistent extension and orientation within ±5º, with a wider spread fracture in the case of classically located MS events. This result shows the potential of the method to significantly increase the number of events and provide information on fracture extent and orientation that would be lost if no P-wave picks are available.
Imaging of fracture network orientation
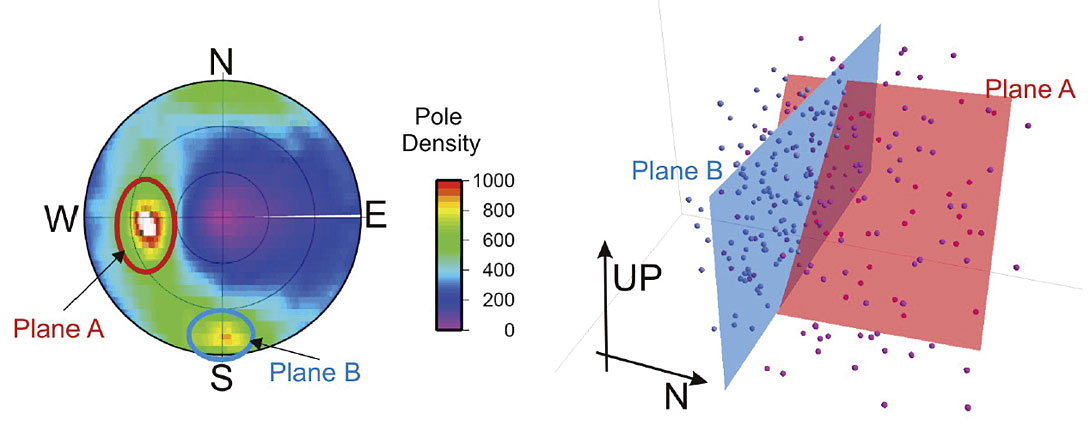
The aim of a hydraulic treatment is the creation of pathways communicating different volumes within the reservoir or the change in the conductivity of pre-existing joints. In either case the main feedback on the effectiveness of the treatment from MS monitoring is the visualization of the active fracture network defined by the MS activity. The statistical analysis of the spatial and temporal distribution of the MS events located from the MS monitoring of a hydraulic treatment allows identifying dominant structures within the microseismic cloud and provide the orientation, persistence and spacing of the dominant fracturing (e.g. Reyes- Montes et al. 2007b). The statistical technique calculates the planes that fit every unique combination of three events. The poles of the calculated planes can then be plotted on a stereogram, where high density of poles indicate the existence of a preferential orientation. The effect of the overall shape of the volume containing the events is removed by normalising the distribution of poles found for the events by the distribution obtained for a population of the same number of uniform random generated points distributed in the same study volume. The identified dominant structures can be correlated with mapped pre-existing fractures for an interpretation of the effect of the treatment. The over sampling of the group of events makes this method less sensitive to Gaussian location errors than methods based on interevent distance distributions. The analysis of the distribution of plane sizes provides an indication of the persistence of the fracture network associated with the treatment of the corresponding stage. Similarly, the separation between planes following the dominant orientation provides information on the spacing of the dominant fracture network and the range over which the dominant fracture network extends. The information from the treatment combined with the dimensions of the dominant fracture network can also provide an estimate of the apertures achieved during the proppant injection.
A test of the robustness of the method against uncertainties in source location performed using sets of synthetic events scattered along planar structures with a normally distributed location perturbation, showing that the method identifies the underlying structure to location uncertainties of the order of 20% of the structure dimension (Figure 5).
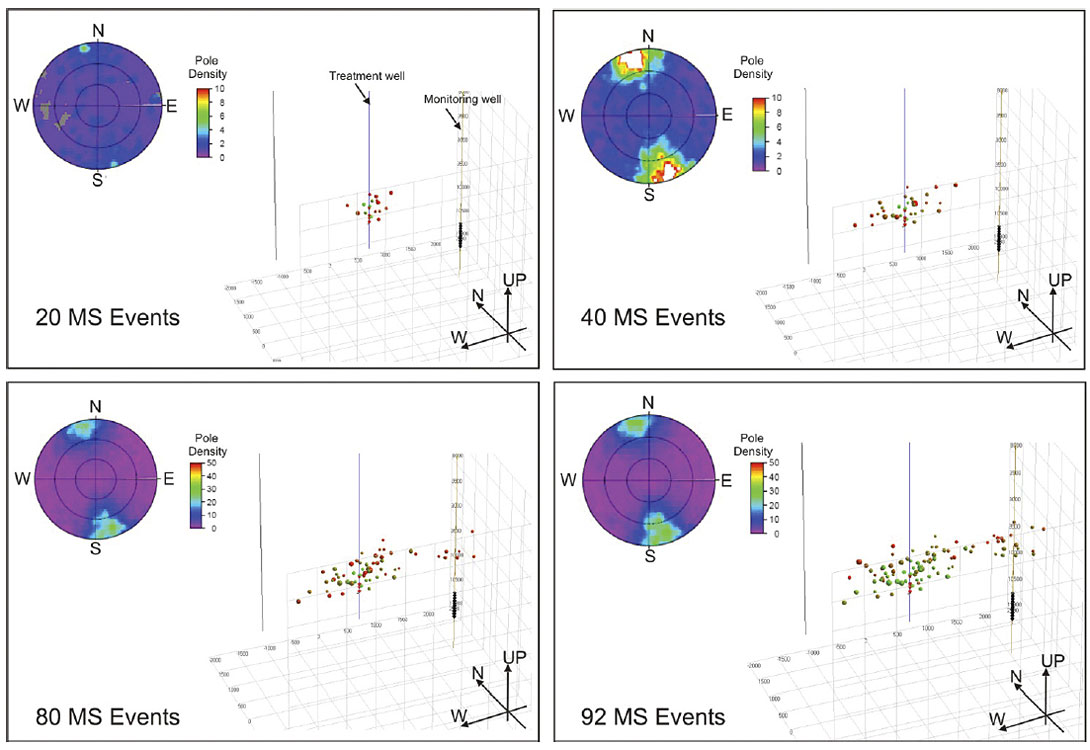
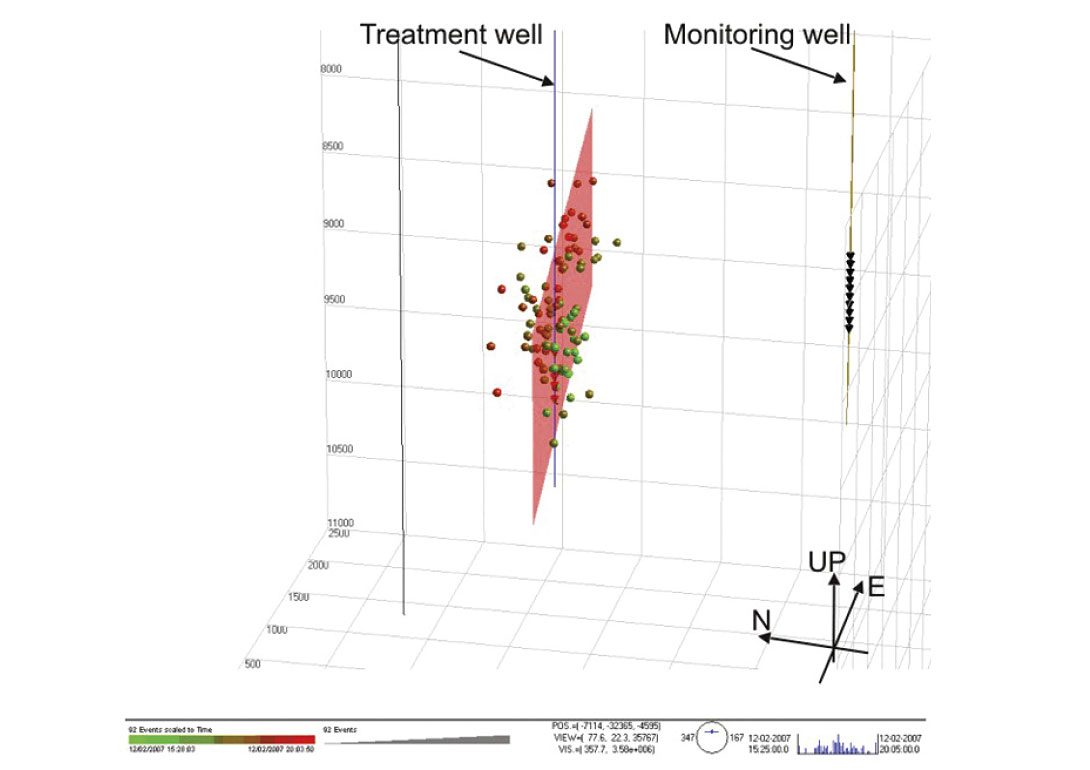
The application of the analysis to a real-time field monitoring is shown in Figure 6. The analysis is performed for sequential time intervals, displaying the corresponding stereograms of pole distribution showing events defining a fracture propagating in the W-E direction (approx. N80E).The 3D view shows events defining a vertical plane. This is clearly observed in the stereograms when more than 20 events are included.
The identified dominant structures can be correlated with mapped pre-existing fractures for an interpretation of the effect of the treatment. This analysis complements the information on fracture extent provided by the spatial distribution of the induced microseismicity with information on the direction and intensity of major induced fracturing associated with potential enhanced paths for fluid communication.


Join the Conversation
Interested in starting, or contributing to a conversation about an article or issue of the RECORDER? Join our CSEG LinkedIn Group.
Share This Article