Summary
In a marine environment, topographic features on the sea floor will usually be covered by a thick layer of shale with the rise of sea level, resulting in a uniform, nearly flat surface. Evaporating seas may bury sea floor topography with a thick layer of salt. In a fluvial-deltaic environment, channels are cut and filled with a lithology that may be different from that through which it is cut, followed by subsequent burial with (perhaps) a more uniform sedimentary layer, With continued burial and overburden, pore sizes are reduced and water is squeezed out of the rocks, reducing the rock volume. Different lithologies have different original porosity, pore shapes, and mineral matrix composition, and thus different response to burial. Lateral changes in lithology give rise to lateral changes in compaction, or simply "differential compaction". For this reason, easily-mapped flooding and other surfaces that were originally flat can exhibit measureable, and often significant structural relief. These maps give rise to lateral "structural" anomalies. Recognition of differential compaction forms a key component in modern seismic geomorphology based interpretation workflows with excellent publications showing the expression of differential compaction on vertical slices. Mapping the 3D expression of compaction features takes considerable time and is thus less well reported and the use of 3D geometric attributes to map compaction features is underutilized. In this paper we illustrate the attribute expression of the more common differential compaction features over channels and carbonate reefs using examples from the Western Canadian Sedimentary Basin.
Introduction
Differential compaction has long been used by seismic interpreters to map features of exploration interest. The classic paper by Bubb and Hatledid (1979) shows that differential compaction, along with velocity pull-up, to be one of the keys means of identifying subtle carbonate buildups. Soon after, Heritier et al. (1980) recognized differential compaction over sand fans in the North Sea. Alves and Cartwright (2010) provide a more modern overview of deep-water differential compaction features. Differential compaction is routinely used in seismic geomorphology based interpretation of fluvial deltaic systems (e.g. Posamentier and Allen, 1999). Compaction features over laccoliths and dykes are recognized as a means of generating fractures in overlying sediments. Compaction has even been used as a key means of identifying impact craters.
Seismic attributes such as coherence and curvature are now routinely used in mapping structural features such as faults, folds, and flexures. Coherence has also long been used in mapping discontinuities that arise at channel edges. Since differential compaction gives rise to the deformation of overlying, easily mapped, and previously flat surfaces, such surfaces can be used to map underlying features of interest. Dip and azimuth maps are routinely used in the North Sea to map less-compacted sand fans, sand-filled channels, and injectites. Helmore et al. (2004) are perhaps the first to use horizon based curvature to map such features. Chopra and Marfurt (2007) summarize earlier work on mapping compaction features using coherence and curvature. In this paper we update this work with more modern 3D examples. In particular, we present positive relief, sand-filled channel features in a shale matrix and negative relief, compacted Winnipegosis carbonate buildups in a salt matrix in the Western Canadian Sedimentary Basin.
Differential compaction in channels
There are two kinds of channels that are commonly encountered, i.e. incised channels that were engraved in shale with the flowing water at one time and now buried deep under, and those incised channels that have sandstone deposition and have undergone differential compaction. Incised channels exhibit a well-defined thalweg, or the axis of the channel, and the levees, which refer to the positive relief features seen at the edges of the channel. Levees may not always be very well-defined in incised paleo channels and so may or may not always be seen as sharp, crisp and prominent features.
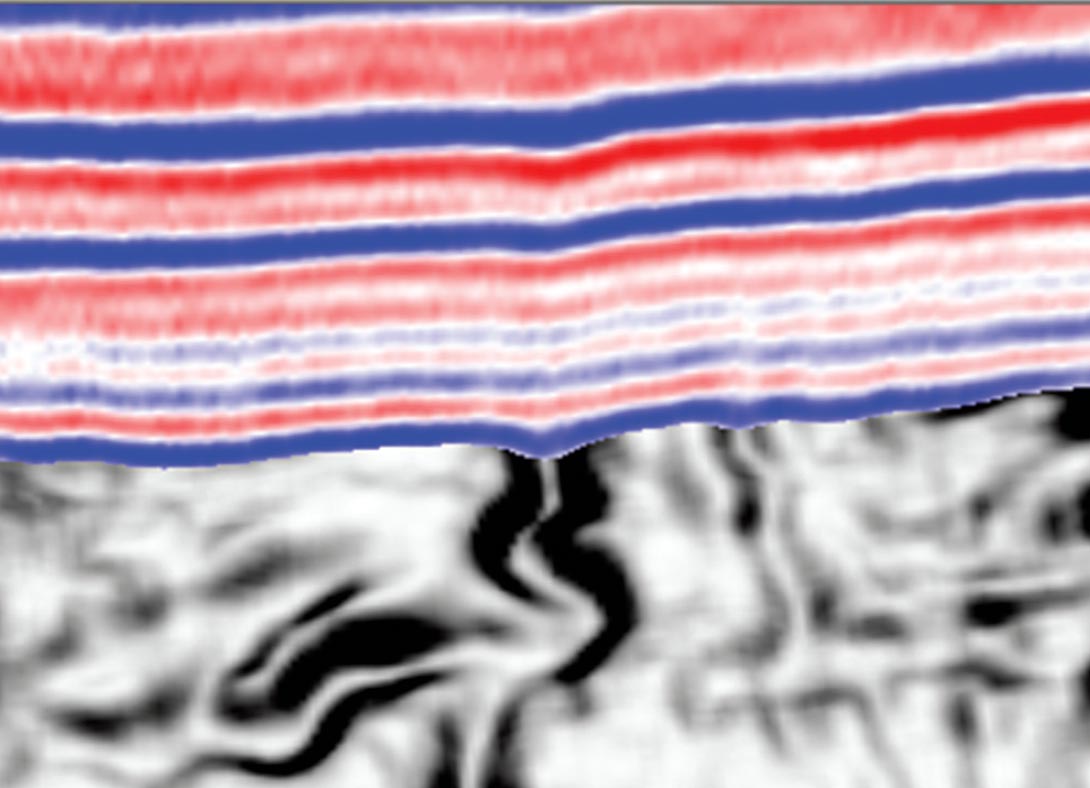
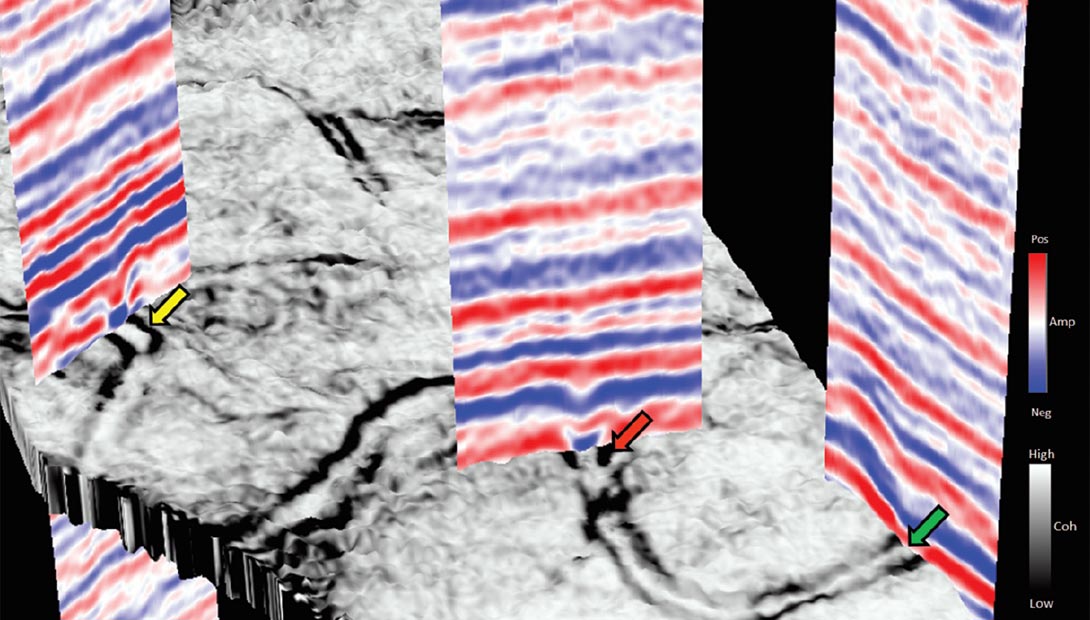
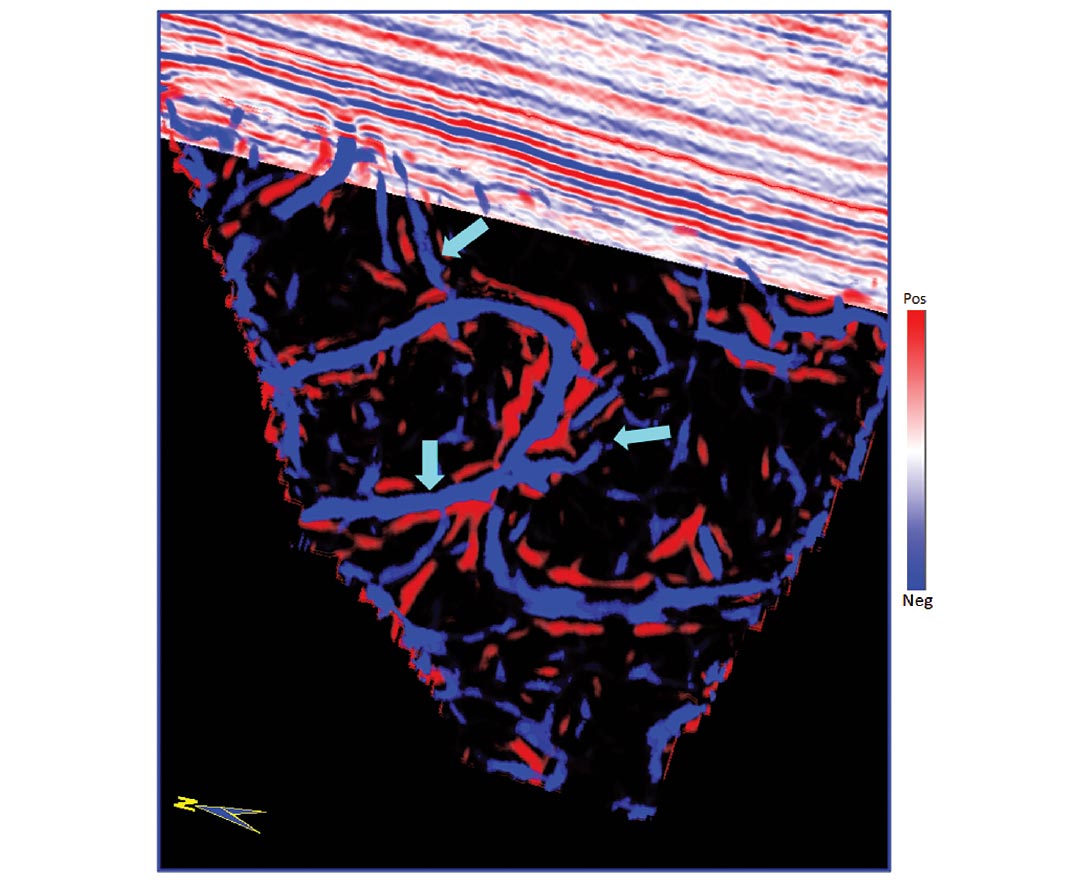
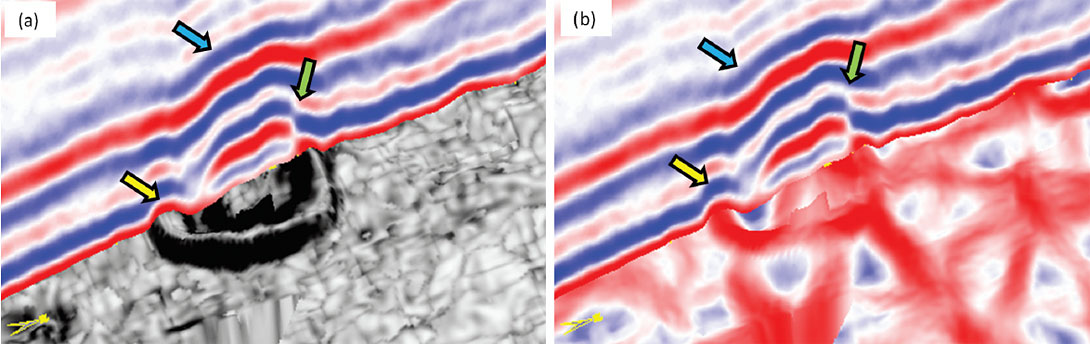
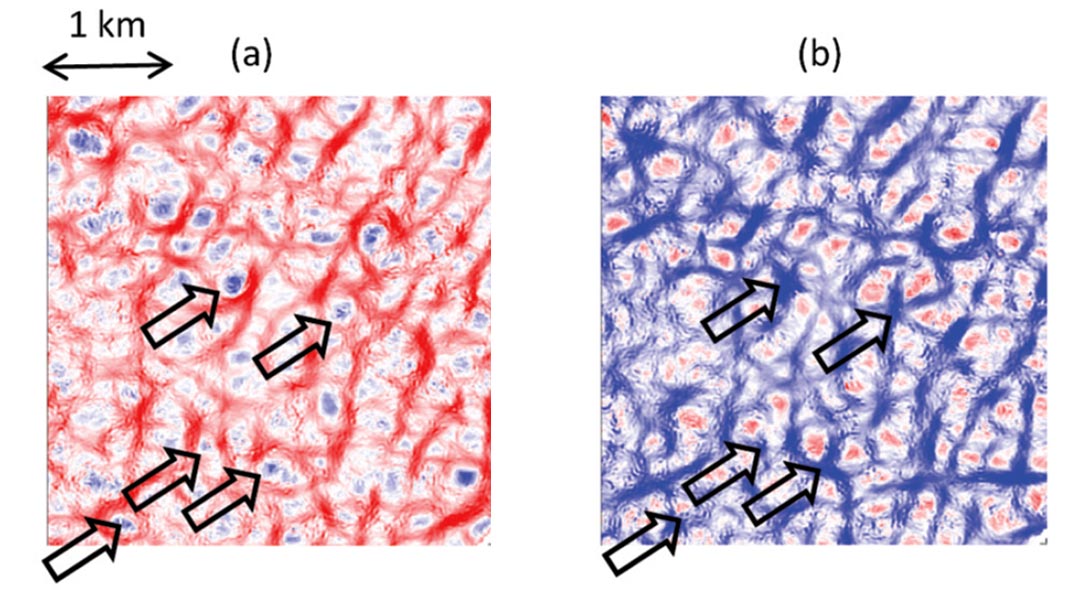
Wide and deep incised channels usually have a well-defined signature on the seismic and can be noticed on the horizon slices. Seismic coherence or curvature attributes help with the interpretation of the complete definition of even subtle channel signatures. In Figure 1 we show a chair display, wherein the vertical section is the seismic and the horizon slice from the coherence attribute shows the disposition of the incised channel. On a coherence strat-cube showing an incised meandering channel as seen in Figure 2, we show chair displays for three seismic sections displayed orthogonal to the axis of the channel. The incision of the channel appears to be the deepest at the location of the seismic section 1(yellow arrow), it is somewhat less at seismic section 2 (orange arrow) and the least at location 3 (green arrow). The most-positive curvature attribute will pick up the edges of the channel and the mostnegative curvature will define the thalweg of the channel. In Figure 3 we show a chair display with seismic as the vertical section and for the horizontal section we have overlaid the most-positive (red) and the most-negative curvature (blue) attributes using transparency. Notice the edges of the channel are seen in red and the axis of the channel is defined in blue. Segments of a deeper channel are also seen in the display and these have been marked with light blue arrows.
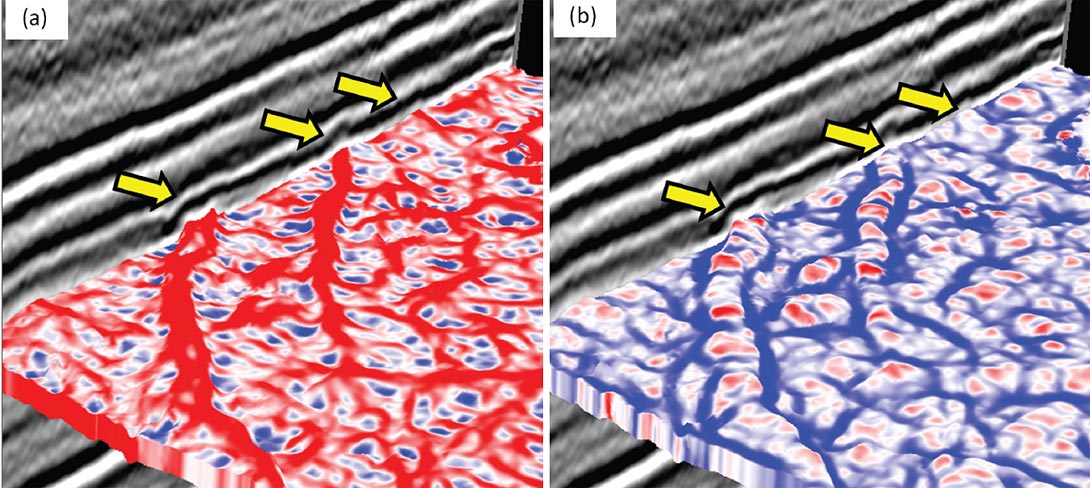
For channels that exhibit differential compaction, there is a bulk of the sandstone within the channel that does not undergo as much compaction as the sediments outside it. This leads to a positive relief feature seen over the length of the channel and slight negative relief feature at the edges of the channel. Coherence attribute picks up the edges of such a channel, however the most-positive curvature attribute shows the central mound over the channel (Figure 4a) and the most-negative curvature defines the edges of the channel as shown with the help of yellow arrows in Figure 4b.
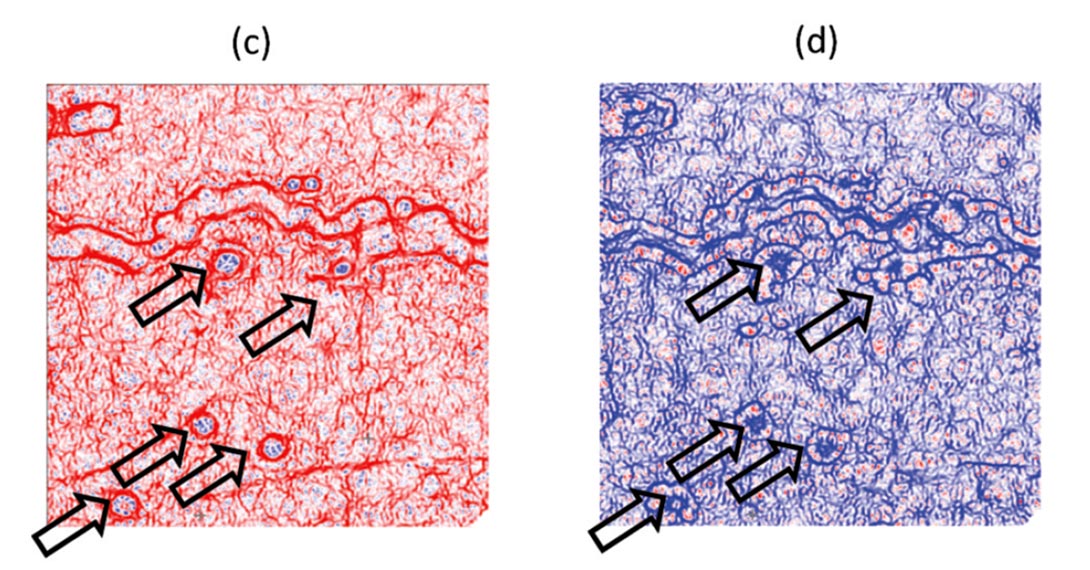
Differential compaction in reefs
Due to the differential compaction between the reef carbonate facies and the off-reef facies, usually the overlying sediments tend to drape across the reefs. The extent of the drape would depend on the variation in the compaction of the reefal and the off-reef material as well as the thickness of the overlying sediments.
Another thing to consider is the fact that the reef interior is not all uniform in that the reef margins are usually seen to be having higher porosity than the interior or the core of the reef. Such variation in the porosity is detected on the seismic data by the careful eye, so that reef margins would exhibit pull downs and the core would exhibit a pull-up. These time-structural reliefs are useful indications for the variation in the reef content.
In Figure 5a we show a chair display with the horizon slice from coherence and correlated with the vertical seismic section. Notice the prominent reef feature on the coherence and the drape of the seismic reflections over it. The most-positive curvature defines the mound and corresponds to the edges of the reef clearly.
Application of structural or amplitude curvature
The computation for curvature that the interpreters normally carry out is referred to as structural curvature and is usually done by taking the first order derivatives of the inline and crossline components of structural dip. Chopra and Marfurt (2011) discussed the comparison of structural curvature with amplitude curvature. For generating amplitude curvature, the first order derivatives are applied to the inline and crossline components of the energy-weighted amplitude gradients, which represent the directional measure of amplitude variability. Application of amplitude curvature computation to real seismic data shows higher level of lineament or definition detail as compared with structural curvature. The images are mathematically independent of each other and thus highlight different features in the subsurface, but are often correlated through the underlying geology.
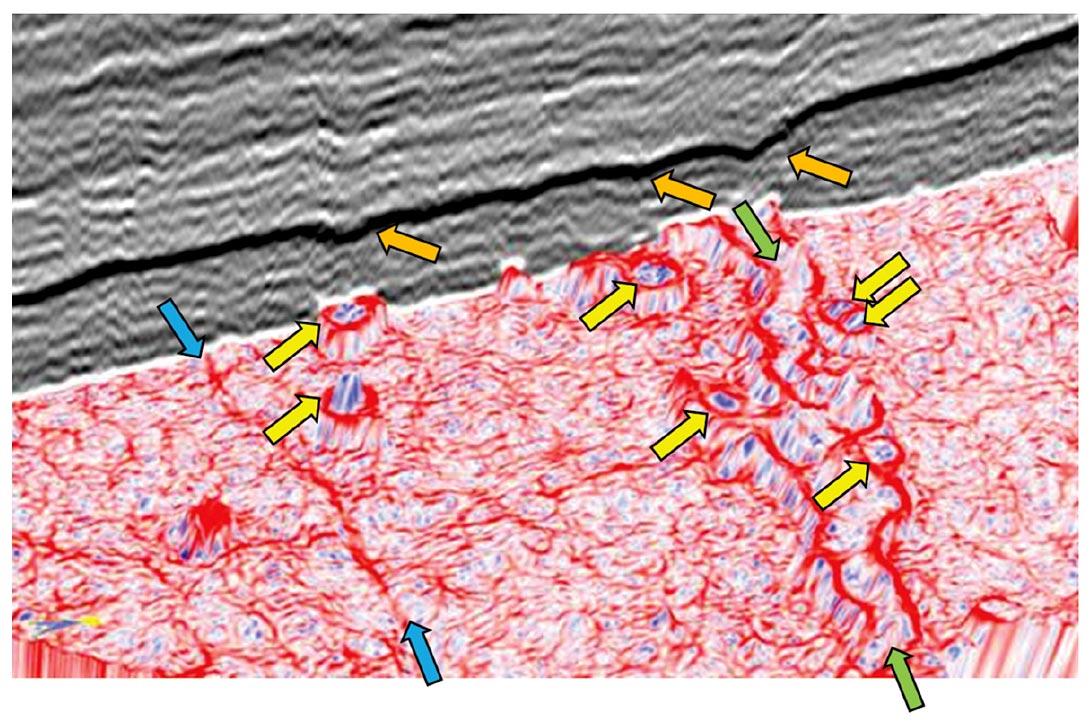
In Figure 6, we show equivalent time slices from the most-positive and most-negative structural curvature as well as the same two attribute slices from the amplitude curvature. The features of interest are Winnepegosis reefs that show structural lows and highs n the amplitude curvature slices. The east-west trending feature indicated by yellow arrows is an elongated reef as well. In Figure 7 we show a chair display for the seismic section as the vertical and a strat-slice as the horizontal section along the top of the Winnepegosis through the most-positive curvature attribute volume. The orange arrows indicate structural sags at the top of the Prairie evaporate section due to differential compaction of the core of the underlying Winnepegosis reefs. The yellow arrows on the horizon slice shows the rim highs (in red) and reefcenter lows (in blue) described on 2D sections by Anderson and Franseen (2003). Green arrows indicate a long amalgamated reef trend that may have been controlled by growth on a paleo high such as the structural feature indicated by the cyan arrows.
Conclusions
By understanding the depositional environment, differential compaction can serve as a key in lithology indicator that can be incorporated with other 'soft' measurements such as reflection amplitude anomalies, AVO anomalies, flat spots, and velocity pull-ups in a riskanalysis based prospect evaluation workflow. Channel features are often identified by their meandering and/or dendritic morphology on maps. Positive curvature anomalies over channel features indicate that these channels are filled with a lithology that is less compactable than the surrounding matrix, indicating the presence of sand. Negative curvature anomalies over channel features are more problematic. If the channels are in nearshore environment and have been filled by rising sea level, there is a very high probability that they are filled with shale, indicating that sand should be found in the surrounding, less-compacted point bars and levees that often express a positive curvature anomaly. In general, incised channels may be filled with a mix of lithologies resulting from multiple stages of incisement and fill. If the topography has been exhumed, the surrounding material may already have been compacted, reducing the differential compaction anomaly associated with a sand-filled channel. Significant shale fill may overwhelm the less compaction of the sand component.
The observations reported by Bubb and Hatledid (1979) remain basically unchanged for 3D seismic data and 3D seismic attributes. Carbonate buildups buried in shale will give rise to structural highs and positive curvature along the shallower, more easily picked horizons. Carbonate buildups buried in salt, such as the Winnepegosis reef examples shown here, will appear as structural lows, giving rise to a negative curvature anomaly. Andersen and Franseen (1997) report that such compacted structural reef cores have lost much of their original porosity, while the surrounding, structurally high rims (giving rise to a positive curvature anomaly) preserve much of their original porosity.
In summary, a clear understanding of the depositional environment and the effects of differential compaction, coupled with high quality 3D seismic and a modern seismic geomorphology interpretation workflow can facilitate the rapid interpretation of otherwise subtle, and perhaps otherwise over-looked, geology features of interest.

Acknowledgements
We thank Arcis Seismic Solutions for encouraging this work and for permission to present these results. We also thank Fairborne energy for permission to use Figures 6 and 7.
Related Reading


Join the Conversation
Interested in starting, or contributing to a conversation about an article or issue of the RECORDER? Join our CSEG LinkedIn Group.
Share This Article