Abstract
Shales are volumetrically the most abundant sedimentary rocks. Shales are also known to be anisotropic to the propagation of seismic waves. Thick shale layers may significantly affect seismic wave propagation and contribute to the distortion of a seismic image. The elastic behavior of shales is usually associated with the properties of a transversely isotropic (TI) medium, which can eventually be reduced to quite simple expressions. However, the relationship between the elastic behavior of shales and the petrophysical properties of shales is more complex.
Here we discuss the origin of seismic anisotropy in shales and model intrinsic elastic behavior of shales on the basis of their textural properties. Shale texture has been quantitatively described by the orientation distribution function, which is used in an elastic averaging procedure. The averaged elastic constants for a hypothetical shale are obtained on the basis of the Voigt, Reuss and Hill assumptions. Taking into account wide separation of the Voigt and the Reuss (upper and lower) bounds for some elastic constants, the recently developed Geometric mean method is employed to further refine intrinsic elasticity.
The resulting averaging elastic constants are used to calculate phase velocities of an intrinsically anisotropic shale. The predicted velocities are in good agreement with those reported in literature for the P- and S- wave velocities of shales obtained from experimental ultrasonic measurements.
Introduction
Knowledge of the anisotropic properties of shales is becoming increasingly important as this information is needed in developing velocity models for accurate seismic subsurface imaging in sedimentary basins with complex geological structures. Incorporating elastic anisotropy into migration algorithms is necessary for proper lateral positioning of subsurface events (e.g. Vestrum et al., 1999).
The seismic anisotropy of shales has been well documented in both laboratory experiments (e.g. Jones and Wang, 1981; Vernik and Nur, 1992; Johnston and Christensen, 1995; Jakobsen and Johansen, 2000; Wang, 2002) and field observations (Winterstein and Paulsson, 1990; Miller et al., 1994; Kebaili, and Schmitt, 1996; Leaney et al., 1999; Leslie and Lawton, 1999).

The source of seismic anisotropy is non-unique and it may be produced by several factors (Fig.1). Despite steady advances in the understanding of shale elasticity based on numerous laboratory experiments and significant progress in the modelling of shale elasticity (Hornby et al., 1994; Sayers, 1994; Schoenberg et al., 1996; Hornby, 1998; and Sayers, 1999), ambiguity related to the in situ causes of seismic anisotropy still exists. The origin of seismic anisotropy in shales may include preferred orientation (i.e. texture) of clay platelets (Kaarsberg, 1959; Tosaya, 1982; Sayers, 1994; Johnston and Christensen, 1995), alternation of fluid filled collinear cracks with clay platelets (Vernik and Nur, 1992; Hornby et al., 1994), microcracks (Vernik, 1993; Vernik and Liu, 1997), fine layering (Schoenberg et al., 1996), fluid filled porosity (Hornby, 1998) and stress-induced anisotropy (Sayers, 1999). Presence of all these factors indicates the relationship between petrophysical properties of shales and their elastic behavior is complex and depends not only on the shale properties but also on in situ conditions.
In this contribution the issue of the origin of seismic anisotropy in shales has been partially addressed by modelling the elasticity of a shale solid matrix, i.e. by calculating the expected intrinsic elastic properties of shales. ‘Intrinsic’ implies elastic anisotropy due solely to the elastic properties of the constituent minerals and their mutual orientation within the aggregate, and does not include the effects of cracks, layering, or scale effects. Our modelling is based on the volume averaging with the orientation distribution function (ODF) f(g) (Viglin, 1960) and the Geometric mean averaging technique. ODFs are widely used in metallurgy to quantitatively describe textural properties of metals and alloys (e.g. Bunge, 1981). The ODF is a function that defines the probability the crystallographic axes of a specific mineral lie within a certain range of orientations relative to the frame of reference of the sample. For instance, a rock with a strong preference for a particular mineral alignment, as might be observed in strongly foliated gneisses, would have the signal of its ODF mostly concentrated in a specific area of the orientation space. The ODF of a rock with a completely random orientation of crystals would be uniformly distributed in the orientation space. In short, ODFs carry quantitative information about the mineralogical texture and can be incorporated into the calculations of the physical properties of textured aggregates.
A method of averaging the elastic properties that employ an ODF was initially applied to shales by Sayers (1993, 1994) who wanted to identify the textural parameters responsible for anisotropy. He suggested that only two of the ODF expansion coefficients affect the seismic anisotropy of shales with vertical transversely isotropic (VTI) symmetry. By adjusting the value of these two parameters, he investigated anelliptic shale anisotropy. The results of his modelling show that shales might develop strong anelliptic anisotropy due to intrinsic textural properties. However, intrinsic anisotropy caused by a realistic shale texture has not been investigated.
To carry out ODF averaging one needs knowledge of the volumetric fraction of corresponding mineral phases, the textural orientation distributions and elasticity of the constituent clay minerals. Illite is usually the most abundant clay mineral in shales (Kaarsberg, 1959) and contributes significantly to the overall properties. In this development, the assumption is made that the shale’s matrix is composed solely of illite. Unfortunately, acceptable measurements of the full elastic properties of the clay minerals have not yet been carried out because of a small (typically submicron) crystal size. Therefore, in the calculations discussed here, the properties of the muscovite mica crystal are assumed to be elastically equivalent to illite (Tosaya, 1982; Sayers, 1994). This is not unreasonable as the structures of both layered silicates are similar with the replacement of some of the K+ in illite by H3O+ ions (e.g. Putnis, 1992). Due to extremely high anisotropy of a single muscovite crystal (for compressional wave Ap=(Vpmax- Vpmin) / Vpmean x 100% = 56.8%) results of the modelling under the assumption of 100% muscovite composition sets the upper limit on the possible intrinsic anisotropy of shales.
Elastic properties of textured rocks
In a generally homogeneous anisotropic medium, stress and strain are specified by second–rank tensors σij and εkl, respectively. These quantities are related by a generalized Hook’s Law: σij = Cijklεkl (here the Einstein summation convention is employed). Eighty one components of the forth-rank tensor Cijkl are known as elastic constants or stiffnesses and fully describe the elastic properties of anisotropic medium. Due to the symmetry of both the stress and strain tensors among the other conditions, Cijkl also expresses the symmetry and can be simplified to the matrix form written in the Voigt notation (see Nye, 1990) as σi = Cijεj. Here, Cij is a 6x6 symmetric matrix composed of the 21 independent elastic components for the most general case of triclinic medium symmetry. For the medium of transversely isotropic (TI) symmetry, which has a bedding plane coincide with the XY coordinate plane and Z coordinate axis aligned with the rotation symmetry axis of the medium, only five of the elastic constants are independent, and the matrix of elastic constants has the form:
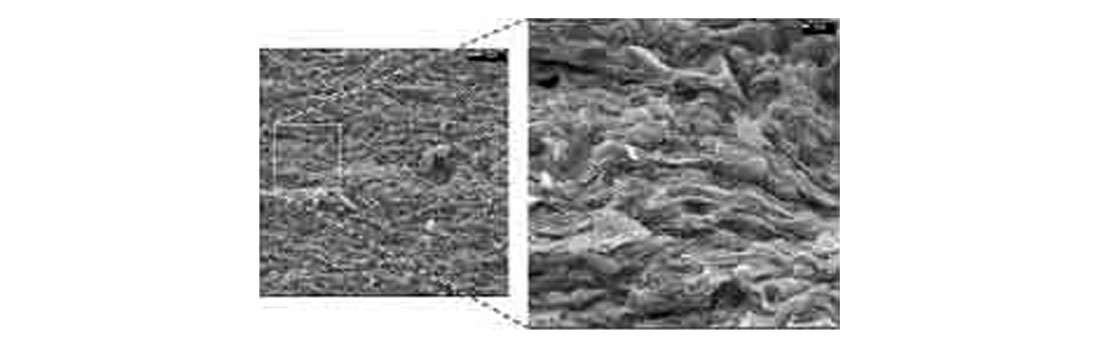
In order to model the intrinsic anisotropy of shales a clay platelet orientation distribution computed from a digitized SEM image of shale sample (Hornby et al., 1994) was used. Initial bedding-parallel preferred orientation of clay minerals in shales might be developed during the depositional process. However, the strong preferred orientation of clay platelets (Fig. 2) most probably developed during the diagenetic transition from smectite to illite as shown by Ho et al. (1999) on a sequence of pelites from the Gulf Coast. The orientation distribution of clay platelets was reproduced from Hornby et al. (1994) and is approximated by the normal distribution function (Fig.3a). The normal distribution approximation was than used to compose the ODF under the assumption of transversely isotropic (TI) intrinsic shale symmetry (no preferable lateral variations of the clay platelet normals). The resulting distribution of the illite [001] crystallographic axis is shown on the pole figure (equal-area projection) of Fig. 3b. The ODF quantitatively defines information about rock textural properties and can be obtained from the measured pole figures of the distributions of crystallographic axes of the constituent minerals (Bunge, 1982). This is most often done using thin-section microscopy and well developed presently X-ray, neutron, and electron diffraction (EBSD) techniques (e.g. Kocks et al., 1998).

The ODF f(g) may be expanded into a series of symmetrical generalized spherical harmonics (Bunge, 1982):
where

are symmetrical generalized spherical harmonics (SGSH) constructed to fulfill both constituent single crystal hexagonal symmetry and shales TI symmetry conditions. Clμν are coefficients of the SGSH that carry an information about shale texture. M(l) is a number of linearly independent spherical harmonics for specific symmetry. Note that in equation (1) ƒ4(g) represents truncation (to the order l=4) of the infinite expansion series of f(g).
Averaging the elastic constants by the ODF for transversely isotropic shales has been discussed in detail by Sayers (1994). For a transversely isotropic medium only five of the expansion coefficients C211, C221, C411, C421, C431 are independent. Furthermore, if the rotational symmetry axis of the TI medium is aligned with the Z axis of the right handed XYZ sample coordinate system and medium is composed of hexagonal crystals the coefficients C221, C421 and C431 vanish and only three non-zero coefficients (C011≡1, C211 and C411) contribute to the elasticity of the textured aggregate.’
Following Bunge (1982), the elastic constants of a textured polycrystalline aggregate C~ijkl can be approximated by a mean value Cijkl that may be expressed through the elastic constants of the constituent single crystal Cijkl and the orientation distribution function ƒ(g) of the aggregate. Integration of the single crystal elastic constants weighted by the ODF over all the values of the orientation domain g yields elastic constants in the Voigt approximation of uniform strain throughout the aggregate:

where g={φ1,Φ,φ2} is the orientation domain that employs the three Euler angles (cf. Morse and Feshbach, 1953). The ODF is normalized:

where

For a discrete orientation space g, equation (2) can be rewritten in the form:
Equation (4) explicitly defines the elastic constants of polycrystalline aggregate in the Voigt approximation as the arithmetic mean of the single crystal elastic constants weighted by the ODF f(g). A similar procedure of averaging over the elastic compliance tensor Sijkl yields a result consistent with the Reuss approximation of uniform stress throughout the textured aggregate. The Voigt-Reuss (VR) values are generally assumed to provide the bounding limits of the possible elastic constants of the polycrystalline aggregate (Hill, 1952). The separation of the Voigt upper and the Reuss lower bounds depends on the degree of anisotropy of the constituent minerals.
The Geometric mean concept applied here allows one to obtain a unique solution that is invariant to the averaging domain and lies within the VR bounds. It is worth noting that the elastic compliances Sijkl obtained by using the Reuss approximation do not give the elastic constants Cijkl obtained by using the Voigt approximation. Therefore, the most physically meaningful average would be the one that allows invertibility of elastic stiffnesses into elastic compliances. Following Matthies and Humbert (1993) the elastic constants of the aggregate averaged by the Geometric mean method may be schematically expressed:
where ⟨Cijkl⟩ are the Geometric mean averaged elastic constants of the textured rock. ⟨Cijkl⟩ are independent of the averaging domain and, therefore, represent unique solutions of the ODF averaging procedure. The Geometric mean averaging fulfills the requirement of elastic stiffnesses to compliances invertibility, as averaging over either elastic constants or compliances yields an identical result.
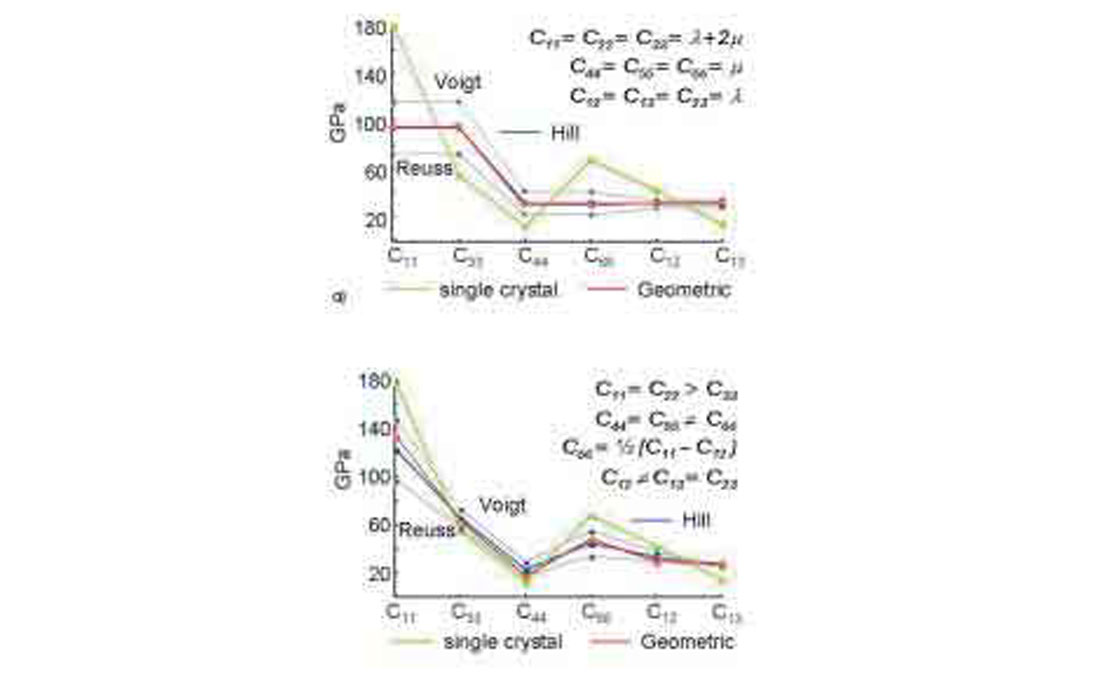
In the case of random orientation distribution of constituent minerals, shales would be seismically isotropic (Fig. 4a). A well developed clay mineral texture such as seen in the Colorado shale (Fig. 2) results in seismic anisotropy. The elastic constants obtained from the Geometric mean ODF averaging procedure are shown in Fig. 4b. The elastic stiffnesses calculated using the Geometric mean technique to average stiffnesses and compliances coincide and provide a unique averaging solution within the VR bounds. Elastic constants calculated under the Voigt, Reuss and Hill assumptions also are shown for comparison. The results obtained indicate that, as expected, intrinsic elastic anisotropy is reduced with respect to the single crystal anisotropy (Fig. 4). However, intrinsically shales can be highly anisotropic if compared to the majority of sedimentary rocks (see Thomsen, 1986).
Velocity calculation
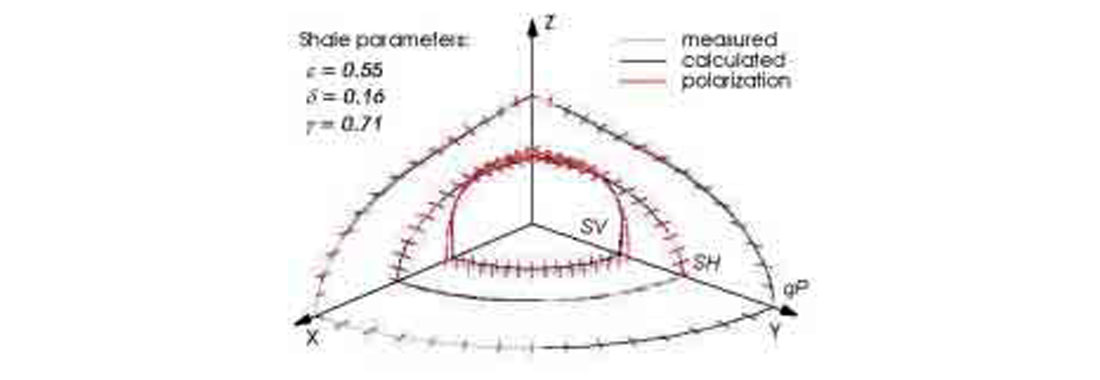
Elastic constants of the polycrystalline aggregate obtained from the averaging procedure described previously were used to calculate intrinsic phase velocities of shales by solving the Christoffel equation1 (cf. Musgrave, 1970). Solution of the cubic Christoffel equation for any specific slowness direction yields three positive values of the squared phase velocity, which correspond to the quasi-P-wave and two quasi-S-waves in an anisotropic medium. Prefix ‘quasi’ refers to complications with regards to the relationships between wave propagation and polarization directions. In an anisotropic medium pure P and S modes exist only in so-called ‘longitudinal directions’ (Helbig, 1993), i.e. along the symmetry axes. Phase velocity surfaces resulted from the solution of the Christoffel equation for all wavefront propagation directions within the symmetry planes are shown in Fig. 5. Phase velocity surfaces are normalized in order to be comparable with those of the Chattanooga Shale (Johnston and Christensen, 1995). Chattanooga Shale elastic constants were obtained from the laboratory ultrasonic measurements at a confining pressure of 50 MPa and reflect mainly the intrinsic properties of the shale predominantly composed of illite (Johnston and Christensen, 1995). The experimentally observed P-wave anisotropy of Chattanooga Shale can be explained on the basis of intrinsic anisotropy and attributed to textural shale properties, which is in agreement with Johnston and Christensen’s (1995) conclusions. The calculated and measured shear wave surfaces have very similar elastic behaviour with the higher calculated intrinsic anisotropy of shear waves due to the relatively low value of the modelled ⟨C44⟩ elastic constant.
Discussion and conclusions
The intrinsic elasticity of shales has been modelled by the ODF averaging of the elastic constants of shale constituent minerals. The VR bounds allow significant variation in the values of intrinsic elastic constants of shales (Fig. 4a). Therefore, the Geometric mean method has been applied with the ODF averaging procedure. Unique Geometric mean solution fulfills the requirement of the stiffnesses to compliances invertibility and lies within the VR bounds relatively close to the Hill average (Fig. 4).
The elastic constants obtained by the Geometric mean averaging were used to calculate phase velocities (Fig. 5). Normalized compressional and shear waves phase surfaces are in good agreement with those calculated from the elastic constants of the Chattanooga Shale reported by Johnston and Christensen (1995). The elastic constants obtained from ultrasonic velocity measurements at a confining pressure of 50 MPa have been used in the phase velocity calculation because at this confining pressure effects of pores and microcracks are significantly reduced and velocity anisotropy reflects mainly intrinsic elastic properties of Chattanooga Shale with illite as the predominant clay mineral.
Modelling of the intrinsic anisotropy of shales is based on several assumptions including simplified shale mineralogical composition, the elasticity of the constituent minerals, and the orientations of clay mineral platelets. Each of these assumptions may not hold in real shales and, therefore, calculated and observed phase velocity surfaces are not expected to coincide completely. Furthermore, the overall elasticity of shales depends not only on intrinsic mineralogical properties but also on the presence of oriented microcracks (e.g Vernik, 1993), the amount of the fluid-filled porosity (e.g. Hornby, 1998) and the in situ distribution of stresses (Sayers, 1999), i.e. factors that may significantly influence seismic anisotropy and cannot be ignored. Models that incorporate these factors should be based on the assumption of initial intrinsic anisotropy of shales for the proper estimation of overall shale elasticity.
While these calculations provide insight into the anisotropy of shales, the results are best employed after experimental testing. We currently are carrying out a COURSE funded project to construct a database on shale elasticity on core samples from the Western Canadian Sedimentary Basin. We would be very interested in obtaining high quality core samples of shales if available.

Acknowledgements
This work is supported by a research grant from the Petroleum Research Fund administered by the American Chemical Society and by D. Schmitt’s NSERC discovery grants.


Join the Conversation
Interested in starting, or contributing to a conversation about an article or issue of the RECORDER? Join our CSEG LinkedIn Group.
Share This Article