The Late Jurassic-Early Cretaceous Vaca Muerta (VM) Formation in the Neuquén Basin has served as an important source rock for many of the conventional oil and gas fields in Argentina. With the interest in developing and exploiting the shale resources in the country, many companies there have undertaken the characterization of the VM Formation in terms of the elements of shale plays.
Amongst other characteristics, shale plays can be identified based on the total organic carbon (TOC) content, as better TOC leads to the better production. However, there is no way of measuring TOC directly using seismic data, and it can only be estimated in an indirect way. Considering the influence of TOC on compressional, shear velocities and density, geoscientists have attempted to compute it using the linear or nonlinear relationship it may have with P-impedance. Understanding the uncertainty in using such a relationship for characterizing VM Formation, a different approach has been followed for characterizing it. As a linear relationship seems to exist between GR and TOC, in addition to P-impedance, gamma ray (GR) is another parameter of interest for characterizing the VM Formation.
In this study, using P-impedance and GR volumes, a Bayesian classification approach has been followed to obtain a reservoir model with different facies based on TOC and the associated uncertainty with it. As the first step, we defined different facies based on the cutoff values for GR and P-impedance computed from well-log data. Having defined the different facies, Gaussian ellipses were used to capture the distribution of data in a cross-plot of GR versus P-impedance. Next, 2D probability density functions (PDF’s) were created from the ellipses for each of the facies. Combining these PDF’s with GR and P-impedance volumes, different facies were identified on the 3D volume. Post-stack modelbased inversion was used to compute the P-impedance volume while probabilistic neural network (PNN) approach was used to compute GR volume. Both derived P-impedance and GR volumes correlated well at blind wells on the 3D volume, which lent confidence in the characterization of VM Formation. An overlay of the discontinuity detail in terms of curvature lineaments on the determined TOC content at the level of interest helps in getting a more complete picture, which is helpful for the planning of horizontal wells.
Introduction
The Neuquén Basin in Argentina was developed as a result of an extensional rifting in the Late Jurassic established between a back-arc to the west, associated to the Sudamerican Plate, and a passive margin to the east. Subsequent deposition, thermal subsidence and structural evolution lead to the recognition of five different geographic areas (Figure 1) in the basin, which are the (1) thrust belt area to the west called the Malargüe-Agrio Foldbelt, (2) Northeast Platform, (3) Embayment in the center, (4) the Huincul Uplift adjoining the Embayment to the south, and (5) Picún Leufú sub-basin to the south west. All these areas form the elongated northwest to southeast shape of the Neuquén Basin as seen in Figure 1.
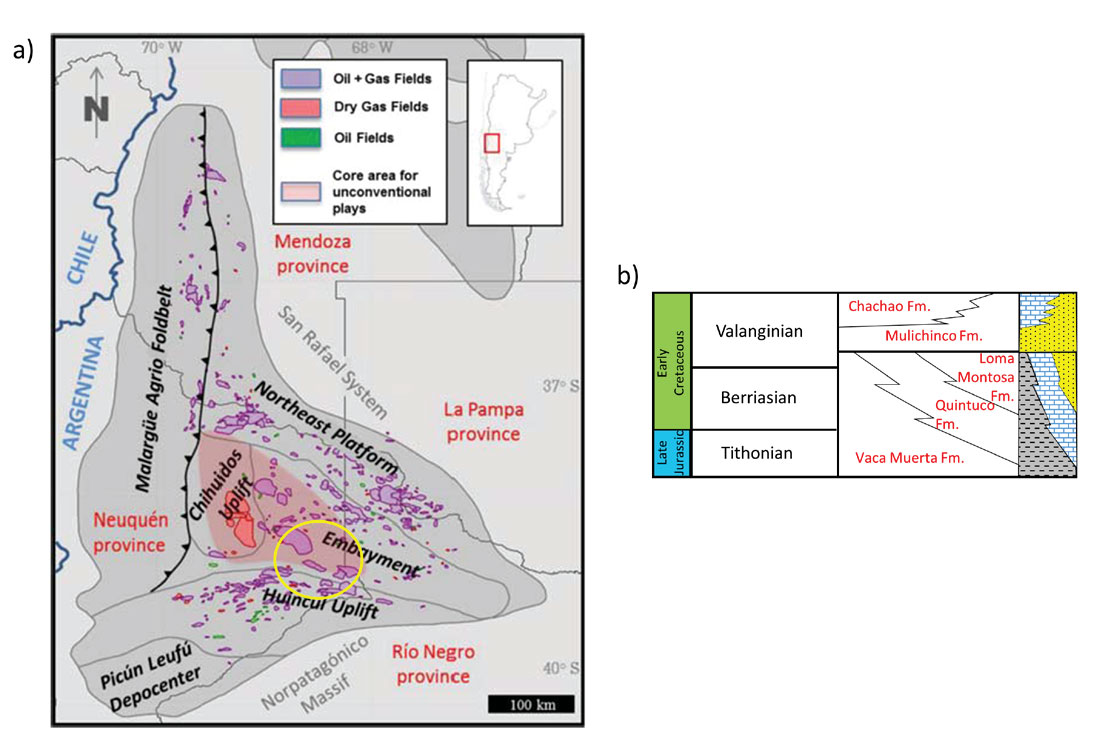
Based on the subsurface data from the electrical and acoustic log curves, mud logging data, as well as borehole images, extensive facies studies have been carried out in the Neuquén Basin. It has been found that the VM Formation comprises a variety of lithologies that include organic-rich calcareous shales, marls, carbonates, calcareous sandstones and sandstones (Ortiz Sagasti et al., 2014; Fantin et al., 2014; Sylwan, 2014).
The present available description of the VM Formation includes the following. It is composed of amorphous organic matter associated with marine plankton and equivalent to type II or IIS kerogen (Tissot et al., 1974). With regard to thermal maturity, the maximum vitrinite reflectance, Ro, varies between 0.8 to 2%. The TOC varies between 3 to 8%, and found to be higher in the lower parts of VM Formation (Sylwan, 2014). As studied by Wavrek et al. (1994), the Embayment area is inhabited by Type A-1 oil, which is light (30-45° API) and thermally mature. Similarly, petrophysical analysis on log data shows that porosities vary between 4 and 12% in the VM Formation, with the lower intervals exhibiting porosities with 8 and 12 % and between 4 and 8% in the upper intervals (Di Benedetto et al., 2014).
Theory/Method
For a shale reservoir to become a successful shale resource play, the following characteristics need to be considered: (a) organic richness (TOC), (b) maturation (Ro%), (c) thickness, (d) gas-in-place, (e) permeability, (f) mineralogy, (g) brittleness, and (h) pore pressure. Besides all these the depth of the shale gas formation should also be considered as it will have a bearing on the economics of the gas recovery. An optimum combination of these factors leads to favorable productivity (Chopra et al., 2012).
Determination of TOC content allows us to identify the source rocks. Borehole measurements such as well log curves, and geochemical analysis and measurements on cores and cuttings are some direct ways of estimating TOC. These methods are applicable only at well locations. However, our goal is to characterize the source rocks not vertically, but laterally, for deciding on the location of horizontal wells in the area. Thus, seismic data play an important role in identifying the sweet spots as they are acquired over large areas. The determination of TOC content directly from the seismic data is a difficult task, but can be attempted indirectly as we describe in this study. It is well known that TOC influences compressional velocity, shear velocity and density of the rock intervals. Thus, it should be possible to detect the changes in TOC from the seismic response. Additionally, there is evidence of a linear relationship between the uranium content in shale and its organic content. Consequently, a large GR response is expected for organic rich shale formations. Thus, we should be able to identify the source rocks with the help of GR response.
As mentioned above, the P-impedance and GR are two important parameters for identifying the source rocks in terms of the TOC. While P-impedance can be determined by the different available methods of impedance inversion, there is no direct way of computing GR volume from seismic data. Extended elastic impedance (Whitcombe et al., 2002) provides a way of computing it from seismic data, but for the case study at hand the lack of prestack data prevented us from using it. As only stacked data was available, a neural network approach was used for achieving our goal. Neural networks make it possible to predict suitable petrophysical properties such as porosity, GR, water saturation, etc. away from the well, using a nonlinear relationship between the seismic data and different derived attributes with petrophysical properties (Singh et al., 2007; Calderon and Castagna, 2007).
Characterization of VM Formation
A feasibility study was taken up for characterizing the VM Formation with the use of stacked seismic data along with the available well log curves and geochemical data. By using the TOC values from geochemical analysis of source rock cutting samples, and the acoustic impedance from well log data, Løseth et al. (2011) had demonstrated that the acoustic impedance decreases nonlinearly with increasing TOC percent. This relationship was then used to transform a seismic acoustic impedance data volume into a TOC volume. With this in mind and using similar data, we cross-plotted P-impedance and TOC to see if any relationship existed between these two attributes. This crossplot is shown in Figure 2 and it appears that both, a linear or a nonlinear curve could be a reasonable fit to the data points (as indicated). But the important point to note is that whichever relationship is used, the high TOC intervals will remain underestimated both ways. This is a limitation of the Løseth et al. (2011) approach, and predicting TOC only based on such an approach would have an inherent uncertainty and so was not considered advisable.
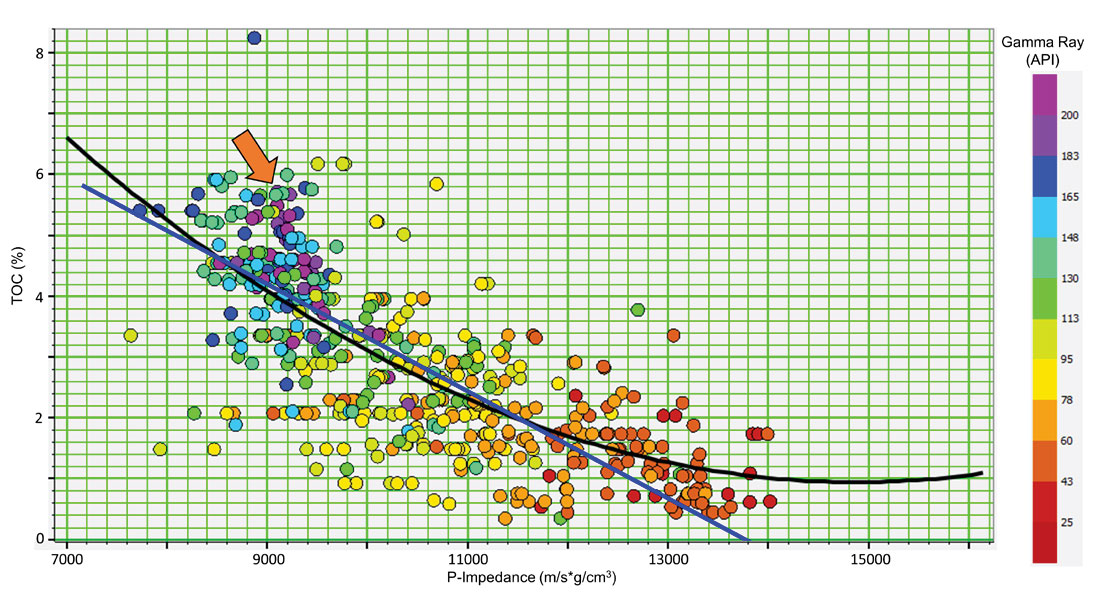
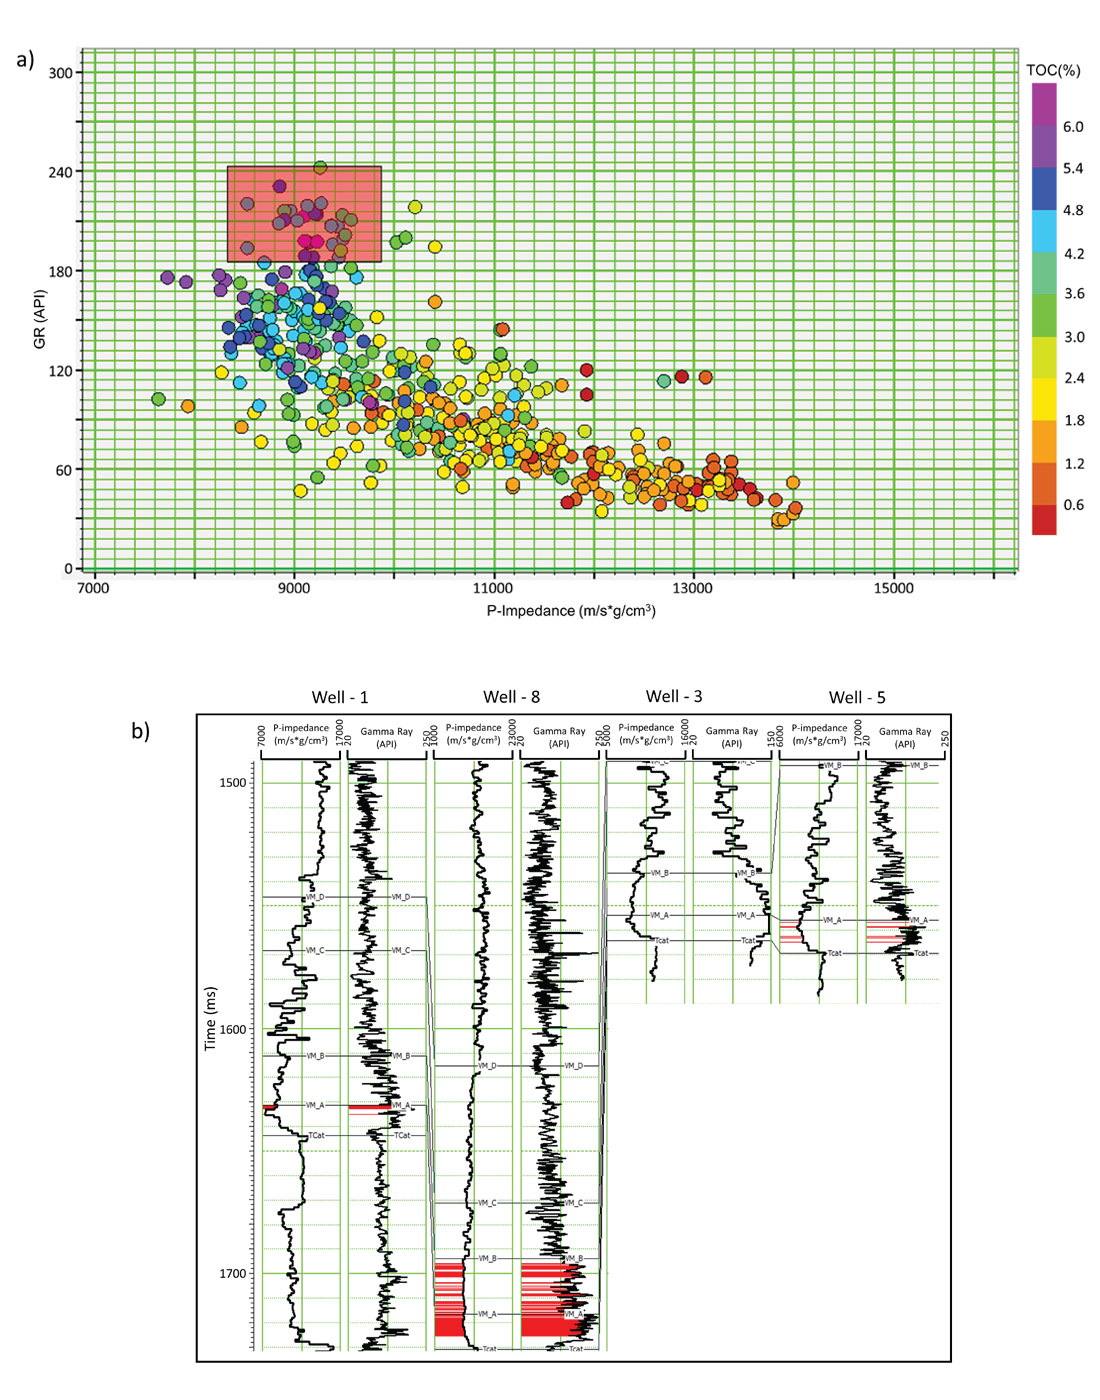
Given the fact that the GR response is related to organic richness it was used to color-code the crossplot and as seen in Figure 2, a better correlation of high GR with high TOC is noticed. We also crossplotted P-impedance against GR and color coded it with TOC as shown in Figure 3a. As high values of both TOC and GR are the characteristics of a better quality shale play, we enclosed such points on the crossplot with a red polygon and back projected them to the well log curves shown in Figure 3b. We notice that most of the points enclosed in the red polygon are coming from the deeper reservoir zone as expected suggesting that the P-impedance and GR can together be used to differentiate between deeper and shallower part of the reservoir. However, such differentiation would not be possible based on the TOC estimated from the P-impedance using a linear/nonlinear relationship. Even if differentiation were achieved, uncertainty would still exist in terms of quality of the shale.
As we are attempting to characterize the VM shale reservoir from seismic data, it is possible that different models that we deduce have the same seismic response. Of course some of these models will be more probable than others, which we could term as being realistic. Consequently, we followed an approach that accounts for the uncertainties associated with the reservoir characterization of VM Formation. This work follows the Bayesian classification approach and provides a facies model reflecting the quality of the shale and a related uncertainty analysis.
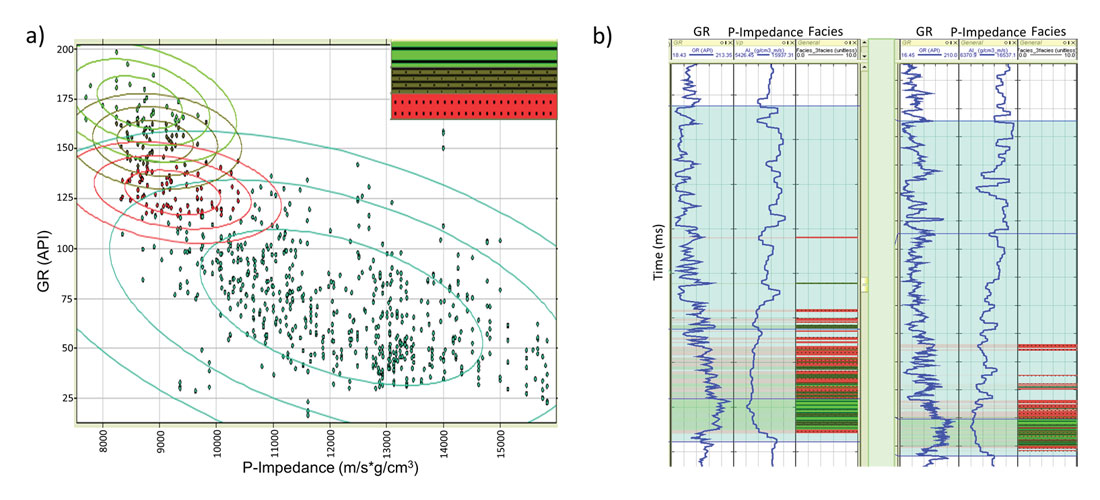
To execute the Bayesian approach, different facies were defined based on the cut off values of GR and P-impedance. Armed with this facies information, the probability distribution functions were generated for them using Gaussian ellipses. These ellipses are shown in Figure 4 where three facies are defined in green (facies 1), dark green (facies 2) and red (facies 3) colors. Based on the P-impedance and GR values, the quality of shale play must increase from red to green color. Observing the defined facies on the well log panel, it was concluded that quality of the VM Formation increases with depth which is reasonable based on the known geological history.
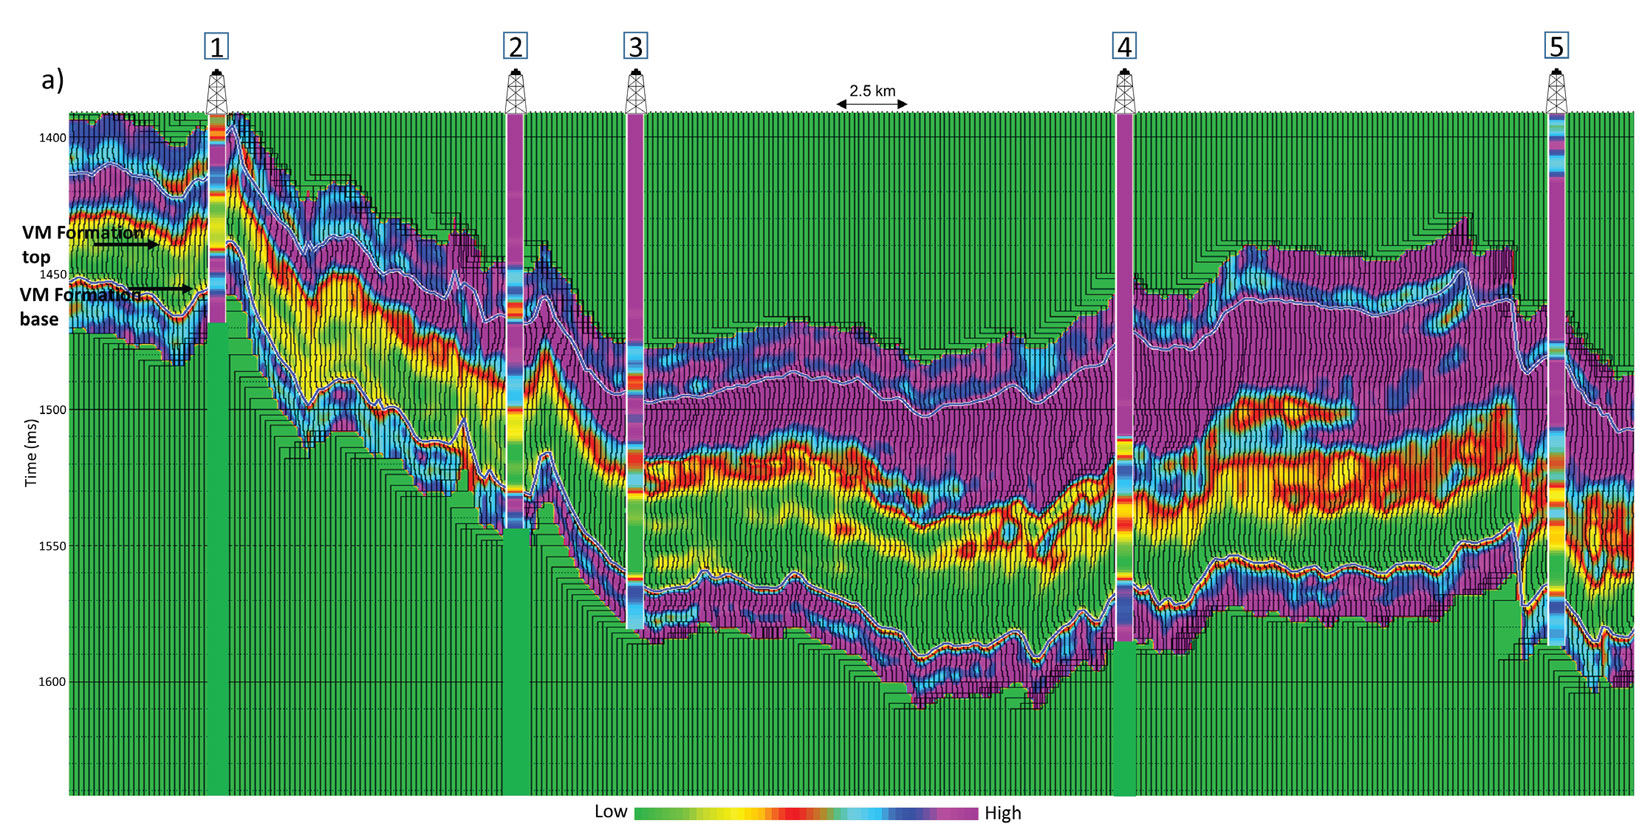
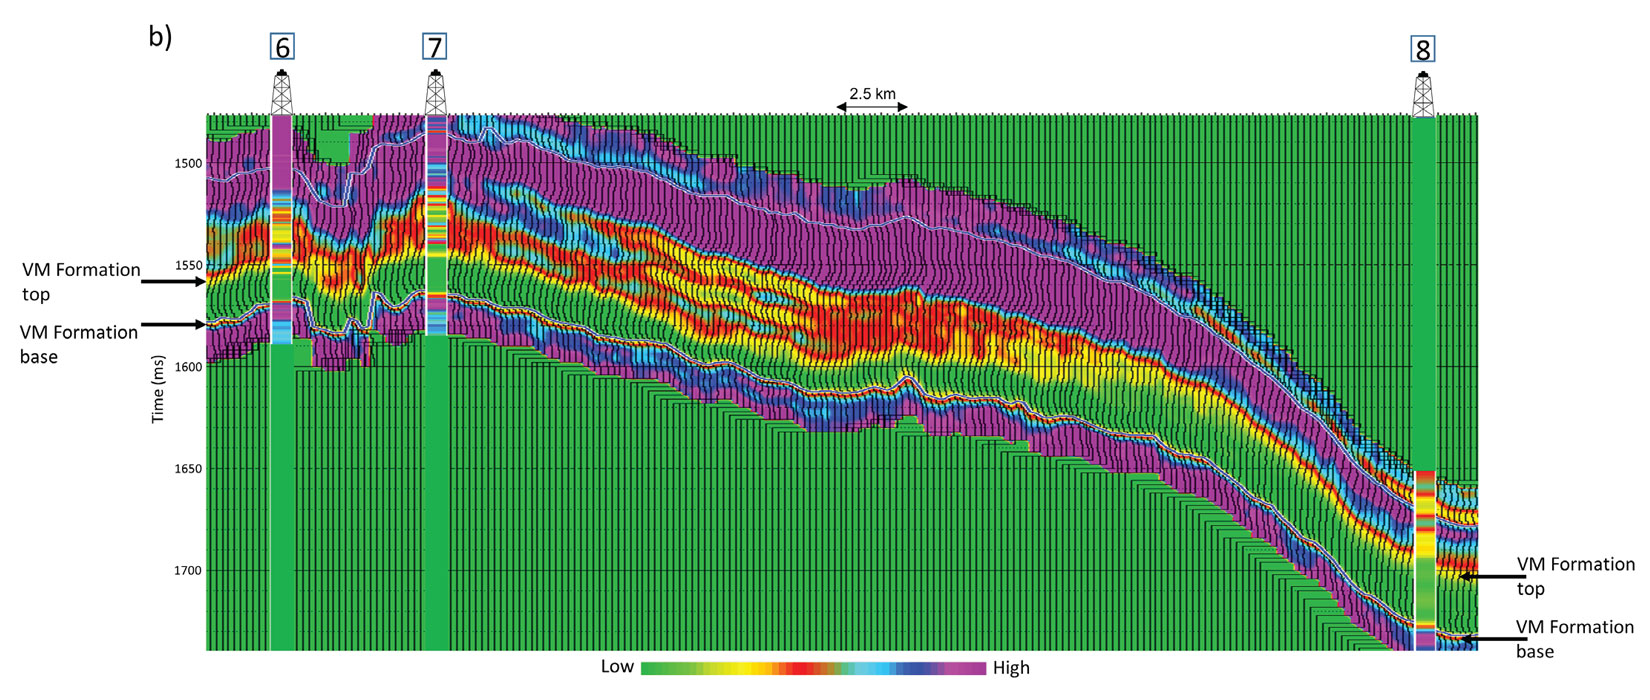
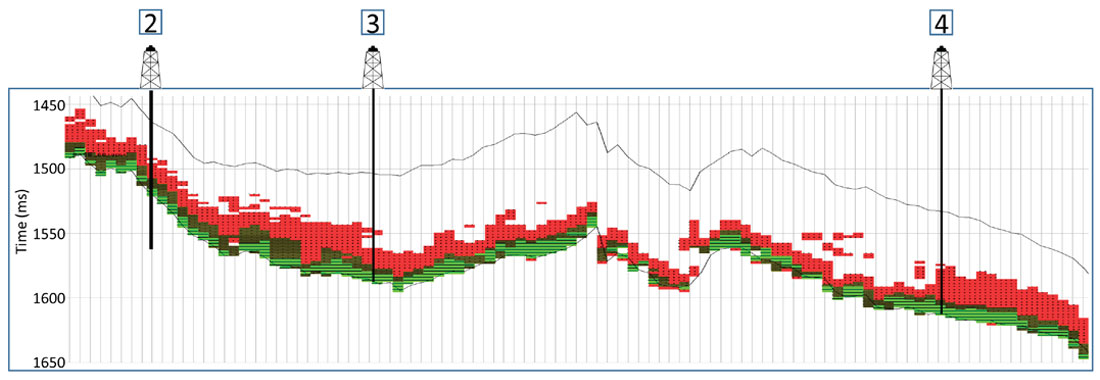
Having gained the confidence in characterizing the VM Formation based on the well log curves, we turned to deriving the seismic P-impedance and GR volumes. For computing P-impedance, stacked seismic data was first conditioned in terms of enhancing the S/N ratio. A low-frequency model was created using 5 of the 8 wells, keeping the other three as blind wells. After observing a good correlation at the blind wells, modelbased inversion was used to invert the seismic data. The routine QCs were performed in the exercise that included inversion analysis at well locations, overlay of acoustic impedance logs (filtered to the seismic bandwidth) on the acoustic impedance sections, and crossplotting the predicted and actual acoustic impedance values at well locations. When we found all these results encouraging, we proceeded with the inversion of the complete volume. Two portions of an arbitrary profile passing through the wells were extracted from the inverted impedance volume and are shown in Figure 5. A good match between the inverted and measured impedance was found at each of the well locations, which provided the confidence in the inversion process used. The complete path of the arbitrary line is shown in Figure 12.
For computing the GR volume, multiattribute regression and PNN were used. The detailed theory and workflow on PNN can be found in Hampson et al. (2001). The different steps followed were, first, multilinear regression analysis followed by selection of optimized parameters and attributes using cross-validation criteria. Next training of PNN networks was carried through and finally the trained PNN network was run on the selected seismic attributes for prediction of the desired property. The multi-linear regression analysis run on seismically derivable attributes was performed using 8 wells as shown in Figure 10. The convolution operator length and optimum number of attributes were chosen using the cross-validation criteria (Hampson et al., 2001). While the additional attributes always improve the fit to the training data, they may be useless or worse when applied to new data not in the training set. This is sometimes called overtraining. In the process of cross-validation, one well at a time is excluded from the training data set and prediction error is calculated at the blind well location. The analysis is repeated as many times as there are wells, each time leaving out a different well.
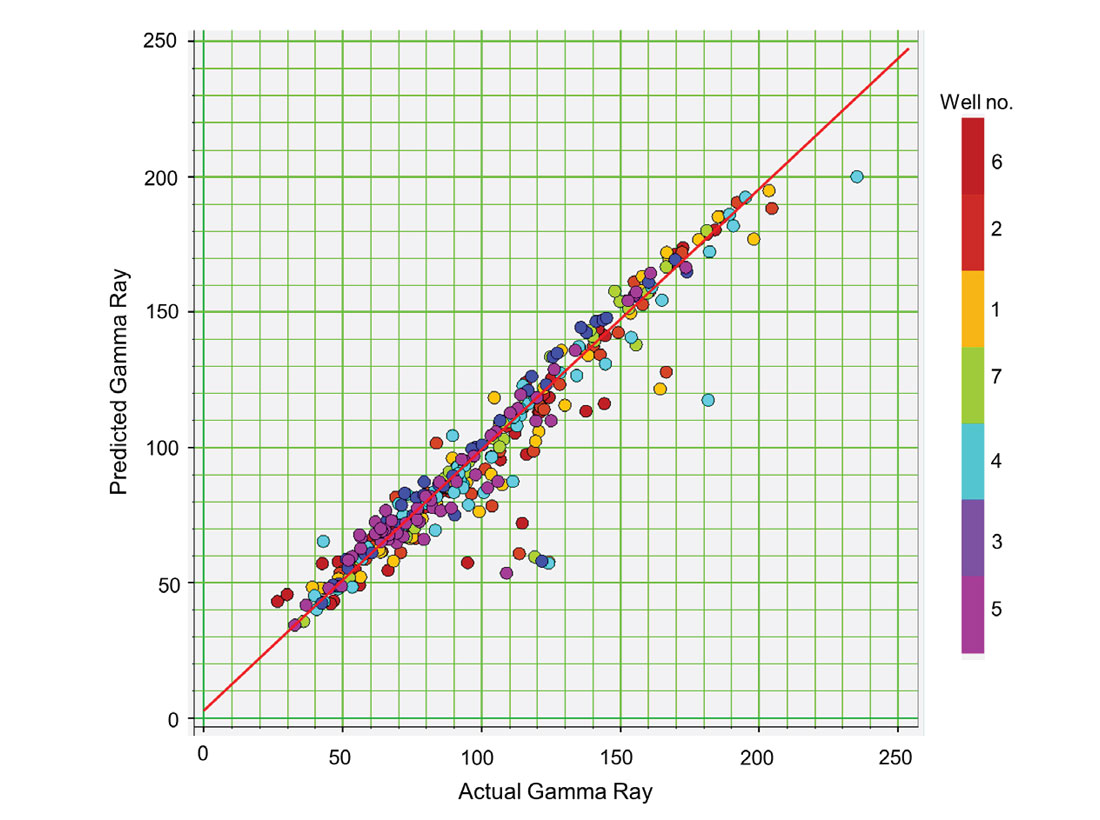
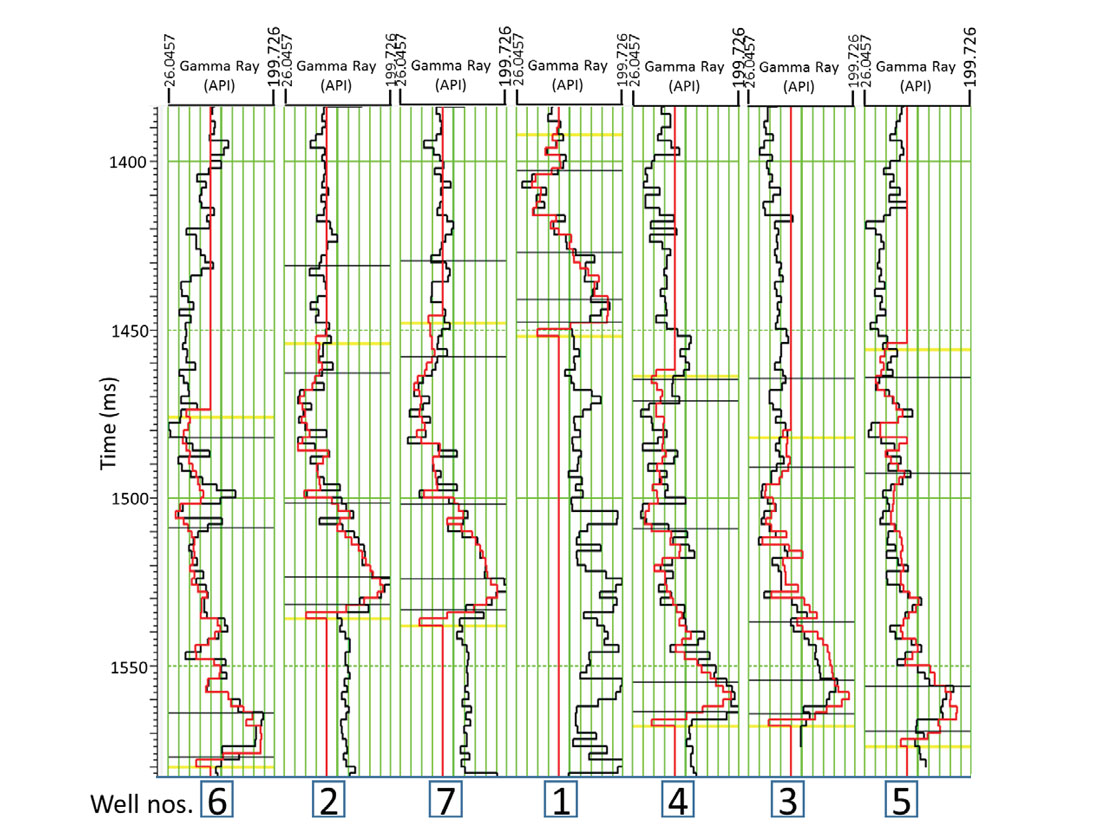
An operator length of 9 samples gave the minimum validation error with 5 attributes. The attributes were 1/ (P-impedance), average frequency, integrated absolute amplitude, filter of (25/30 -35/40) and filter of (5/10 -15/20) on seismic data. By performing the stepwise regression and validation tests before training the PNN, the problem of overfitting the data is eliminated. Figure 6 shows the cross plot of the actual and predicted GR response at different well locations, where a correlation of 95% is seen. Validation correlation between the actual and predicted GR logs is shown in Figure 7, and again a good correlation is seen. Looking at the 5 attributes used in the analysis, one notices the dominance of the frequency-dependent attributes that is biased on the low-frequency side, and may wonder about the rationale for their application. We believe the low-frequency dominance in the broad zone of interest is associated with the presence of fractures and the hydrocarbons in the reservoir. Their combination with the 1/ (P-impedance) attribute makes lithology prediction become feasible.
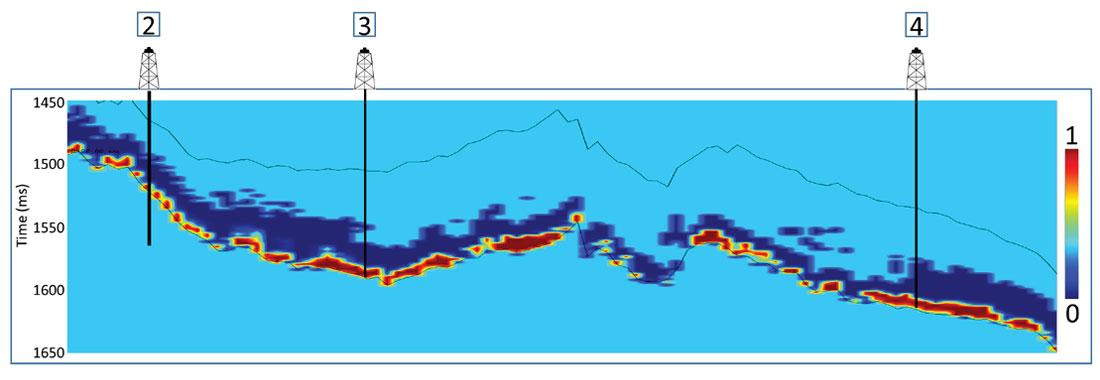
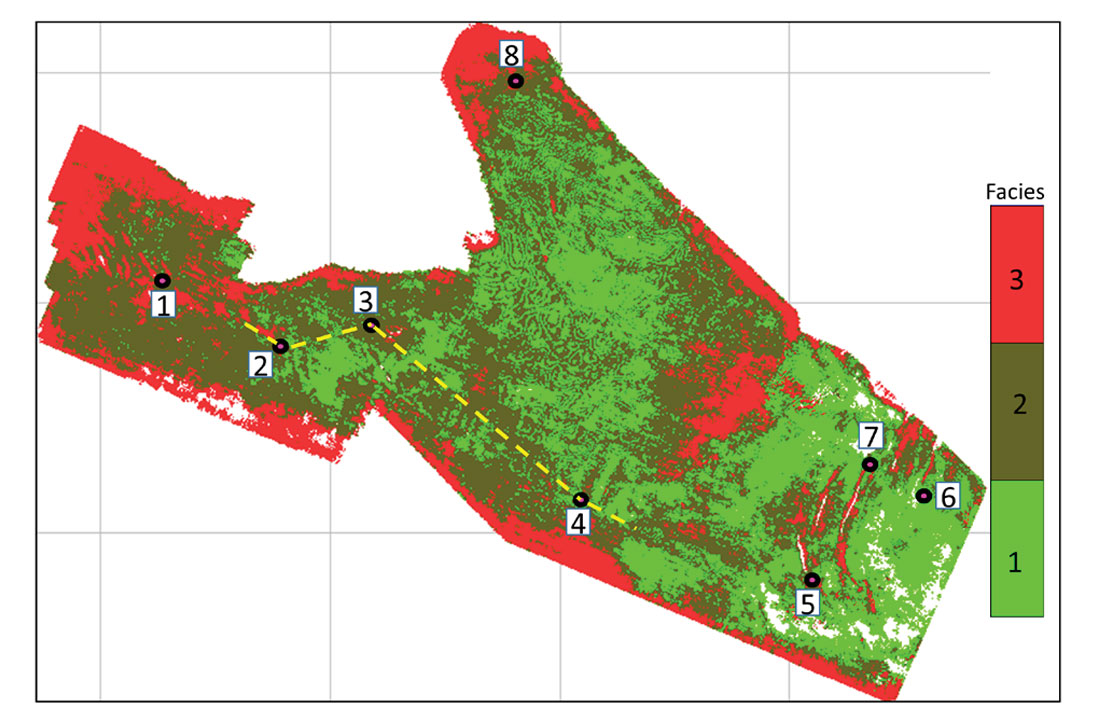
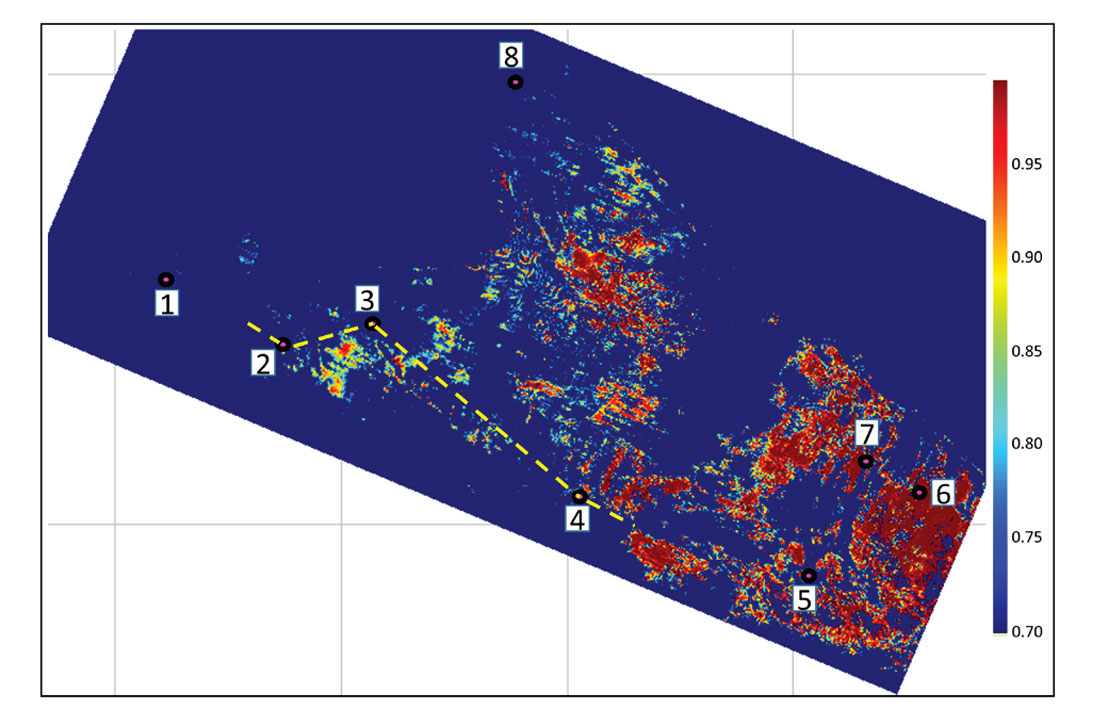
Using the probability distribution function of each facies generated earlier from well log data analysis, and inverted P-impedance and GR volumes, Bayesian classification generated the facies volume and probability volume of each facies. Figure 8 shows an arbitrary line extracted from the facies volume and passing through three wells (that have TOC measurements from cores). We find that the quality of the shale reservoir is better in the lower part of the VM formation and also the thickness of facies 1 (green) increases from shallower part to the deeper part of the interval, as expected from the geological information. A similar section extracted from the probability volume for facies 1 is shown in Figure 9. The color scheme represents probability of this facies, with brown color representing higher probability of occurrence of facies 1. In a similar way, the probability distribution of other facies can be extracted. For detecting the probable sweet spots horizon slices were extracted from the facies volume at different levels. Figure 10 shows one such horizon slice extracted 8ms above the base of reservoir, where facies 1 seems to dominate the display. Finally, in Figure 11 we show a map depicting the probability of occurrence of facies 1. The hot colors on this map indicate zones where the probability of occurrence of facies 1 is 85% and above. As facies 1 corresponds to high TOC, these zones were treated as sweet spots. This map correlated well at the well locations in this interval, which enhanced our confidence in the results. Similar analysis were carried out for other intervals exhibiting different facies.
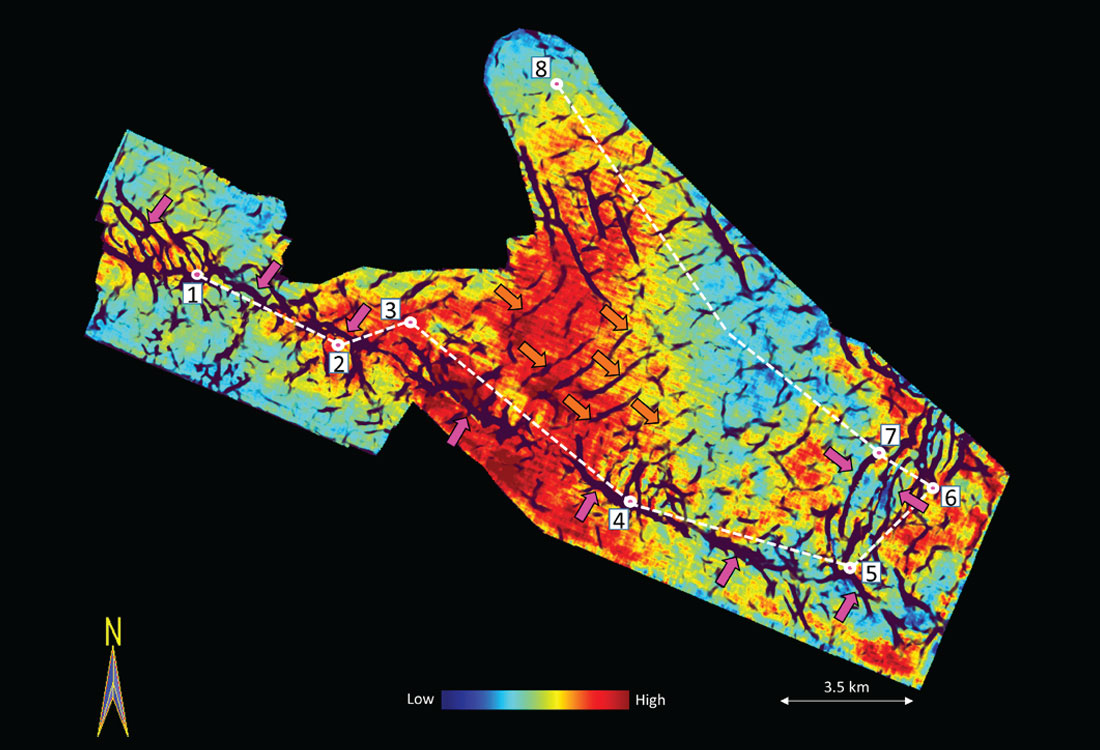
For purpose of comparison of our workflow with the Løseth et al. (2011) approach, the P-impedance volume was transformed using the non-linear trend shown in Figure 2. A horizon slice 8 ms above the base of the reservoir is shown in Figure 12. Notice that the distribution of the hot colours showing the favourable pockets on the TOC display are different from the sweet spots determined using the proposed workflow. Overlaid on the TOC display is the most-positive curvature attribute using transparency. While the seismic signature of some of the bigger and coherent lineaments as marked with magenta arrows confirms them as faults, many of the consistent and weaker lineaments indicated with orange arrows have been interpreted as Aeolian events associated with mega dunes (Cardoso et al., 2012; Trinchero et al., 2013). The characteristics of the sedimentary events that deposited the basal part of the VM sequence have been studied based on the geology of the area as well as the well data. These events are not conspicuous on the seismic amplitudes, but can be detected easily on the curvature attribute displays. A clear distinction between such events and lineaments with other orientations can therefore be made on the display shown in Figure 12. Lineaments with other orientations could be associated with faults and fractures, and confirmed with image logs available in the area. Such lineaments should be considered carefully while deciding on the location of the horizontal wells to be drilled in the VM Formation.
Conclusions
Determination of TOC in shale resource reservoirs is a desirable goal in most projects carried out for characterization of unconventional reservoirs. TOC calculations based on linear or non-linear relationships between acoustic impedance from log data and TOC values could lead to uncertainty and was not found suitable for use in the characterization of the VM Formation. The application of post-stack model-based P-impedance, and GR volume derived using PNN, coupled with Bayesian classification approach, provided a useful workflow for defining different facies in the VM Formation, and hence the quality of the shale. This workflow has the potential of good application to other shale plays around the world.

Acknowledgements
We thank Arcis Seismic Solutions, TGS, and Pan American Energy LLC for allowing us to present this work.


Join the Conversation
Interested in starting, or contributing to a conversation about an article or issue of the RECORDER? Join our CSEG LinkedIn Group.
Share This Article