Introduction
The Athabasca oil sands contain more than a trillion barrels of oil within the Cretaceous McMurray Formation of northeastern Alberta. In most of the oil sands area, the McMurray Formation is generally considered to be a compound estuarine valley system characterised by multiple cuts and fills. It is bounded below by Devonian rocks at the pre-Cretaceous unconformity and above by the widespread transgressive marine shales and sands of the Wabiscaw Formation. In the Long Lake area, it is 60 to 100m thick, with net pays of greater than 40m. Still, its complexity is legendary. Stacked channel deposition exhibits a high degree of reservoir variability both vertically and laterally making lithological predictability difficult.
Traditionally, at least 8 and often many more vertical wells per square mile are drilled and cored to obtain enough data to be confident in defining a SAGD1 project area. Even then, significant variations occur between wells. 3D seismic data has been used successfully in the past mainly to define the base of the zone of interest (there is a strong reflector at the Cretaceous-Devonian boundary), and the gross thickness of the interval. Various attempts have been made to decipher the internal composition of the channelled interval with limited success.
Objective
In this paper, I describe the method, application and results of a technique of quantitatively extracting and classifying elastic rock properties from seismic data. The extraction process uses AVO (amplitude vs offset) analysis to separate the compressional (P-wave) and shear (S-wave) components of the seismic data. The resulting components are then used to calculate physical rock properties2 such as shear rigidity (mu) and incompressibility (lambda). It is common knowledge among oil sands geoscientists that the density log through the McMurray Formation shows a strong correlation to the gamma ray log and is therefore a good lithology indicator. Recent work directed at determining facies from seismic relies on an estimate of density from the seismic data. In this process I incorporate an estimate of density obtained from seismic using a neural-network approach3.
Method
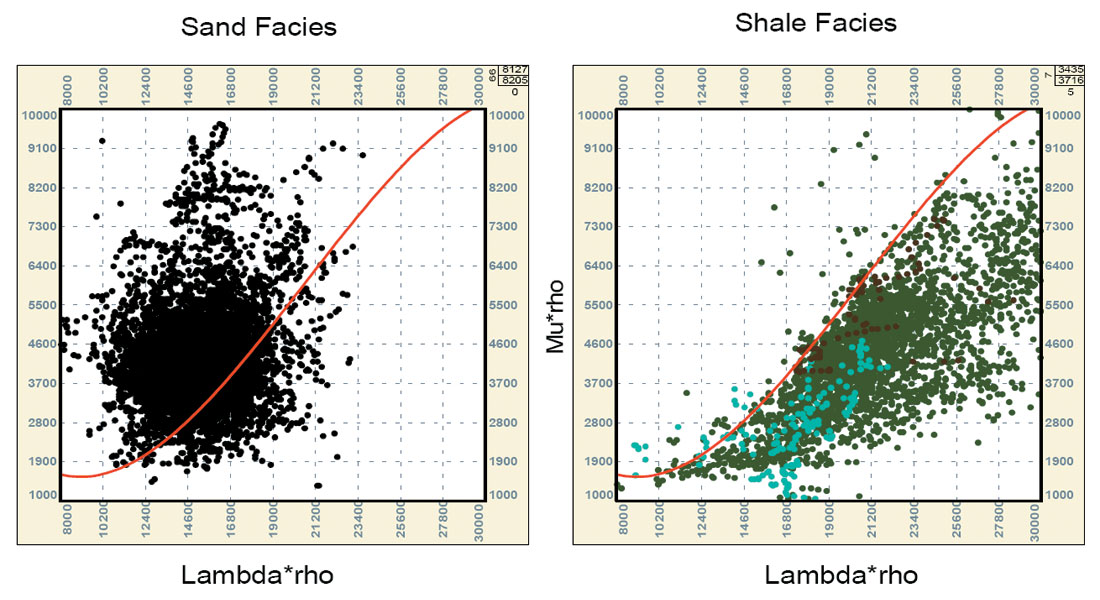
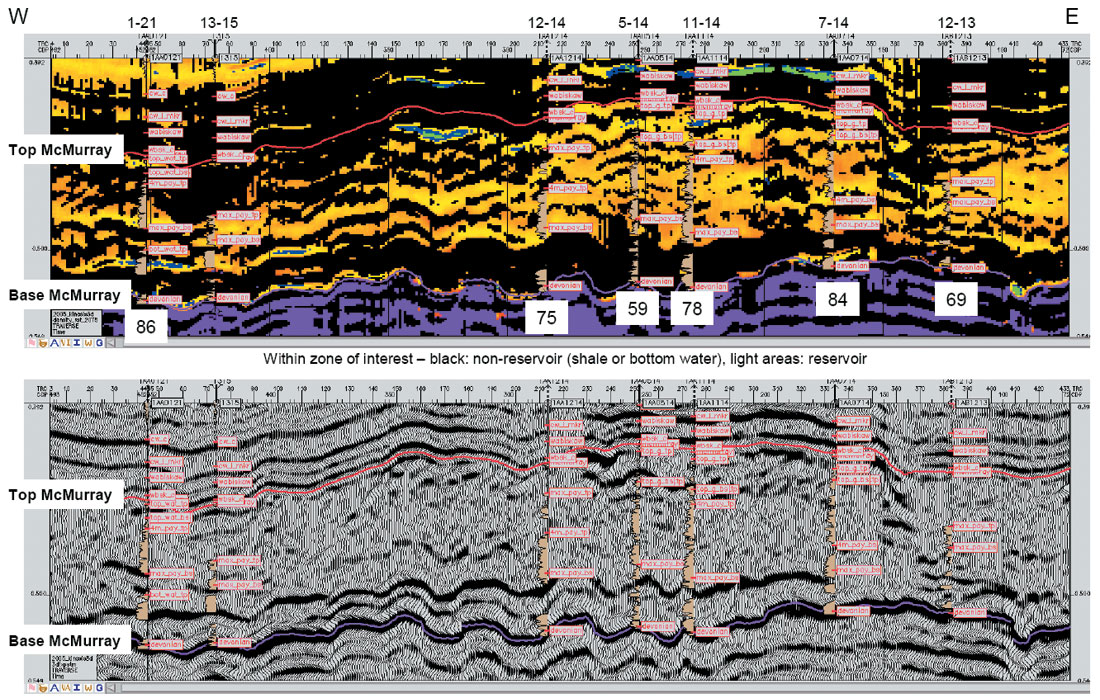
Wireline logs directly (or indirectly) measure P-wave velocity, S-wave velocity and density. Integrating this data with core and log analysis, the lambda and mu properties are calculated and assigned lithologies and fluid properties. Detailed quality assessment and cross-plot analysis is carried out to assign empirical limits and guidelines for lithology and fluid discrimination based on the measured rock physics properties ( figure 1). The determined relationships are then used to calibrate and classify the seismically-derived properties. The result is a seismic volume transformed to a detailed lithological characterization of the reservoir within the zone of interest. Drilling results are shown to validate and quantify the success of the method (figure 2).
Applying this technique over a project area allows more confident mapping of the channels and the reservoir quality and continuity within the channels. A few of the potential benefits in oil sands areas include fewer vertical wells required to define the resource area, and more confidently placed horizontal wells for optimal production.


Join the Conversation
Interested in starting, or contributing to a conversation about an article or issue of the RECORDER? Join our CSEG LinkedIn Group.
Share This Article