Increasing interest and activity in coalbed methane production in Western Canada has led to an urgent need for effective and efficient technologies for coal evaluation. Surface seismic methods are effective in delineating lateral coal zone continuity and areal extent, and for mapping faults, channel-cuts and small-scale structures that may hinder methane production. Some numerical modeling and field examples of high-resolution surface seismic data will be shown. Coal quality, however, is of key importance in field development, and cannot be easily mapped using surface seismic methods. Details such as vertical continuity (e.g. several thin seams vs. one thick seam) or cleat density and orientation are not easily assessed due to the limited resolution of surface seismic data. Higher bandwidth data recorded in vertical seismic profiles provide high-resolution images of coal zones, and may prove useful for reservoir development and production monitoring in addition to surface seismic data. Much room for growth exists in the application of seismic and other geophysical methods to the development of this valuable resource.
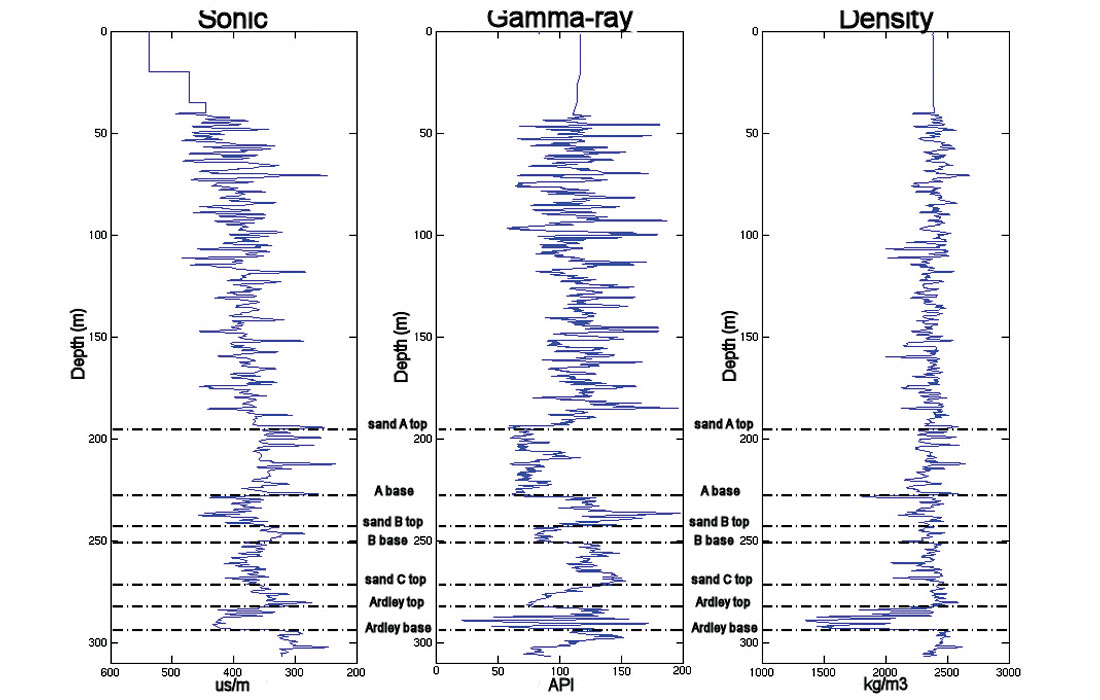
This study examines some of the uses of vertical seismic profiles at a project near Red Deer, Alberta, where the viability of enhanced coalbed methane production within the Upper Cretaceous Ardley coal zone was being tested. The coal zone is at depth of 282 m below the surface and is comprised of 6 seams, as seen in the log data in Figure 1.
Zero-offset vertical seismic profiles were acquired using three different sources, a 44,000 lb. vertical vibratory source (“big-P”), a smaller truck-mounted vertical vibratory source (“mini-P”), and a shear-wave source (“mini-S”), all of which effectively imaged the target coal zone. Bandwidth comparisons show relatively low attenuation of the mini-P dataset, suggesting that high-bandwidth P-P and P-S data may be obtained using a mini-P source. Although the upper and lower contacts of the Ardley coal zone at the site were effectively imaged using any of the three sources tested, only the high-bandwidth mini-P sourced dataset could detect lithological variations within the coal.
Acquisition with both compressional and shear sources allowed a detailed examination of the velocities of shallow strata overlying the coal zone to be made. Good correlation was found between velocities extracted from seismic data and those extracted from cased-hole sonic logs, with velocity dispersion of approximately 2.3% measured for P-waves, whereas shear-wave velocity dispersion was approximately 6.8%. Qp and Qs for the strata are estimated to be 31.4 and 9.7, respectively. These relatively low values indicate the attenuative nature of the strata, providing further evidence of the value of VSP data in combination with surface seismic.
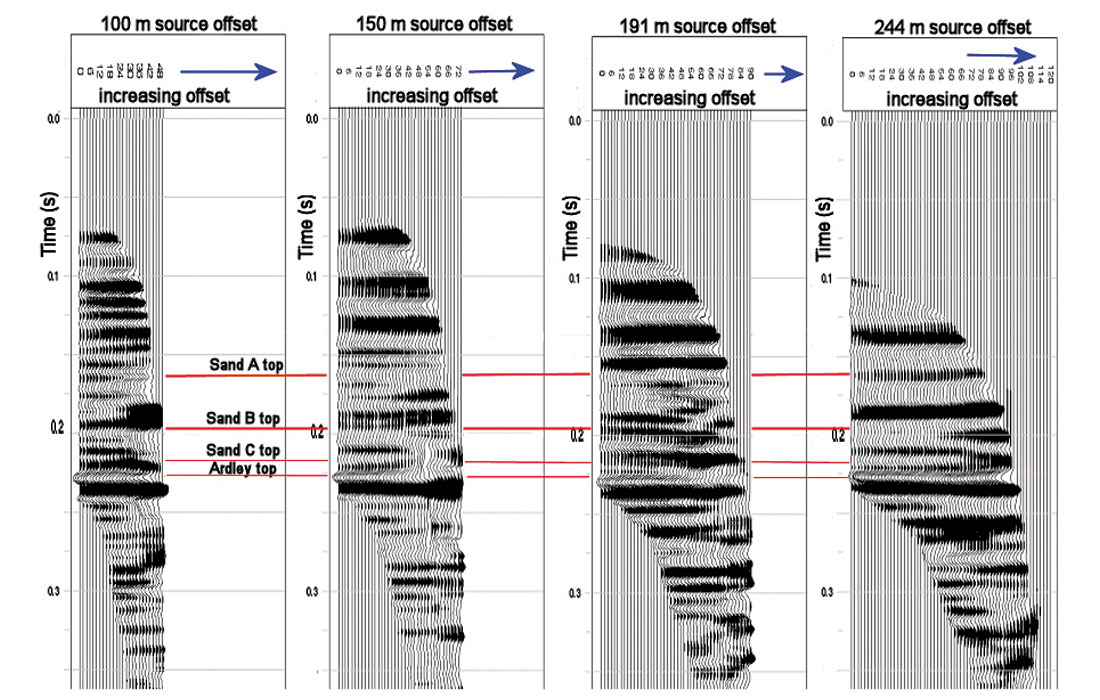
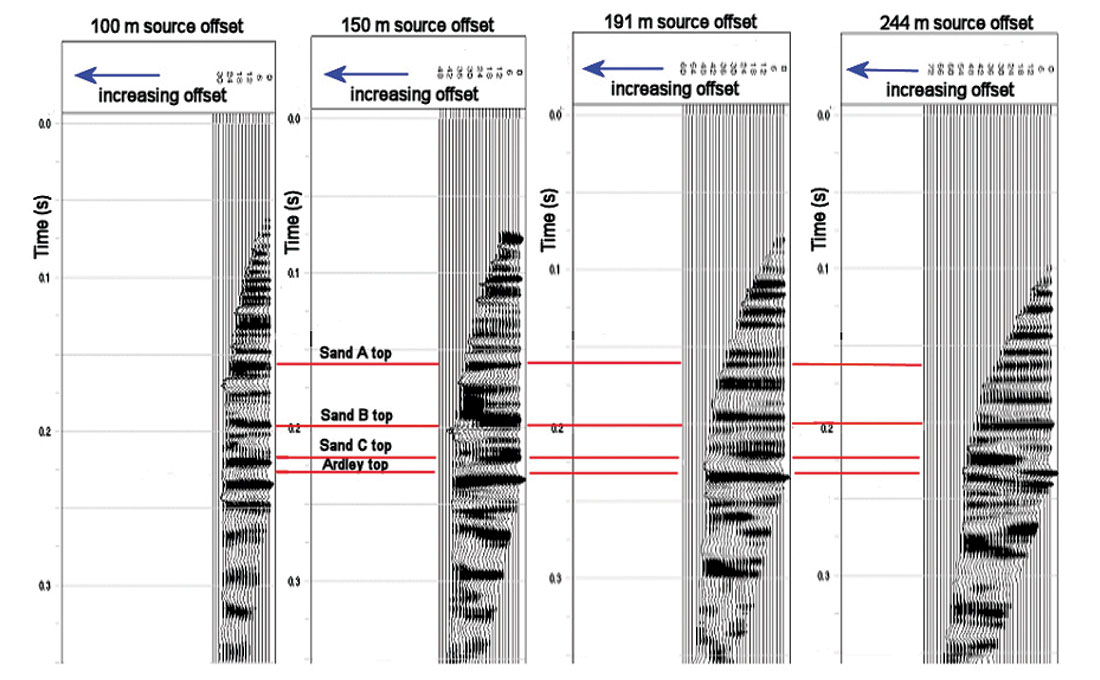
Walkway VSP surveys demonstrate good quality compressional and converted-wave images of the coal zone in the vicinity of the well-bore (Figures 2 and 3). Reflectivity analysis of the top-of-coal reflection demonstrates that PP reflectivity values differ substantially from those predicted by single-interface numerical modeling. Detailed modeling, including several interfaces within the coal zone as well as the base of coal reflection, yields predicted reflectivity values close to those extracted from field data, demonstrating the influence of thin-bed tuning on field data. PS reflectivity values, however, match those predicted by single-interface numerical modeling well, indicating that they are less influenced by tuning effects than the PP reflectivity values.
Additional modeling was undertaken to assess time-lapse imaging of the coal zone during dewatering. Such time-lapse seismic imaging may be able to monitor changes in the reservoir resulting from dewatering, thus allowing optimization of a development plan for CBM production.


Join the Conversation
Interested in starting, or contributing to a conversation about an article or issue of the RECORDER? Join our CSEG LinkedIn Group.
Share This Article