The Albacora field is located in the Campos Basin offshore Brazil. It contains several reservoirs, mainly sandstones and carbonates. The geology is complicated with salt bodies of various thicknesses. The thickness of these salt bodies can vary from 50 m to 1000 m (Lima et al., 2009). To add to these complications, the water depth in the area varies across the survey area from 100 m to about 1600 m. The 4C Ocean Bottom Cables (OBC) data that we tried to tame were acquired in 2010 covering an area of 485 km2.
This project offered us opportunities to develop and test innovative workflows and tools. Two data sets were processed: compressional waves (PP) and converted waves (PS). A P-wave velocity model, Vp, can be built with conventional depth velocity model building techniques, but the S-wave velocity model, Vs, involves the additional challenge of event co-location.
We developed a method to use both the up-going and down-going PP data to update the Vp model. For the Vs modeling, a new joint PP-PS tomographic approach was developed that simultaneously inverts PP and PS residual move-out (RMO) while using horizons to co-locate PP and PS events.
Data Processing and Initial Model building
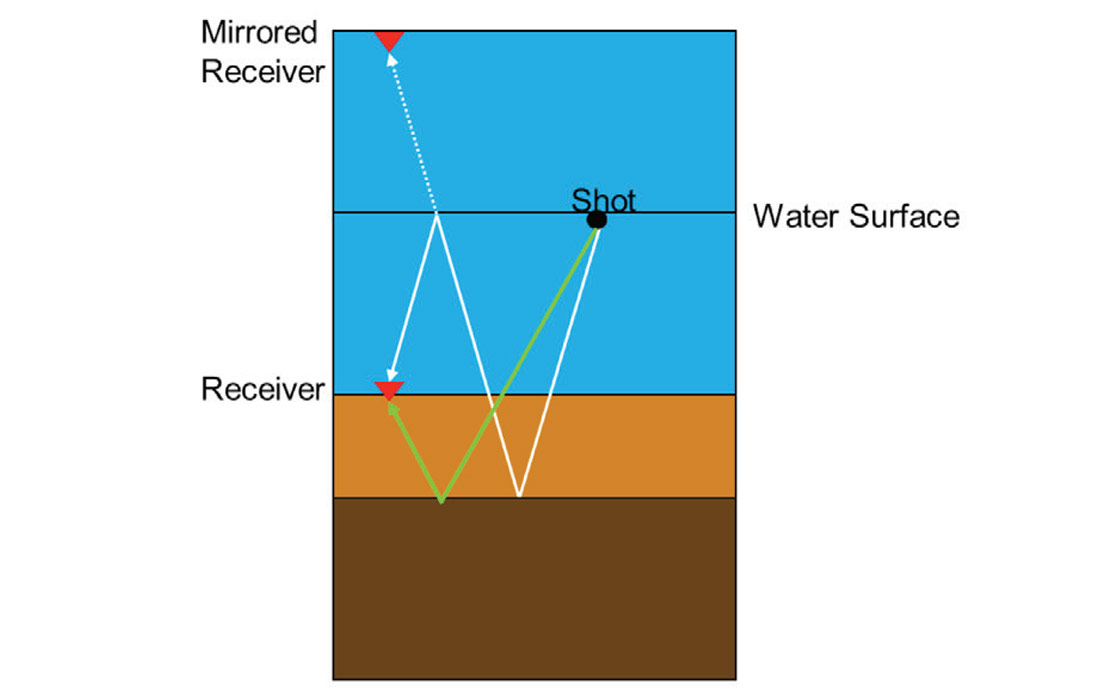
In an OBC survey the shots are close to the sea surface and the cables with 4C sensors (a hydrophone and a 3C geophone or accelerometer) are located on the ocean bottom. Apart from the ability to overcome obstacles such as production platforms, an additional motivation for recording 4C OBC data is to obtain PS data in marine environments. The PP wave-field recorded by the hydrophone and vertical component geophone can be decomposed into up- and down-going components (see Figure 1) with the horizontal components of the geophone recording the PS wave-field.
The OBC processing sequence included source designature, integration of the accelerometer data to obtain the particle velocity and 3C rotation to vertical, radial and transverse components. This was followed by wave-field separation just above the seabed of the PP data into up- and down-going wave-fields, noise-attenuation and a de-multiple sequence.
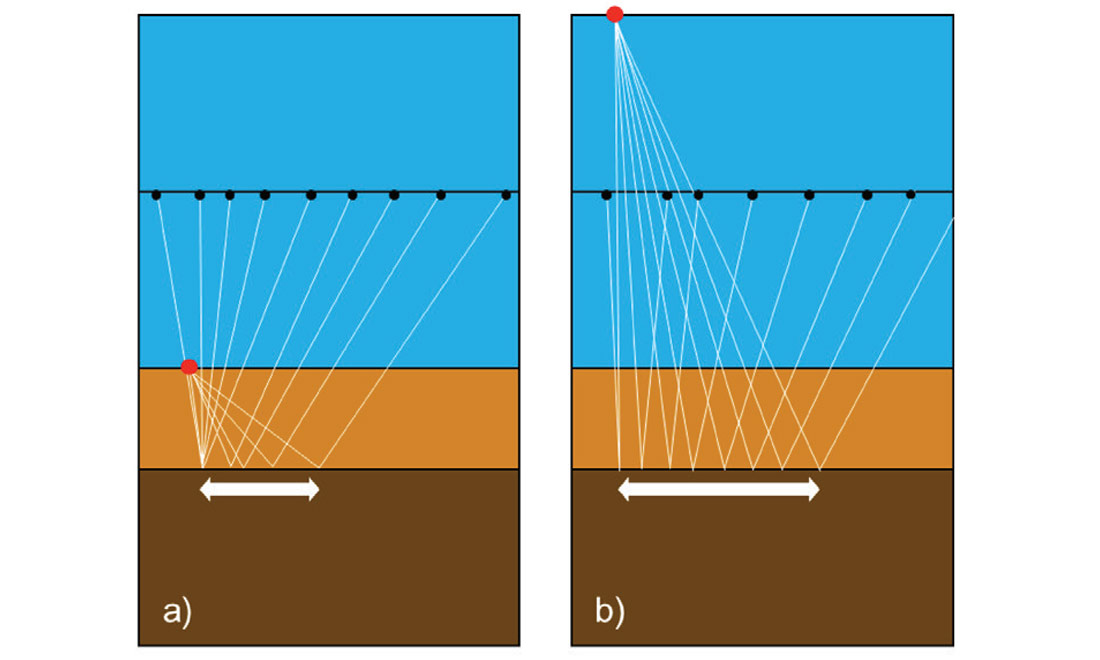
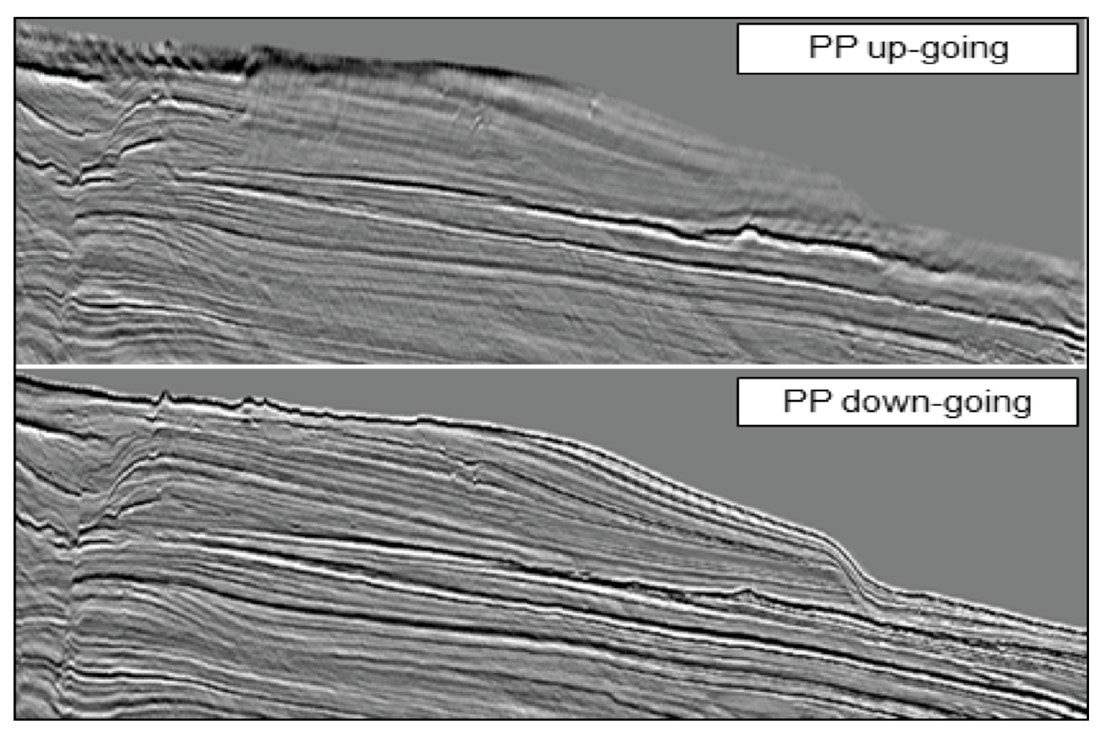
The up-going PP data typically suffers from poor illumination in the shallow. The down-going PP data, on the other hand, has better shallow illumination and the water bottom reflection is clearly visible. The illustration in Figure 2 shows the illumination differences between the up-going (Figure 2a) and down-going (Figure 2b) PP wave-fields. Figure 3 compares the shallow section of the PP up-going PSDM (top) and the PP down-going PSDM (bottom).
The use of PP down-going data has been previously shown in several cases (Godfrey et al., 1998; Grion et al., 2007). Lecerf et al. (2010) showed the difference in ray-paths between the up- and down-going data. This difference causes different RMO errors on Common Image Gathers (CIGs) for each wave-field, given a velocity model. Therefore, combining the up-going and down-going PP RMO provides additional constraints to the tomography.
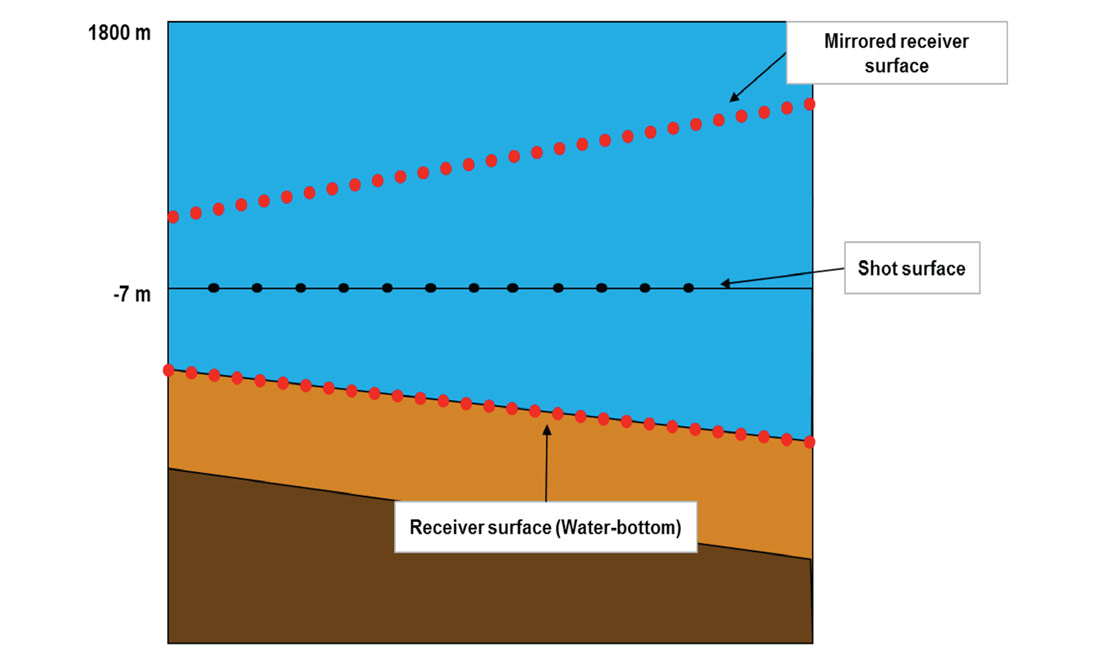
In order to use both the up and down-going PP data for tomography, we used a common geometry as illustrated in Figure 4 (Krishnasamy et al., 2014). A flat datum was selected so that it has an elevation that was high enough to accommodate the mirrored water bottom surface, 1800 m for this particular survey. For the up-going PP PSDM the receiver surface used in the ray tracing was at the water bottom while for the down-going PP PSDM we used a mirror image of the water bottom as the receiver surface. For both cases the shots were left in their original position (7 m below mean sea-level). We used the same geometry for the tomography.
The initial Vp model was built based on key time-interpreted horizons with velocities derived using sonic logs and VSP data. The well velocities were interpolated and extrapolated to cover the entire survey area on a layer-by-layer basis. The initial anisotropy parameters were derived from regional values and interactive analysis on a few selected locations. Initial values for Thomsen anisotropic parameter δ and ε are 5% and 10%, respectively, for all layers apart from the salt.
The initial Vs model is built from Vp/Vs ratios derived from dipole sonic logs with further refinements made by velocity scans in the shallower parts of the model, where no dipole sonic was available.
This initial model was used in a Kirchhoff PSDM algorithm to generate CIGs for the up- and down-going PP, as well as the PS data. Subsequently, these CIGs were used in an automatic dense residual move-out (RMO) picker to generate the RMO picks for the tomography.
Vp Model Updates
The multi-layer tomography used for updating the velocity model for this particular project is an extension of non-linear slope tomography (Guillaume et al., 2012), adapted for data “acquired” at two different recording surfaces. It uses a hybrid model format which defines distinct, spatially-varying velocity and anisotropy fields in each model layer, while also precisely describing layer boundaries. The non-linear inversion scheme performs kinematic de-migration and re-migration of both the RMO picks and the layer boundaries, allowing all layer velocities and layer boundaries to be updated simultaneously. Additionally, the multi-layer tomography is able to take into account external information, for example well-ties to help constrain the updates of the velocity model.
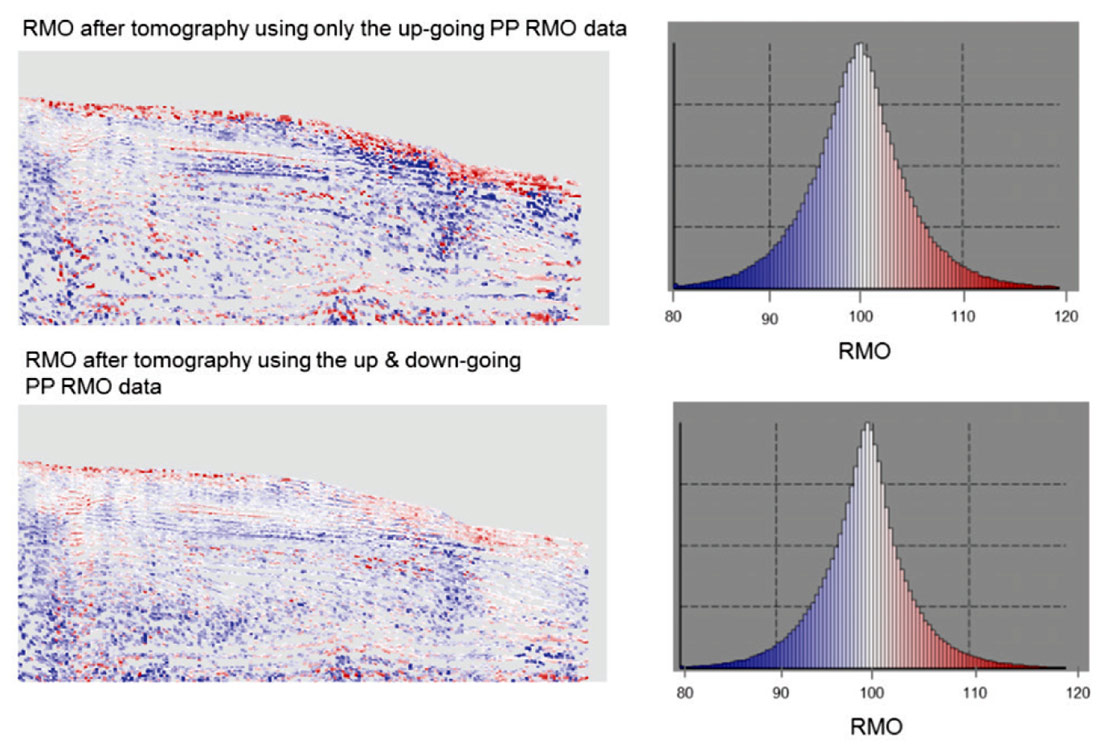
Vp and anisotropic parameter δ were updated using multi-layer tomography using both the PP up-going and down-going RMO information. The down-going PP RMO data provided the tomography with reliable information of the shallow layers and the combination of up-going and down-going PP RMO data provided additional constraints to the tomography for the deeper layers. Figure 5 compares the RMO after the tomographic update using only the up-going PP RMO data (top) and the update using both up-going and down-going PP RMO data (bottom). Images on the left show the spatial RMO distribution for a particular inline and colors indicate RMO values: red indicates under corrected events and blue over corrected events. The histograms on the right show the RMO distribution for the entire survey. We see that tomography using RMO from both the up and down-going PP data produces smaller overall RMO.
Co-location and Vs Model Updates
Conventional Vp tomography relies on flattening CIGs to iteratively update the velocity and anisotropy models. This principle can be extended to joint Vp and Vs model updates where flattening of PP and PS CIGs is sought (Guillaume et al., 2008 and Montel et al., 2009). However, flattening PP and PS RMO typically does not assure co-location of PP and PS events.
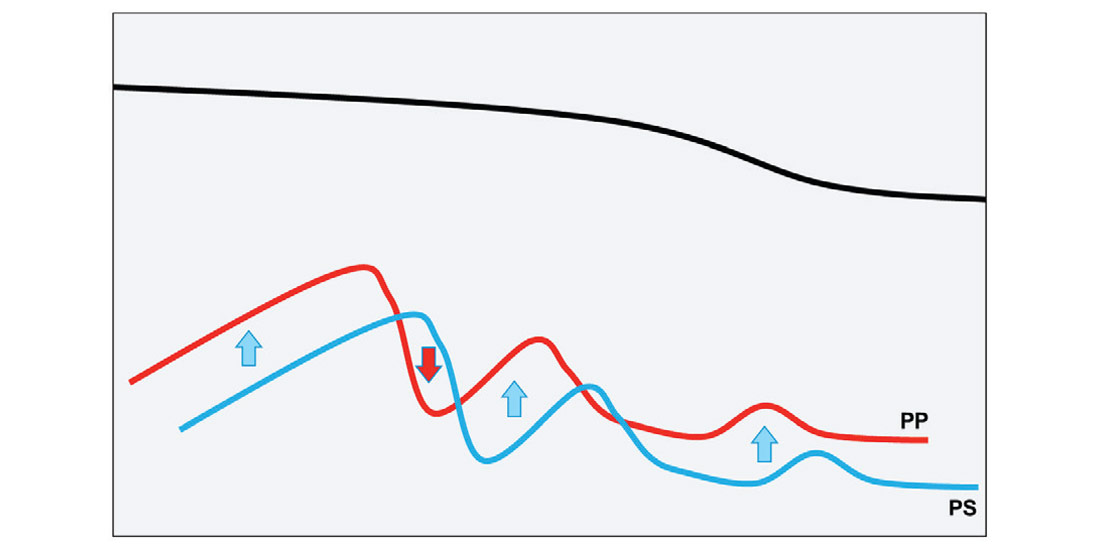
The methodology generally used to perform co-depthing of PP and PS events is a 1D approximation. In this method the depth mis-ties between PP and PS events are used to compute an updated Vs model. Although the approximation is simple, it can produce a reasonably good Vs model for relatively simple scenarios. However, in cases of more complex or realistic geology where there are commonly both lateral and vertical displacements between PP and PS events, as shown in Figure 6, the 1D approximation can result in significant errors in the Vs models.
Borrowing some ideas from Grechka and Tsvankin (2002) and Foss et al. (2005), we developed a new method to co-locate PP and PS events. This new method utilizes an S-ray approximation to map-migrate PS events. In this approach, the mis-positioning between PP and PS events provides a 3D co-location error which we try to minimize in the tomographic update, in addition to reducing the RMO (D’Afonseca et al., 2014).
The map-migration and de-migration of PP horizons relies on normal incidence rays (NIRs). In the case of PP horizons the de-migration step allows us to quantify the depth mis-positioning of PP events with predefined target depths, for example well formation tops, and thus incorporate these errors as additional constraints in the tomographic update. This can be complicated for PS horizons since at normal incidence we do not have PS data. To overcome this complication we make the assumption that the PS horizon is similar to a pure mode shear (SS) event.
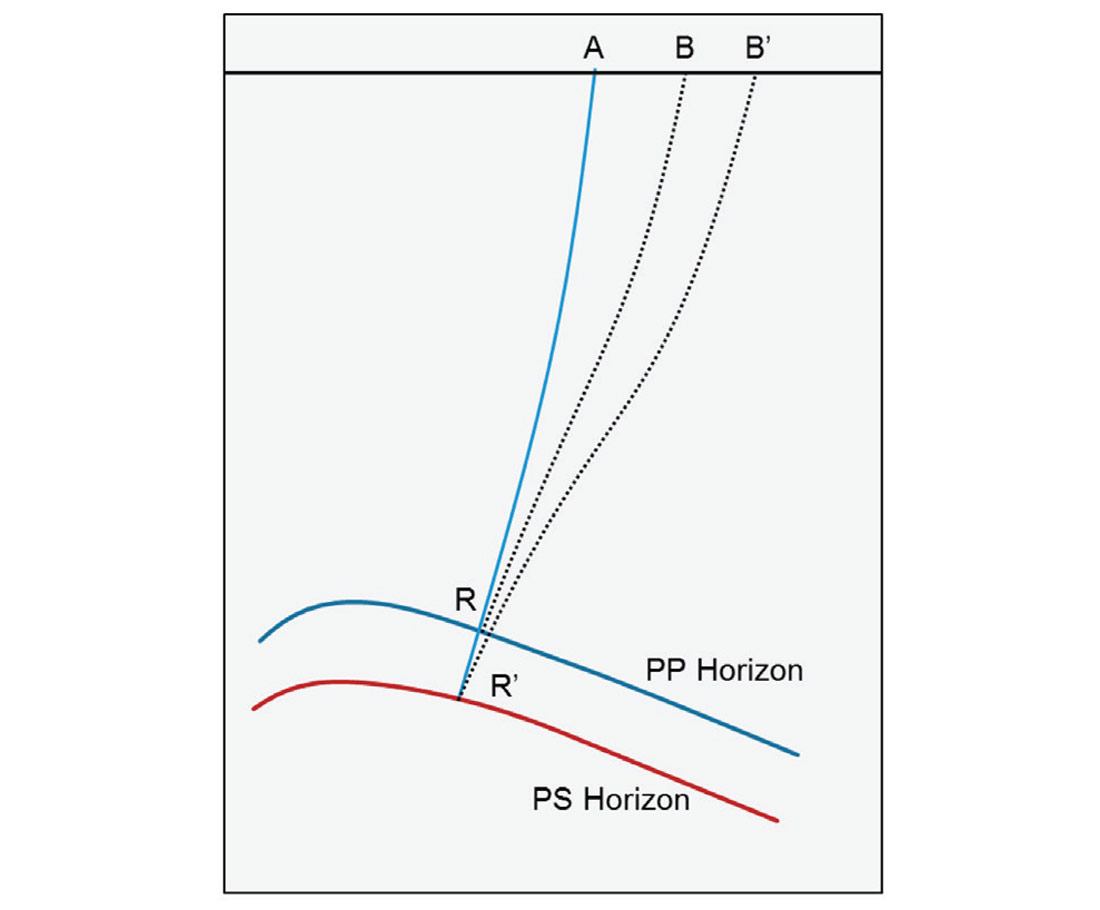
The S-ray approximation used in our co-location methodology is illustrated in Figure 7. The image on the left shows the PP horizon and its normal incident ray, AR, together with Snell’s Law reflection ray pair for the PS horizon, AR (P-ray) and RB (S-ray). When there is an error in the velocity model, the PP and PS horizons are imaged at different depths, the PP horizon is imaged at R and the PS horizon is imaged at R’. Assuming that we have reliable PP horizon depths (Vp is correct) and that both horizons are close (R’ is relatively close to R) we should be able to represent the map-migration of the PS horizon as an SS horizon. Accordingly, this allows us to de-migrate the PS horizon and to quantify the mis-positioning error between the PP and PS horizons which can be used as a constraint in our tomography to update Vs.
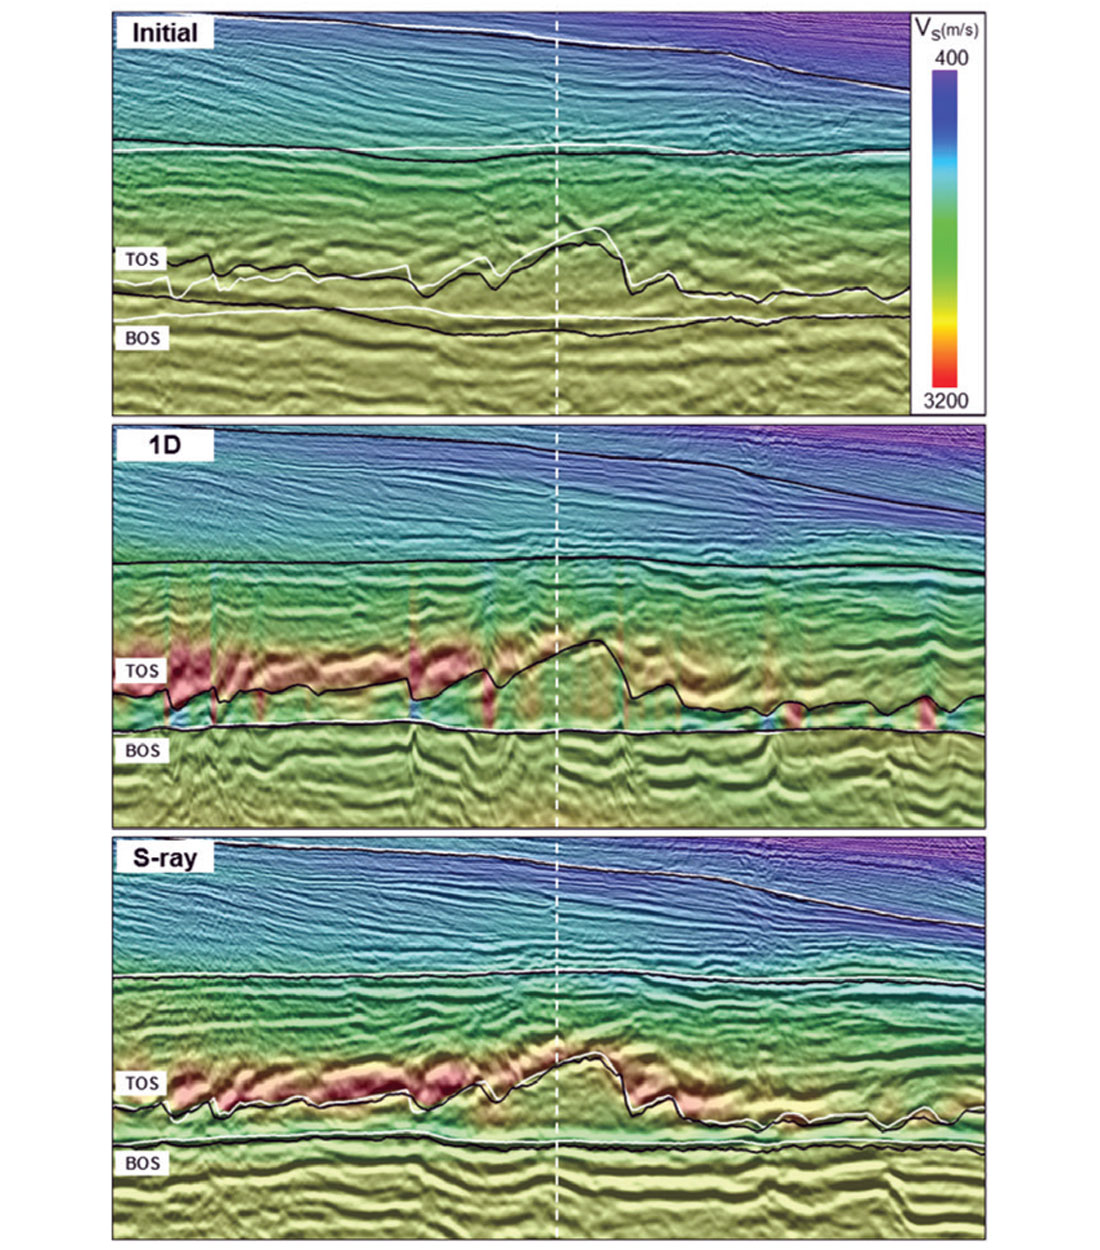
The result from the application of S-ray approximation for co-locating PP and PS events is shown in Figure 8. Each of the PS PSDM sections shown is overlaid with the corresponding Vs model that was used in the PSDM. The PP horizons are in white and the PS horizons are in black. As expected, on the PS PSDM image with the initial Vs model (top) there is a large mis-tie between PP and PS events. The image in the middle shows the resulting PS PSDM image using 1D co-depthing of PP and PS events. Even though an exact match between PP and PS events is obtained, the resulting Vs model shows artefacts close to the top of salt (TOS). The PS PSDM section migrated using the Vs model updated using S-ray co-location is shown on the bottom. While the match between PP and PS events is not exact, the resulting Vs model does not show the same artefacts at the TOS and the resulting PS image is better focused. Importantly, a significant uplift can be seen below the salt layer.
Joint Velocity Model Update Strategy
The objective of the PSDM velocity and anisotropy model updating is to reduce all residuals represented by up and down-going PP RMO, PS RMO and event mis-positioning between PP and PS events, while ensuring good quality well-ties. Even though the tomography can handle all information and update all model parameters simultaneously, our tests indicate that the best results are achieved with a sequence of tomography steps where we carefully select the parameters to update. In each step we carefully weigh the constraints in the tomography between emphasizing the reduction of RMO and co-locating PP and PS events to well formation tops.
The workflow can be summarized in three distinct steps. The first step involves updating the Vp model for the PP data. This includes updating the initial anisotropy parameters. The second step is a joint PP-PS tomographic update to tie formation tops with both PP and PS events. In this step more weight is placed on co-location and well-tie error reduction compared to the reduction of RMO. In this step we updated the Vp, Vs and δ models. This process is repeated until the desired tie between PS and PP events and well-ties with formation tops are obtained. The third step involves running the same tomographic inversion process described above, with the weights on co-location error and well mis-tie error reduction relaxed, allowing further minimization of RMO.
PSDM Results
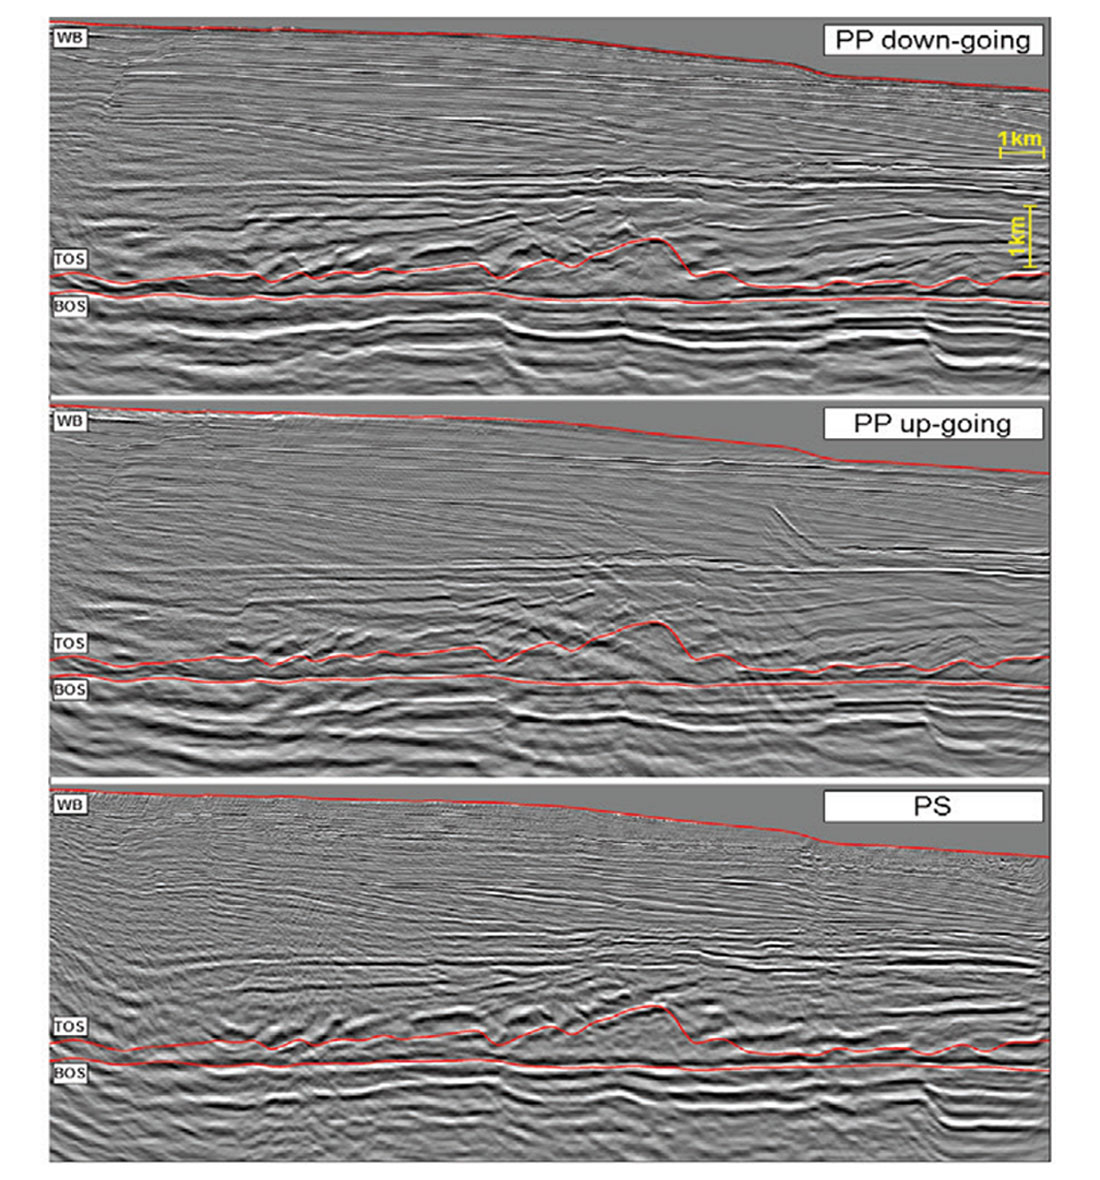
We show the migrated images in Figure 9. These PSDM stacks are obtained using our updated velocity and anisotropic models. The top image is the PP down-going PSDM section: it shows a well-defined water bottom and detailed shallow layers. The middle image is the PP up-going PSDM section. As expected the up-going image suffers from poor illumination in the shallow layers. However, the up and down-going PP PSDM images match quite well. The bottom image shows the PS PSDM section which is similar to the PP PSDM sections; although a slight mismatch between events in the complex structures around the salt layer remains, this difference can be improved by conventional post-migration processing, for example a residual velocity correction or static correction.
Conclusions
We tested and refined several joint PP-PS imaging work-flows and new model building techniques suited to multicomponent seismic data. The integration of down-going data into the PP data processing was important to obtain improved velocity updates in the shallow layers and its use in the tomography workflow helped to further reduce the overall remaining RMO after inversion.
The use of innovative techniques, such as joint PP and PS RMO non-linear slope tomography and S-ray tomography for co-depthing, allowed the development of an effective workflow to update the velocity model attributes related to PS data. Although the PS image does not look as good as the PP image, the migrated images produced by this model showed a high degree of depth matching between PP and PS events.

Acknowledgements
The authors thank PETROBRAS and CGG for permission to publish this work.
Related Reading


Join the Conversation
Interested in starting, or contributing to a conversation about an article or issue of the RECORDER? Join our CSEG LinkedIn Group.
Share This Article