Introduction
The North Sea is a mature hydrocarbon province, with many fields having passed their production peak, and some fields even abandoned. As part of an incentive programme to encourage new exploration and/or revitalization of existing or abandoned fields, the UK government has introduced a number of schemes in recent years, such as the “Fallow Field” and “Promote Licence” initiatives.
These initiatives have started to generate activity by attracting new entrants who can provide additional capital and fresh ideas to focus on exploration and appraisal. In this way, proactive companies have been able to identify and exploit latent commercial prospects by tying-in to existing infrastructure, thereby rejuvenating both abandoned and hitherto overlooked fields.
Here we showcase Calgary-based Oilexco’s Brenda discovery, which could prove to be one of the largest finds in the North Sea in recent years. This discovery was reported earlier this year in the EAGE’s journal The First Break (Jones, et al, 2004).
The key to success in the evaluation of this asset has been the multi-disciplinary approach taken to identify potential targets using the latest pre-processing technology, high resolution velocity model building, and pre-stack imaging, combined with detailed calibrated reservoir attribute analysis based on elastic impedance inversion.
The Geological Setting
During the Palaeocene, the East Shetland and Orkney Platforms were sites of deltaic outbuilding. These platforms were uplifted by significant thermal bulging. The uplifting and over-steepening of the delta and shelf slope systems caused instability and failure resulting in a direct supply of sands and sediments to the basin within density flows. Confined density flows of sand-rich sediment started with erosional scour channels that were not overwhelmed by the volume of sediment supply. These distinct channel fairways mark the sand transport paths. Sands within these meandering channels are characterized as massive sandstones with planar and laminated sandstones and occasional load and dish structures. This type of density flow is common in the later Palaeocene (Thanetian) and can generally be recognized by seismic data due to the contrast between the laterally equivalent shales and claystones.
Initially, Oilexco reported that the uppermost Palaeocene sand was the Forties Member of the Rogaland Group. However, subsequent biostratigraphic analysis has placed this sand within the Upper Balmoral Member of the Montrose Group.
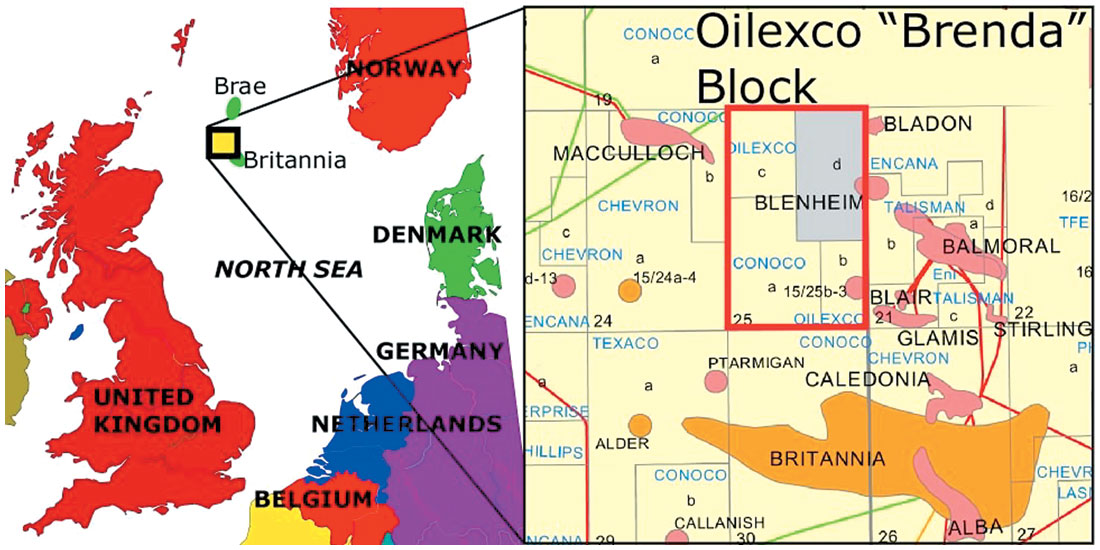
The depositional profile was demonstrated in a Conoco core display at the 2003 UK Petroleum Geology Conference, which utilized the 15/12-1 well as illustrative of the shelf. The Balmoral-age sands were deposited in a sand (wave dominated) delta with clean, winnowed sand building up during a highstand. As the delta front was oversteepened, periodic failure occurred, which triggered debris flows that travelled up to 25 kilometres. This provided the sand reservoirs at MacCulloch and beyond (Figure 1). The cores from the Conoco MacCulloch wells are indicative of sand-rich debris/density flows, similar to the sands Oilexco is seeing within the Upper Balmoral Member in the 15/25b Block. Some of these sand types are described by Conoco as being upper medium-grained, feldspathic, massive sandstone with very rare faint laminations, oilsaturated, friable to uncemented, very high porosity estimated to 30% and with permeability measured from 1 to 2 Darcies.
Oilexco interpreted that the Palaeocene Upper Balmoral “density flow” sand was only partially encountered by the Conoco 15/25b-3 well. The channel was nearly 50 feet thick at the nearby Sun Glamis 16/21a-6 well. In the other direction, the 15/24b-6 well in the down-dip portion of the MacCulloch Field contains over 120 feet of the Upper Balmoral Sandstone Member. The 15/25b-3 well encountered only 22 feet of sand. This sand was fine to medium grained, moderately sorted, and friable. The sedimentary structures of this sand were massive with planar laminations and good visible porosity. The entire sand down to the scour was oil stained with uniform yellow fluorescence and fast streaming cut. Core examination of the Conoco 15/25b-3 well allowed Oilexco to question whether or not the oil was trapped structurally or stratigraphically. An oil/water contact was not evident in the Upper Balmoral sand in this core and a possible stratigraphic trapping mechanism was suspected.
The Drilling Program
Oilexco’s UK North Sea drilling program on Licence P1042 (Block 15/25b) in the Outer Moray Firth targeted oil in the Palaeocene Upper Balmoral Sandstone. Two targets were identified: one on a structural high with classic four-way closure and one on a channel sand feature, whose prospectivity was indicated by an anomalously low elastic impedance (EI) response on the far-offset stack.
The 15/25b-6 well encountered the “Brenda” oil find announced by Oilexco in January 2004. The well intersected a series of oilbearing Palaeocene Upper Balmoral sands, the thickest of which has 26 feet of high quality oil pay. The entire section was tested and yielded 40 degrees API oil from the Upper Balmoral Sandstone at an average rate of 2,980 bbl/d, over an 18-hour test under stable flowing conditions, from 56 feet of perforations (evaluated with open-hole wire-line logs and formation fluid sampling tools). Associated natural gas flowed at an average rate of 600 Mcf/d throughout the test. No water or sand was produced during the test period. The surface location of this well is approximately 150 meters west of Conoco’s 15/25b-3 undeveloped 1990 discovery.
The second well (15/25b-7), which targeted the structural 4-way closure, was found to contain 50 feet of good quality Upper Balmoral sand which was logged as water bearing, and abandoned.
The third well, (15/25b-8) targeted the low EI anomaly. It was located 0.50 kilometres west of the 15/25b-6 well, acting as an appraisal well to the “Brenda” oil accumulation. The well encountered 69 feet of high quality oil pay in the Upper Balmoral sand, and also tested 40 degree API oil, but at rates up to 4785 bbl/d.
As of November 2004, 6 wells and 11 well-bores have been drilled to outline and appraise the Brenda field. Oilexco currently expect first oil during early 2005, with a maximum planned oil production of 35,000 bbl/d.
Seismic Data Pre-Processing
The main aim of the pre-processing was to follow an “Image Driven” approach in order to optimally prepare the gathers for imaging, focussing attention on the potential reservoir interval and underlying chalk sequence. It was imperative that amplitudes be preserved through the processing, since AVO and inversion techniques would be integral in identifying key prospects. The total re-processed area was some 300 sq. km.
Swell noise contamination and cable noise was found to be a problem on a considerable number of sail-lines throughout the survey, therefore a proprietary swell attenuator was tested. The process was found to be extremely effective at minimising swell noise and other anomalous amplitudes while leaving the primary signal untouched.
The presence of steeply dipping noise in shot domain was also noted at this point. The noise had characteristics of “strum”, where a low frequency guided wave is generated along the full length of the cable by the tugging of the paravanes. This is prevalent on the two outer cables. On the basis of the testing results it was decided that the coherent dipping noise would be best handled by application of a dip filter in tau-p space.
Short period water bottom multiples contaminate the data, so great effort was expended in finding the optimum methodology to suppress them. However, due to the danger of guiding demultiple techniques using velocities picked prior to migration, it was considered preferable to aim for a pre-migration demultiple technique which was non-velocity driven, thereby minimizing the risk of attenuating primary energy. A surface related multiple attenuation (SRME) approach was therefore tested. This is a two step process, the first step being a data-driven modelling procedure to estimate the multiple content of the data and the second step being the adaptive matching and subtraction of this multiple model from the input data.
Following SRME, the data were found to contain a certain amount of residual (interbed) multiple energy which was successfully attenuated by application of deconvolution in tau-p space. As dip filtering was required in tau-p space to remove the strum noise, the transform was designed to model only the desired dip ranges, so as to remove the noise.
Velocity Model Building & Pre-Stack Depth Migration
The primary objective of the imaging work was to accurately resolve intricate structural detail above the top chalk marker. Hence, considerable care was taken to derive a detailed velocity model that would honour both structural and stratigraphic variations (Jones and Fruehn, 2003). To achieve this, we employed continuous pre-stack auto-picking in conjunction with gridded tomography (Hardy, 2003).
The initial smoothed depth interval velocity was built from the time-RMS stacking velocity converted to depth interval velocity. The water bottom was picked and gridded, based on an initial migration to create the water layer in the depth interval velocity model.
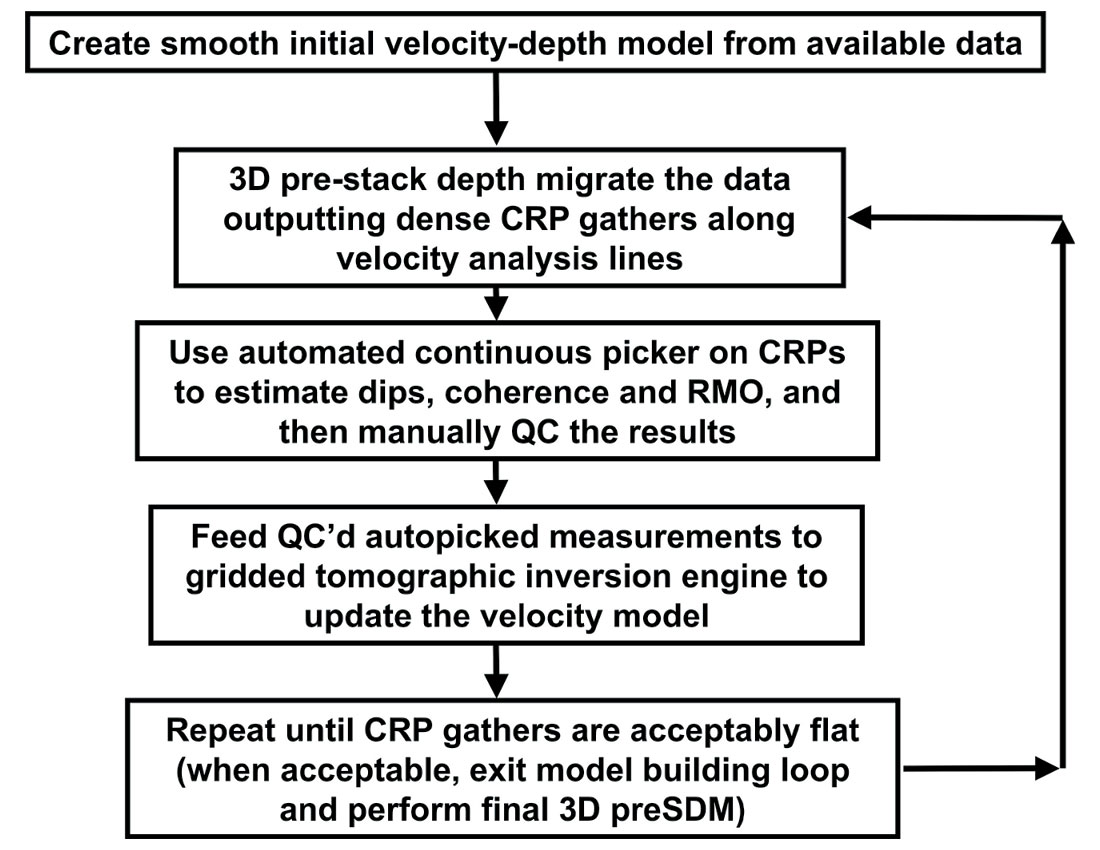
Following this step, we proceeded to three iterations of gridded tomographic update (Sugrue et al., 2003). Each iteration of our tomographic velocity model update consists of two steps (figure 2):
- Dense continuous automatic picking of the migrated seismic gathers to measure any residual moveout, with rigorous manual QC.
- Depth domain tomographic inversion to update the velocity model based on the residual moveout velocity and the local dip-field estimated during the auto-picking.
The autopicker is a proprietary GXT algorithm, based on plane-wave destructors (Claerbout, 1992; Hardy, 2003). A user-defined 3D probe containing trace portions for different CDPs and offsets moves about the data. At each position, two slopes are computed (along the offset and CDP axis) which minimize the amplitude variation in a least squares sense. The quality of this estimate is also computed. As a result of this picking, a 3D slope field and residual moveout estimate are determined, in conjunction with weights indicative of the quality of the picks. For QC of the autopicking, we obtain a residual move-out (RMO) corrected stack of the migrated CRP gathers. This is a good indication of whether the autopicker has found the correct residual moveout in preparation for the tomographic update.
Following the autopicking, the tomography takes the RMO and dip measurements, in conjunction with weights, and generates a tomographic solution to minimize the RMO values (make the gathers flat and correctly position the data).
Following completion of the model building, an amplitude preserving 3D Kirchhoff pre-stack depth migration was performed, outputting all gathers on a 25m x 25m grid.
To flatten any residual moveout after the final migration, we also employ the continuous autopicker. For this dataset, the spatially consistent RMO velocity field was output on a 100m x 100m grid.
Following spectral analysis of the stacked data, spectral shaping using a time and space variant approach was used to increase the apparent maximum bandwidth of the data considerably, without introducing an unacceptable amount of noise.
Reservoir Characterisation
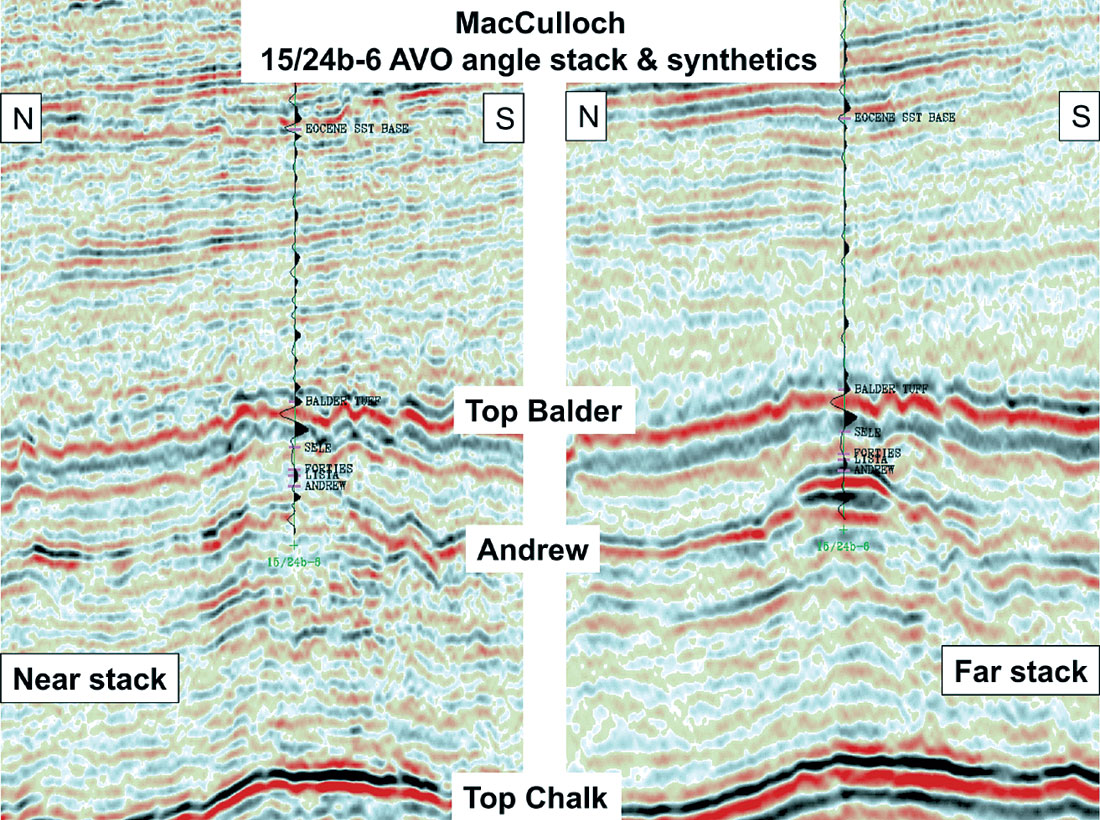
In neighbouring fields it has been noted (Scorer et al., 2003) that the seismic event representing the top of the reservoir is characterized by a “Class III” AVO anomaly (near-offset weak trough, far-offset strong trough) and that this technique has been a good “oil indicator” with an oil/water contact evident. Oil production, and hence the substitution of oil for water, “hardens” the top reservoir response with time-lapse effects being most marked on the far offset data. Scorer et al. note that structural closure does not explain the trap at the MacCulloch Field and that the field trapping mechanism is stratigraphic. The evidence of a stratigraphic trap is demonstrated with their AVO impedance maps that illustrate where the “oil effect” terminates. This is the same type of anomaly that Oilexco is following in the “Brenda” area.
The data were split into two partial angle stacks (0-25° and 25-50°) to be analysed separately. The gathers show some systematic variation of amplitude with offset, which is particularly clear with some filtering, and appear to conform to the expected seismic responses predicted by the well data. Top Balder and Top Chalk horizons were picked. Ideally a pick at the top reservoir would also have been made, however this was not practical as the modelling and subsequent well ties suggests there may be polarity reversals between near and far offset data, depending on both porosity and saturation. Furthermore, the sandstone thickness varies, making it more complicated to pick the top of the event.
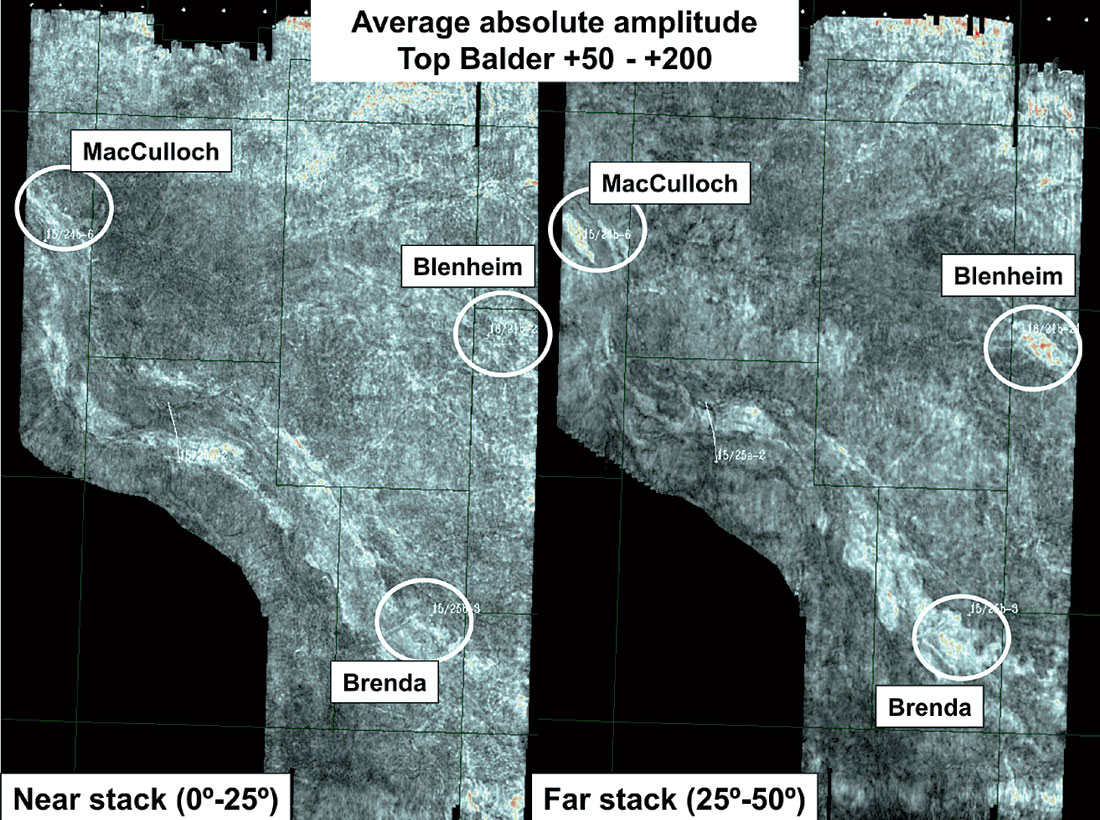
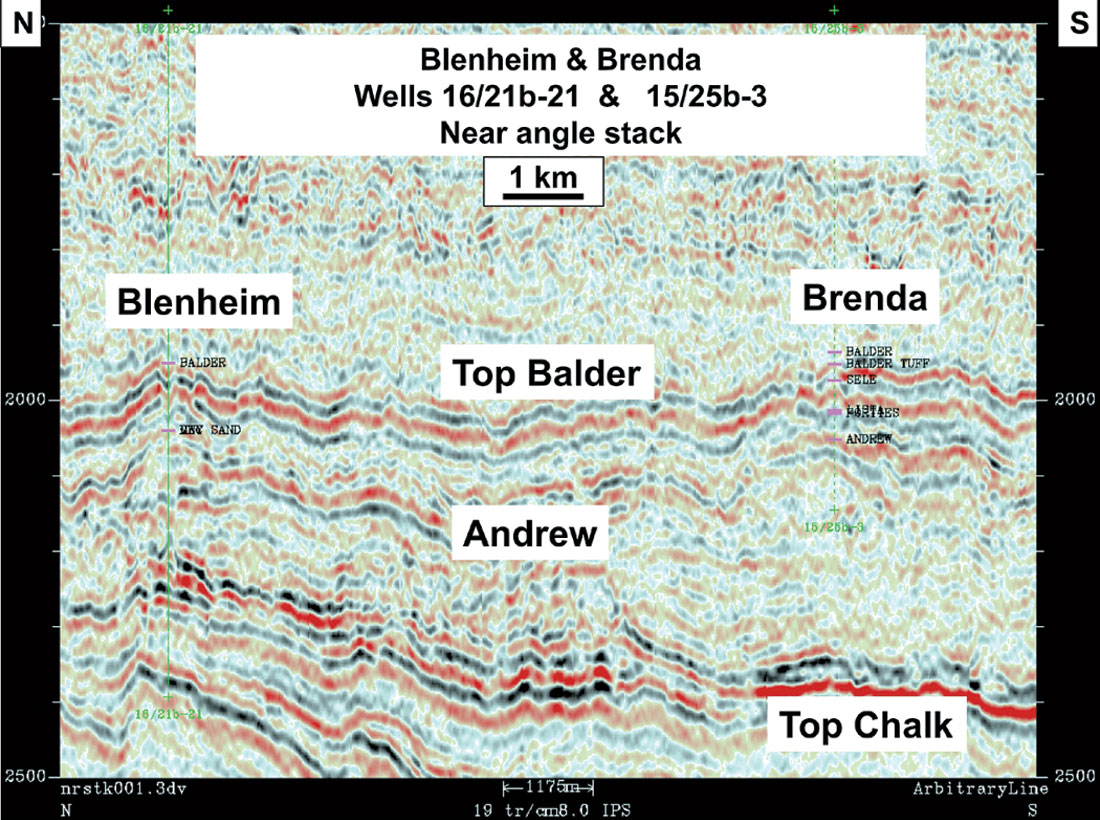
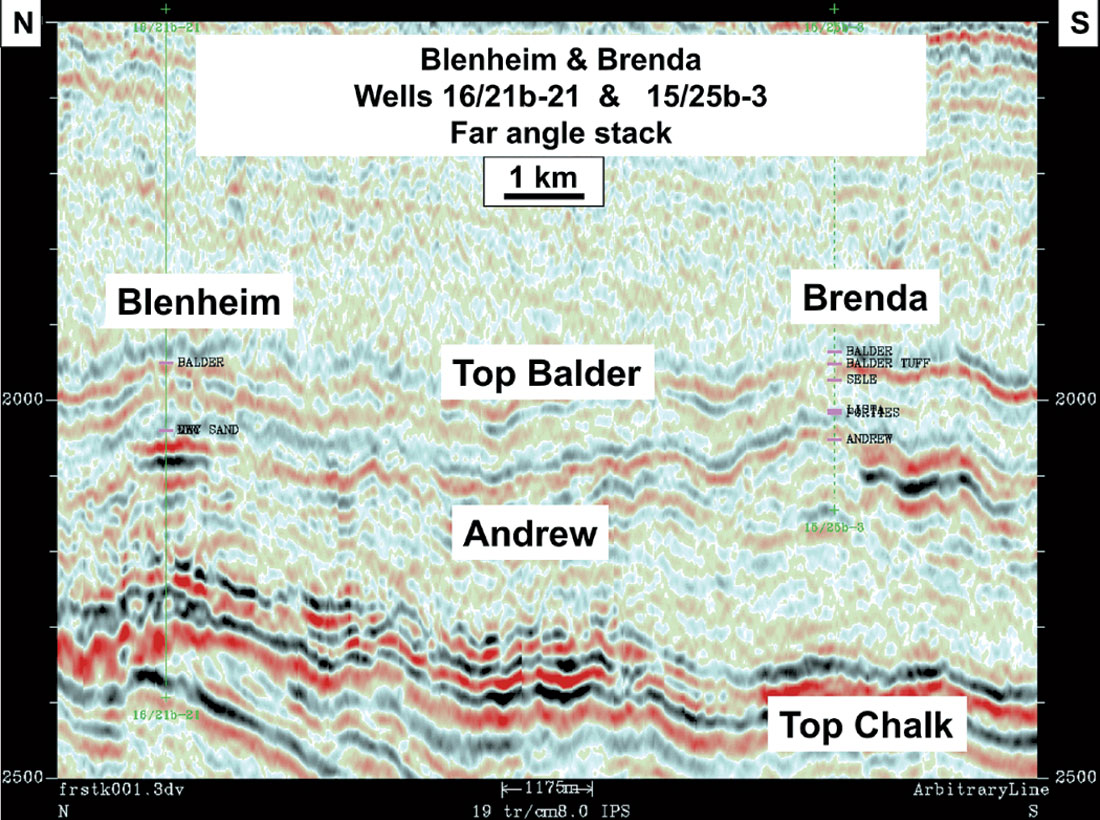
Average absolute amplitude maps were made over an interval 50 ms to 200 ms below the Top Balder (Figure 3). The main channel meandering SE from MacCulloch shows up well on both near and far stack data. On the far stack data parts of the two producing fields (MacCulloch and Blenheim) show up as bright anomalies. Also shown up as bright anomalies are parts of the main channel, in particular the section to the West and South of 15/25b-3. These far stack anomalies are illustrated by the example seismic lines shown in Figure 4 for the MacCulloch Field and Figure 5 for the Blenheim Field and Brenda discovery.
Seismic inversion of near and far stacks
Inversion of seismic data is designed to produce an impedance volume from a seismic data set. A correctly inverted impedance volume should be a good estimate of the rock properties, enabling better prediction characterisation of the reservoir. A standard reflection seismic data set can be modelled as a convolution of the vertical series of rock properties with a seismic wavelet and some level of noise. Inversion requires the extraction of this wavelet, to invert the seismic back to the rock properties.
AVO impedance is an attribute that is designed to optimise the identification of hydrocarbon bearing reservoir by using both near and far impedances together. The underlying principle is to use the two impedance volumes to eliminate the reservoir quality element from the impedance measurements, so that the remaining measure is only of the level of hydrocarbon saturation (Connolly, 1999; Simm, et al, 2003).
In addition to the wavelet and the seismic data, the other main input to the inversion process is a background impedance model. This is required to estimate an absolute impedance, as the seismic data contains no low (<5 Hz) frequency information. This model is built by interpolating the appropriate well logs across the area, using the picked horizons, and then smoothing the resulting model so that only those frequencies that do not lie within the seismic data remain.
It is worth noting that the underlying assumption is made that the well data adequately represents any variation in the rock properties across the area to be inverted. In this case only three wells were available for use, so the control is limited. There was little evidence of a large systematic variation in the rock properties across the area. However, such variations cannot be completely discounted given the small number of wells available.
Inversion results
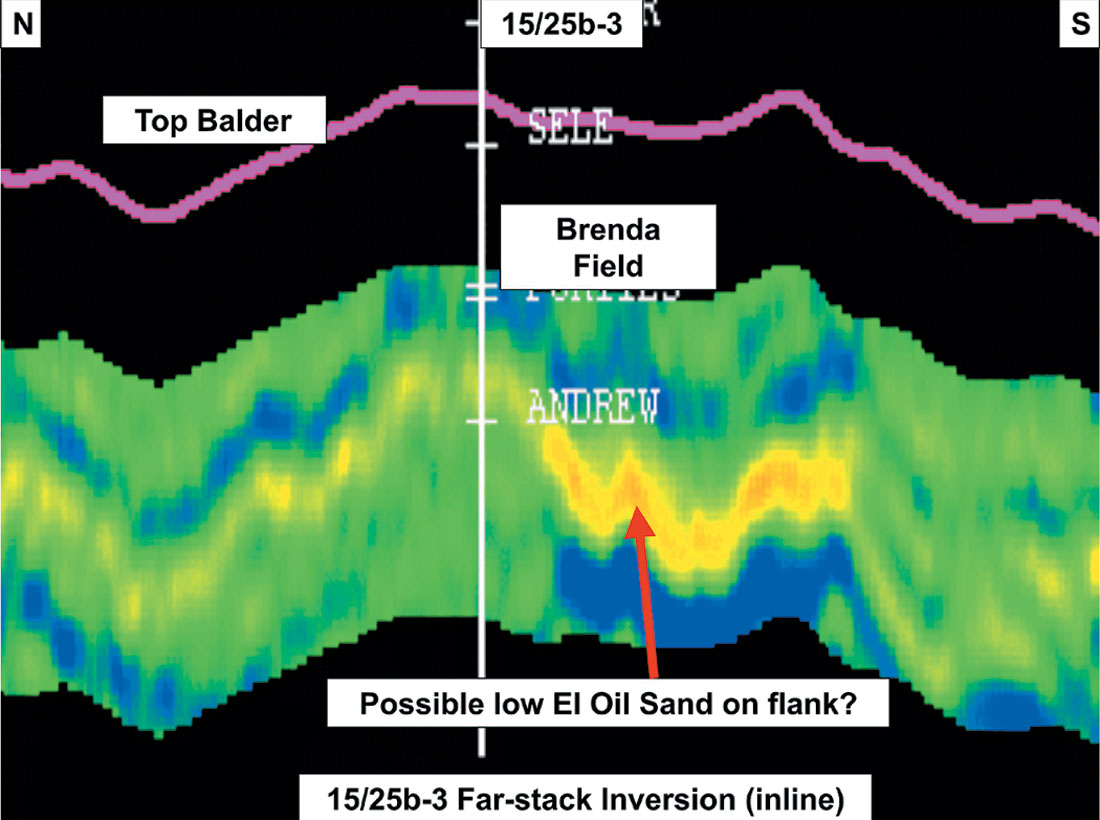
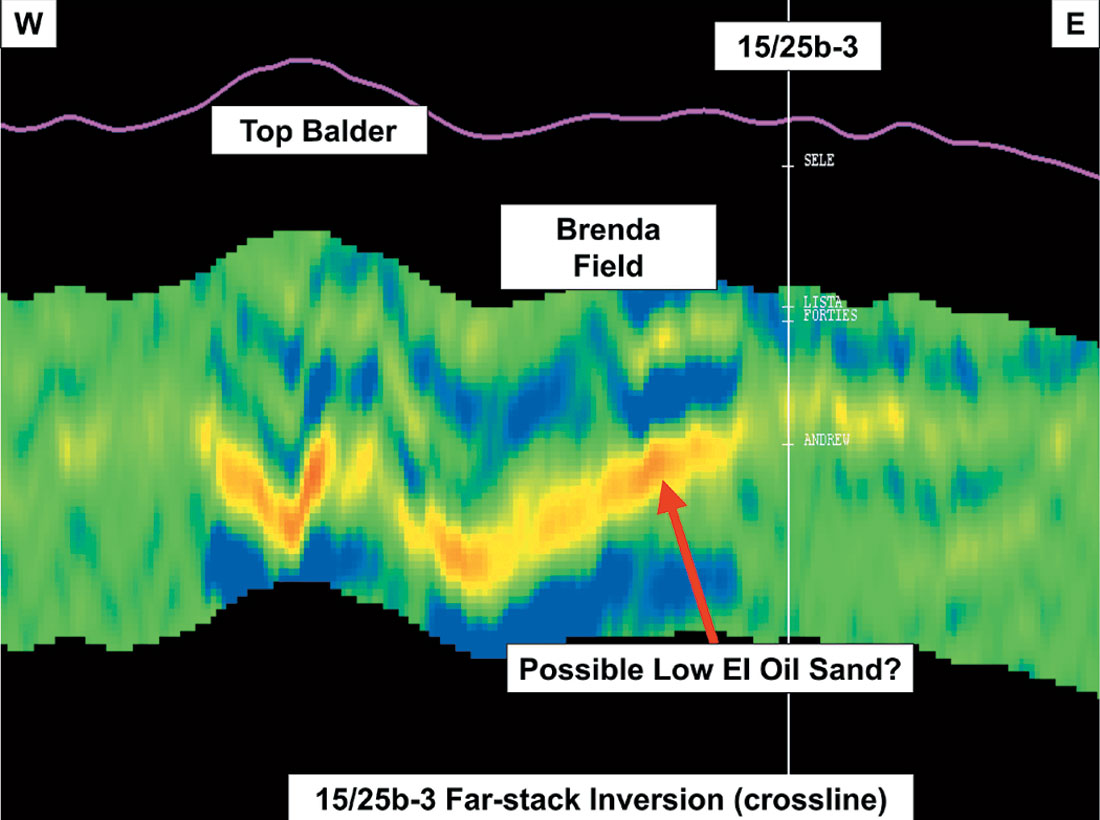
As the known hydrocarbon occurrences and other anomalies are most easily seen on the far impedance volume and given the potential problems of the AVO Impedance volume due to inaccuracies in the near stack volume, the interpretation effort focussed on the far impedance.
Figures 6 a and b show the EI38 results at the new 15/24b-6 location. It is clear that the old 15/25b-3 well is offset from the main hydrocarbon indicator response. Although the background EI38 appears to increase from 15/24b-6 to 15/25a-2, it could be that the low EI38 values at 15/24b-6, due to the presence of oil there, are unduly lowering the background EI38 in the western part of the volume, where there are no control points in the water saturated sandstone. Potential problems like this illustrate that the inversion process must always be considered when interpreting inversion results.
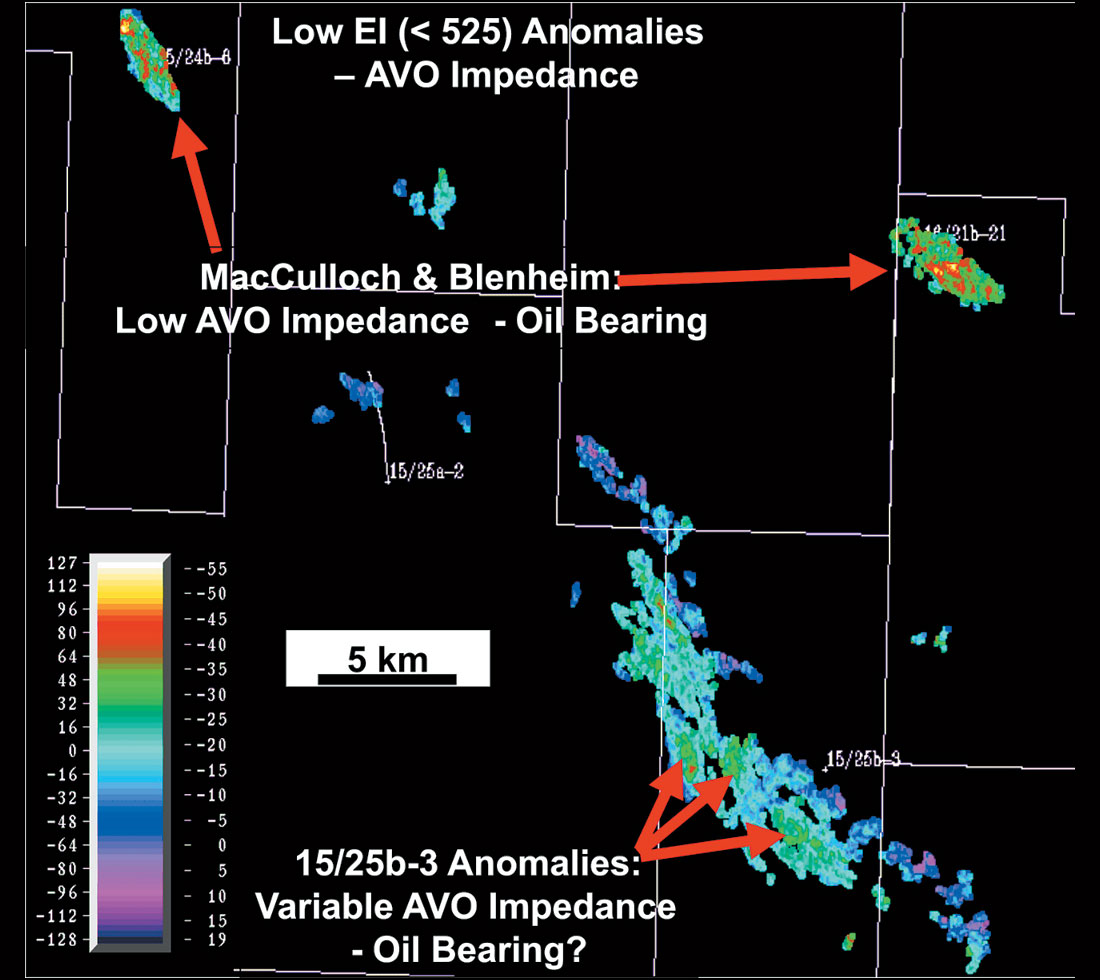
Analysing the results with a 3D visualization package permits an aerial perspective of those parts of the channel sand system with hydrocarbon potential. “Turning-off” all the voxels with values greater than 525 (g/cc)*(m/s) (Figure 7) shows these low EI38 bodies for the area. The major elements are clearly the large series of bodies lying along the channel trend SE of the 15/25a-2 well, and the presence of a body representing the Blenheim Field. The presence of the Blenheim body is important, as it constitutes a “blind-test” of the method because no well data from this field was used in this project. Both the MacCulloch and Blenheim fields show up as having low values of AVO Impedance, demonstrating that this is an indicator of oil-bearing sand. The AVO impedance of the remaining bodies varies from being indicative of oil to some values that are more indicative of water sands, as anticipated from the relative levels of EI15 and EI38 noted above. However, this could be due to the difficulty in reliably estimating EI15, or a thinning of the sands, rather than a real change difference in fluid content. Clearly, further improving the resolution of the data would reduce the uncertainty due to sand thickness and integrating the results of the planned drilling programme would also improve the characterisation of the sands within the block.
Conclusions
Careful “Image-Driven” pre-processing to remove noise and multiple contamination followed by high fidelity velocity model building and 3D pre-stack depth imaging has yielded a data volume suitable for accurate AVO and EI analysis.
Within a depositional channel running SE from the MacCulloch Field, we observe a characteristic low elastic impedance anomaly on the far-offset stack (representative of Palaeocene hydrocarbon- bearing sandstones). A similar anomaly also sits around the structurally high prospect in the NW of 15/25b. The far-offset stack low elastic impedance values can be rigorously tied to well data and to the elastic response characteristics of the neighbouring MacCulloch and Blenheim fields, adding confidence to the interpretation of the low elastic impedance as being characteristic of hydrocarbon bearing Palaeocene sandstones.
Rock physics modelling on the oil-bearing well 15/25b-3 suggests that AVO and elastic inversion analysis should assist in the location of hydrocarbon-bearing Palaeocene sandstones.
The analysis results are unusually unambiguous because of the excellent well control, calibration at MacCulloch and Blenheim fields, and the good quality of the seismic data. Therefore it seems unlikely that the low EI38 bodies are not indicating oil bearing sands. However this requires that a stratigraphic trapping mechanism must exist for many of the bodies identified.

Acknowledgements
The authors wish to thank Oilexco North Sea Ltd, for kind permission to use their data and to colleagues within Oilexco, Ikon Science, Troy-Ikoda and GXT for assistance and advice with this work.


Join the Conversation
Interested in starting, or contributing to a conversation about an article or issue of the RECORDER? Join our CSEG LinkedIn Group.
Share This Article